HAL Id: hal-02557388
https://hal.telecom-paris.fr/hal-02557388
Submitted on 28 Apr 2020
HAL is a multi-disciplinary open access
archive for the deposit and dissemination of
sci-entific research documents, whether they are
pub-lished or not. The documents may come from
teaching and research institutions in France or
abroad, or from public or private research centers.
L’archive ouverte pluridisciplinaire HAL, est
destinée au dépôt et à la diffusion de documents
scientifiques de niveau recherche, publiés ou non,
émanant des établissements d’enseignement et de
recherche français ou étrangers, des laboratoires
publics ou privés.
How Domain Experts Structure Their Exploratory Data
Analysis: Towards a Machine-Learned Storyline
Antoine Barczewski, Anastasia Bezerianos, Nadia Boukhelifa
To cite this version:
Antoine Barczewski, Anastasia Bezerianos, Nadia Boukhelifa. How Domain Experts Structure Their
Exploratory Data Analysis: Towards a Machine-Learned Storyline. 2020 CHI Conference on
Hu-man Factors in Computing Systems Extended Abstracts, Apr 2020, Honolulu, Hawaii, United States.
�10.1145/3334480.3382845�. �hal-02557388�
How Domain Experts Structure Their
Exploratory Data Analysis: Towards a
Machine-Learned Storyline
Antoine Barczewski BlaBlaCar Paris, France [email protected] Fifth Author YetAuthorCo, Inc. Authortown, BC V6M 22P Canada [email protected] Anastasia Bezerianos Univ. Paris-Sud, CNRS, INRIA, Université Paris-Saclay Orsay, France [email protected] Sixth Author Université de Auteur-Sud 40222 Auteur France [email protected] Nadia BoukhelifaUMR MIA-Paris, AgroParisTech, INRAE, Université Paris-Saclay Paris, France
Seventh Author
Department of Skrywer University of Umbhali Cape Town, South Africa [email protected]
Permission to make digital or hard copies of part or all of this work for personal or classroom use is granted without fee provided that copies are not made or distributed for profit or commercial advantage and that copies bear this notice and the full citation on the first page. Copyrights for third-party components of this work must be honored. For all other uses, contact the owner/author(s).
CHI ’20 Extended Abstracts, April 25–30, 2020, Honolulu, HI, USA. © 2020 Copyright is held by the author/owner(s).
ACM ISBN 978-1-4503-6819-3/20/04. DOI: https://doi.org/10.1145/3334480.3382845
Abstract
Exploratory data analysis is an open-ended iterative pro-cess, where the goal is to discover new insights. Much of the work to characterise this exploration stems from qualita-tive research resulting in rich findings, task taxonomies, and conceptual models. In this work, we propose a machine-learning approach where the structure of an exploratory analysis session is automatically learned. Our method, based on Hidden-Markov Models, automatically builds a storyline of past exploration from log data events, that shows key analysis scenarios and the transitions between analysts’ hypotheses and research questions. Compared to a clustering method, this approach yields higher accuracy for detecting transitions between analysis scenarios. We ar-gue for incorporating provenance views in exploratory data analysis systems that show, at minimum, the structure and intermediate results of past exploration. Besides helping the reproducibility of the different analyses and their results, this can encourage analysts to reflect upon and ultimately adapt their exploration strategies.
Author Keywords
Exploratory data analysis; log analysis; sensemaking; prove-nance; storytelling; machine learning; visualization.
Introduction
Exploratory Data Analysis (EDA) is an iterative process of knowledge discovery where the goal is to find interesting, non-trivial patterns in the data, or insights [23, 15]. This ex-ploration can be complex, involving multiple hypotheses, multiple users and even distributed setups. Current EDA tools provide a myriad of statistical and visual methods to analyse data and to inspect it from different perspectives, as well as some support for viewing the history of explo-ration, such as past analysis steps or data queries [17]. However, little support is usually provided to show high-level information to entice users to reflect upon and make sense of their past exploration. This could provide opportunities to review and share insights, but importantly, it can potentially improve user exploration practices and strategies [10].
Figure 1: Previous study SPLOM tool (top) and study setup.
In previous work [5] we conducted an observational study with domain experts from agronomy, who explored com-plex model simulation datasets using an existing visual-ization tool [13, 9]. Their main exploration task was open ended, but the goal was to explore alternative model trade-offs (e.g., between the amount of fertilisers supplied and the quantity of wheat crop yield). Through qualitative anal-ysis of video recordings of multiple exploration sessions, we found that domain experts appear to structure their in-vestigation into mini-analysis scenarios, during which they explore different hypotheses and research questions.
The exploration tool that we used had basic history visual-ization widgets showing the views experts visited over time, and the data queries they made. The exploration sessions were helpful and our domain experts found interesting in-sights in the form of correlations and temporal trajectories. However, despite the history widgets provided, experts ap-pear to loose track of their analysis steps and the many alternative trade-off scenarios they were trying to
com-pare: “What was the basis of the reflection here? In fact, we seem to go faster than we have time to note down” (a par-ticipant from study [5]). Moreover, our domain experts were not able to build a clear mental model of past exploration, nor did they have any means to evaluate whether they had a robust or exhaustive exploration strategy [26]. Indeed, the lack of support tools for sensemaking of past exploration is common in many EDA systems [19, 10, 16].
In this work, our goal is to model the exploration history of the aforementioned exploration sessions, and to present them to the analysts as high-level views of their past ex-ploration. We aim to establish a methodology to automat-ically detect key analysis stages of the exploration (sce-narios), which correspond to the change of focus in the search space. To detect such changes, we use unsuper-vised learning and time series modelling (Hidden Markov Models HMM), which better suite our exploratory context.
Our contributions are: (1) an algorithmic approach based on HMM to characterise exploration history and predict analysis scenarios; (2) three brainstorming sessions to gather design requirements for history log visualization; and (3) a preliminary implementation of a history visualiza-tion in the form of a storyline that integrates the results of the HMM model into our exploratory visualization tool.
Related Work
Qualitative Studies to Characterise EDA
The general sensemaking literature such as the works of Klein et al. [18] and Pirolli et al. [24] provides key insights about the nature of sensemaking activities and the cognitive processes involved. This body of work has inspired later studies that looked at different aspects of sensemaking. In the context of EDA, recent work looked at how analysts manage uncertainty [7]; how they explore various types of
alternatives [19]; and how groups deal with trade-offs [5] and build common ground [14].
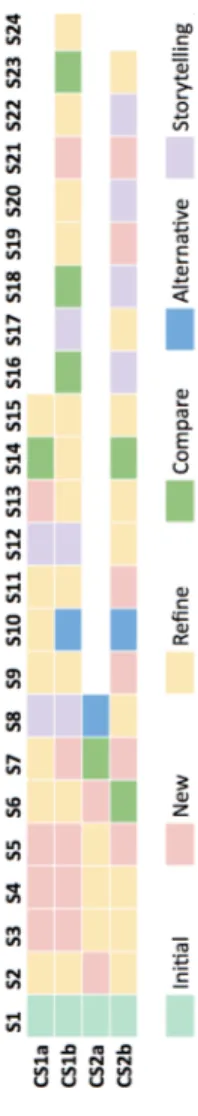
Figure 2: Scenario sequences and types for four exploration sessions, as identified from manual video analysis and coding.
The results of this body of work are often conceptual mod-els, task taxonomies and design recommendations. In par-ticular, work that looked at stages of exploration and the link to shifts in research direction includes Pirolli et al. [24] who characterised the exploration as a non-linear interleaving of new and refined hypotheses and research questions [24]. In the data-frame model [18], re-framing occurs specifically when participants shift their research questions and hy-potheses. These works inspired our own approach to detect structures in the exploration (we call “scenarios”) where an-alysts, at different stages in the exploration, shift their focus into different areas of the search space. We identified sce-narios where analysts examine new and refined research questions and hypotheses, and other scenarios where they learn to appropriate the exploration tool and setup, and at-tempt to recap and establish common ground [5].
Like many studies, our approach to characterise EDA stems from qualitative research and relies on methods such as observational studies, walkthroughs, and interviews. These are time and resource intensive processes requiring man-ual annotations carried out by different coders in multiple iterations. The results are often deep insights but they are hard to generalise or operationalise to specific contexts. Our goal is to establish an automatic procedure to detect key stages in the exploration, and to assist analysts by pro-viding them with a reflective view of their exploration history.
Log Analysis methods and History Visualization
Carrasco et al. [10] argue that log analysis and visualization are not only useful for tracking purposes, but also an oppor-tunity for self-reflection. They show that a visualization of a web browsing history can help users infer areas of improve-ment in their browsing habits. Carrasco et al. contend that
these visualizations should urge self-reflection by providing high-level semantic information. Guo et al. [16] demonstrate that the visualization of interaction logs improves analysts performance in finding insights. In their work, and similar to our previous study, an exploration session is built of var-ious chunks, each composed of generic analysis patterns that lead to insights. Although Guo et al. propose a method to extract those analysis patterns from interaction log data based on action frequency, they do not provide means to detect the chunks (equivalent to our scenarios).
Research in analytic provenance [22, 3, 20] is related to our work, and seeks to understand users’ reasoning pro-cesses through the study of their interactions with a visu-alisation system. The goal of analytic provenance can be general such as collaborative communication and replica-tion [25], or more focused such as predicting users per-sonality traits [8] or detecting cognitive biases [27]. Most of these systems show the different, possibly branching, anal-ysis paths (e.g., [20, 21, 12]). Our work focuses on building an algorithmic approach to automatically retrieve higher-level analysis scenarios (or chunks) from interaction logs of EDA sessions (rather than detailed analysis paths). We hope this high-level grouping will help analysts get a quick summary of their analysis.
Our main method is similar to that of Aboufoul et al. [1] and Dung et al. [11] who used Hidden Markov Models (HMM) to model user’s search behaviour. HMM are powerful to gen-erate sequence of observations and also to learn about the hidden states that produce those observations. In our study, we show that scenarios of experiments can be retrieved when considered as hidden states of a Markov chain. We also show that results from the HMM can be provided in pseudo real time, and therefore continuously provide high-level semantic information to the analyst.
Two Use Cases From Agronomy
Our interaction log data comes from an observational study with two real-world use cases [5], one pertaining to wheat fertilisation and the other to wine fermentation. For each use case, multiple types of experts explored model simu-lation data in two separate exploration sessions, using a scatterplot matrix (SPLOM)-based tool [9] projected on a large shared tactile display (84” screen, see Figure 1). The videos of those exploration sessions where coded, and dif-ferent types of analysis scenarios were identified (Figure 2).
The SPLOM-tool allows multiple query selections to help experts narrow down their search space to important pa-rameters. The system also provides a bookmark history of past query selections and a means to store “favourite” views and queries. Finally, experts can enter new combined dimensions manually through a mathematical formula field, or to evolve them automatically. Log data events that are used in the clustering and machine learning methods in the following section concern user selections of cells in the SPLOM, the favourites store and the bookmark history.
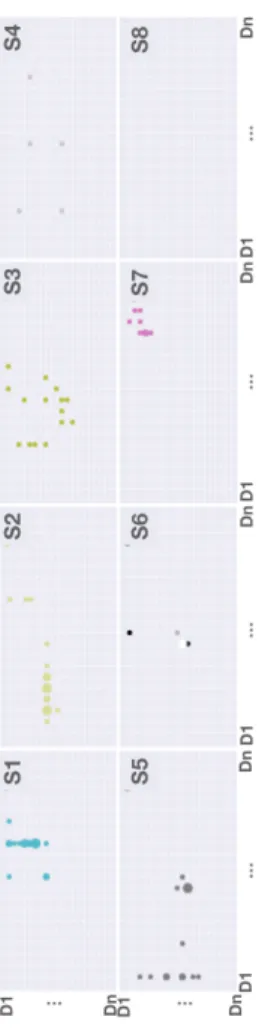
Figure 3: The first eight analysis scenarios of the wine use case S1–8 as identified from video coding. Each grid corresponds to one scenario, rows and columns are data dimensions D1–n. Circles indicate scatterplot visits, and their size the frequency of visits. Analysis scenarios are usually focused on one area of the search space.
A visualization of which scatterplots domain experts con-sulted over time (Figure 3) reveals that very often the anal-ysis scenarios correspond to localised areas of the search space. For example, scenario 1 focused on changes in the amount of nitrogen (N0) at the five different stages of the wine fermentation process (T0, T25, T50, T75 and T100); and in scenario 2 experts examined the relationship be-tween N0 and a target aromatic combination that they en-tered manually. As such, information about the scatterplots visited by experts over time can be used to cluster user in-teractions into different analysis scenarios. In the next sec-tion, we try to use clustering and machine learning methods to detect those scenarios automatically.
A Machine-Learned Exploration Storyline
We implemented two unsupervised methods to detect a change of scenario during data exploration. The first method relies on a spatio-temporal similarity measure to cluster interaction log events into different analysis scenar-ios; and the second method detects scenario transitions using a commonly used statistical approach for time-series and sequential data (Hidden Markov Models). In each case, our ground truth is the labelled video dataset. To evaluate our methods, we build on the existing notions for Type I and type II classification errors. Multi-class classification error metrics could have been used but we would have missed the fact that scenarios are chronologically structured. This structure of the output essentially means that we care much for the change in scenarios rather than knowing that the number of the class is for instance "1" instead of "3".
Spatio-Temporal Distances to Cluster Events
Our clustering approach consists of the following three steps:(1) Data preparation: we group data dimensions into
three generic types pertinent to trade-off analysis and the dynamic nature of the processes that our domain experts were exploring: objectives (quantities experts would like to optimise), parameters (model parameters experts can control or modify) and trajectories (a subset of parameters whose values change over time). At this stage we set the time scale iteratively;(2) Distance Calculation: our
clus-tering approach is based on the distance between area clicks on the SPLOM (cells) calculated using the Jaccard distance. This step yields a distance matrix;(3)
Cluster-ing: we apply DBSCAN algorithm to the resulting distance matrix. This method allows us to group user interactions with the SPLOM that are close both spatially and temporally (based on time elapsed between two events).
Figure 4 shows a timeline visualization of the clustering results (points on the timeline correspond to scatterplot se-lections, colour refers to scenarios). The clustering method detects more scenarios than in the labelled dataset. If we look at scenario transitions only, this method detects cor-rectly only 55% of transitions for the wheat use case, and 61% for the wine use case (e.g., change between scenario 5 and 6 in Figure 4). The clustering method does not per-form well in scenarios where experts were exploring quickly different areas of the search space, more likely to confirm previous knowledge. A major limitation of this method lies in the data preparation and the grouping of data dimen-sions. Our clustering method relies on the three types of di-mensions that we identified as important for our use cases. More importantly, it is highly dependent on the order of rows and columns in the SPLOM, and the time scale we adopted is arbitrary while having a big impact on performance.
Figure 4: Results of clustering (right timeline), left timeline is the ground truth. Dots are scatterplot selections, and color corresponds to scenarios S1–14.
Hidden Markov Models to Detect Transitions
Hidden Markov Models (HMMs) are a statistical approach that tries to model a sequence of events in which the prob-ability of each event depends only on the state attained in the previous event [2]. They rely on the assumption that observations are spawn by “hidden states” whose succes-sions depend on transition probabilities. In unsupervised use cases such as ours, studying the observations helps find the hidden states or patterns in the data. More specifi-cally, when using HMMs, we make the assumption that the hidden states we are looking for somewhat correspond to the analysis scenarios, and that the observations we see (or log events) fall into a Markov system. The hyper pa-rameter we have to test for is the number of hidden states. We set this parameter to two as it yields best results, and conceptually it corresponds to whether or not there is a “change” in the exploration strategy or direction of search.
To build the HMM, we only rely on two types of information: the time-delta between observations, and the combination of the row and the column of each scatterplot that was vis-ited during the exploration. Figure 5 shows the confusion matrix of the HMM we built. As we are interested in detect-ing transitions between scenarios rather than the scenarios themselves, the shape of the path is more important than the number of the inferred labels (the closer to a diagonal the better). Figure 5 shows for instance that change of sce-narios are well detected for (true) labels ranging from 5 to 9. For the wheat use case, our HMM detects scenario transi-tions in 75% of cases, and in 91% for the wine use case.
User Requirements for Provenance Visualization
Our goal is to visualise the results of the exploration history to analysts. In particular, we envisage a visualization that incorporates the results of the HMM method discussed ear-lier. To gather user requirements for such visualizations, we organised three brainstorming sessions with nine partici-pants (in addition to the authors of this paper), each ses-sion lasted around two hours. Participants of two sesses-sions had design, HCI or visualization background (five partici-pants); and for the remaining session we recruited domain experts from an agronomy research centre (four partici-pants). Participants were researchers or PhD students.
Sessions were organised in two parts: (i) a training part to teach participants how to use our tool, similar to the train-ing task we used in previous studies [4]; (ii) an ideation part where participants brainstormed about the functionalities our SPLOM-tool should have to better support sensemak-ing of exploration history. We used affinity diagrammsensemak-ing and thematic analysis to organise those ideas into the follow-ing high-level user requirements, ordered by how frequently they were mentioned by our participants: (1) story-tell & au-thor; (2) highlight; (3) show trends; (4) preview & replay; (5)
filter views; (6) compare views; (7) group views; (8) show overview & summary; (9) annotate; (10) save & reuse; (11) steer; (12) initialise; and (13) learn & update.
Figure 5: Confusion matrix for HMM, for the wine use case.
In terms of support for storytelling and authoring, partici-pants mentioned creating automatically a storyboard of past exploration and annotating it, for example, by allowing users to tag places where the exploration branched out. Another participant suggested a git-like visualization that gives both an overview of visited cells and possible branching explo-ration paths. Inspired by those requirements and findings from our previous study [5], we decided to implement a sto-ryline of past exploration, where nodes are events linked through time. Analysis scenarios are automatically identi-fied using the HMM method and are visualised using colour (a preliminary implementation is shown in Figure 6). This visualization is integrated into our SPLOM-tool as a widget.
Figure 6: Log visualization widget, nodes indicate scatterplot selections and colour indicates scenarios.
Acknowledgement: We thank
E. Lutton, N. Méjean, A. Tonda and D. Damen for their useful advise and feedback.
Visualizing a Machine-Learned Storyline
To implement our storyline visualization, we use a client-server architecture using the Python web framework Flask. On the server side, user interactions with the SPLOM and scatterplots are stored in a text file. Based on the method-ology devised above, a HMM is applied to detect the hidden states (i.e., the scenarios). As it is an unsupervised ap-proach, the model is applied each time new data points are recorded. We currently update the timeline widget every five minutes or upon user request (via the update button).
On the client side, the storyline widget is implemented in D3.js and is integrated into a web-version of our SPLOM tool. Each node is a user action, and its colour corresponds to a scenario. Clicking on the node renders the correspond-ing scatterplot in the zoomed in area of the user interface, and highlights that cell in the SPLOM through brushing and linking. The storyline visualization widget is placed at the
bottom of the user interface, to avoid interfering with the main exploration tasks.
Discussion and Future Work
We presented early work and a prototype implementation for an algorithmic approach to characterise past exploratory data analysis. Our method uses Hidden Markov Models to detect transitions between consecutive scenarios and yields promising results for the two use cases we tested for. We gathered user requirements for history log visualization and provided a preliminary implementation for a storyline visual-ization showing events and transitions between scenarios.
Our approach could be of interest more generally, to auto-mate portions of the qualitative analysis of interaction logs. But it also has a number of limitations, which will be the subject of future work and improvements, including: (a) our log data comes from a limited set of use cases, focused on trade-off analysis. We plan to incorporate log data from other use cases; (b) our tool is SPLOM-based. How our do-main experts structured their exploration may depend on how the tool’s user interface is organised. However, our ma-chine learning method is generalisable and can be applied to other visualization types, as it only requires information about the data dimensions consulted during the exploration and the time of viewing; (c) currently our method cannot detect branching scenarios and does not scale to longer sessions (e.g., through real-time aggregation [6]).
Furthermore, we plan to enrich our storyline visualization, by detecting different types of scenarios and allowing users to annotate and correct inaccuracies in predictions. We also plan to validate our work with domain experts. In particular, it would be interesting to investigate whether such history visualizations encourage reflection, and whether they result in a change in exploration strategies.
REFERENCES
[1] Mohamad Aboufoul, Ryan Wesslen, Isaac Cho, Wenwen Dou, and Samira Shaikh. 2018. Using Hidden Markov Models to Determine Cognitive States of Visual Analytic Users. (2018).
[2] Leonard E Baum and Ted Petrie. 1966. Statistical inference for probabilistic functions of finite state Markov chains. The annals of mathematical statistics 37, 6 (1966), 1554–1563.
[3] Christian Bors, John Wenskovitch, Michelle Dowling, Simon Attfield, Leilani Battle, Alex Endert, Olga Kulyk, and Robert S Laramee. 2019. A provenance task abstraction framework. IEEE computer graphics and applications 39, 6 (2019), 46–60.
[4] Nadia Boukhelifa, Anastasia Bezerianos, Waldo Cancino, and Evelyne Lutton. 2017. Evolutionary visual exploration: evaluation of an IEC framework for guided visual search. Evolutionary computation 25, 1 (2017), 55–86.
[5] Nadia Boukhelifa, Anastasia Bezerianos, Ioan Cristian Trelea, Nathalie Méjean Perrot, and Evelyne Lutton. 2019. An Exploratory Study on Visual Exploration of Model Simulations by Multiple Types of Experts. In Proceedings of the 2019 CHI Conference on Human Factors in Computing Systems. ACM, 644.
[6] Nadia Boukhelifa, Fanny Chevalier, and Jean-Daniel Fekete. 2010. Real-time aggregation of wikipedia data for visual analytics. In 2010 IEEE Symposium on Visual Analytics Science and Technology. IEEE, 147–154.
[7] Nadia Boukhelifa, Marc-Emmanuel Perrin, Samuel Huron, and James Eagan. 2017. How data workers
cope with uncertainty: A task characterisation study. In Proceedings of the 2017 CHI Conference on Human Factors in Computing Systems. ACM, 3645–3656. [8] Eli T Brown, Alvitta Ottley, Helen Zhao, Quan Lin,
Richard Souvenir, Alex Endert, and Remco Chang. 2014. Finding waldo: Learning about users from their interactions. IEEE Transactions on visualization and computer graphics 20, 12 (2014), 1663–1672.
[9] Waldo Cancino, Nadia Boukhelifa, and Evelyne Lutton. 2012. Evographdice: Interactive evolution for visual analytics. In 2012 IEEE Congress on Evolutionary Computation. IEEE, 1–8.
[10] Matthew Carrasco, Eunyee Koh, and Sana Malik. 2017. popHistory: Animated Visualization of Personal Web Browsing History. In Proceedings of the 2017 CHI Conference Extended Abstracts on Human Factors in Computing Systems. ACM, 2429–2436.
[11] Sebastian Dungs. 2016. Describing user’s search behaviour with Hidden Markov Models. Bulletin of IEEE Technical Committee on Digital Libraries, vol 12, 2 (2016).
[12] Cody Dunne, Nathalie Henry Riche, Bongshin Lee, Ronald Metoyer, and George Robertson. 2012. GraphTrail: Analyzing large multivariate,
heterogeneous networks while supporting exploration history. In Proceedings of the SIGCHI conference on human factors in computing systems. 1663–1672. [13] Niklas Elmqvist, Pierre Dragicevic, and Jean-Daniel
Fekete. 2008. Rolling the dice: Multidimensional visual exploration using scatterplot matrix navigation. IEEE transactions on Visualization and Computer Graphics 14, 6 (2008), 1539–1148.
[14] Nitesh Goyal and Susan R Fussell. 2016. Effects of sensemaking translucence on distributed collaborative analysis. In Proceedings of the 19th ACM Conference on Computer-Supported Cooperative Work & Social Computing. ACM, 288–302.
[15] Georges G Grinstein. 1996. Harnessing the Human in Knowledge Discovery. In KDD. 384–385.
[16] Hua Guo, Steven R Gomez, Caroline Ziemkiewicz, and David H Laidlaw. 2015. A case study using visualization interaction logs and insight metrics to understand how analysts arrive at insights. IEEE transactions on visualization and computer graphics 22, 1 (2015), 51–60.
[17] Jeffrey Heer, Jock Mackinlay, Chris Stolte, and Maneesh Agrawala. 2008. Graphical histories for visualization: Supporting analysis, communication, and evaluation. IEEE transactions on visualization and computer graphics 14, 6 (2008), 1189–1196.
[18] Gary Klein, Jennifer K Phillips, Erica L Rall, and Deborah A Peluso. 2007. A data–frame theory of sensemaking. In Expertise out of context. Psychology Press, 118–160.
[19] Jiali Liu, Nadia Boukhelifa, and James R Eagan. 2019. Understanding the Role of Alternatives in Data Analysis Practices. IEEE transactions on visualization and computer graphics 26, 1 (2019), 66–76.
[20] Karthic Madanagopal, Eric D Ragan, and Perakath Benjamin. 2019. Analytic Provenance in Practice: The Role of Provenance in Real-World Visualization and Data Analysis Environments. IEEE Computer Graphics and Applications 39, 6 (2019), 30–45.
[21] Phong H Nguyen, Kai Xu, Andy Bardill, Betul Salman, Kate Herd, and BL William Wong. 2016. Sensemap:
Supporting browser-based online sensemaking through analytic provenance. In 2016 IEEE Conference on Visual Analytics Science and Technology (VAST). IEEE, 91–100.
[22] Chris North, Remco Chang, Alex Endert, Wenwen Dou, Richard May, Bill Pike, and Glenn Fink. 2011. Analytic provenance: process+ interaction+ insight. In CHI’11 Extended Abstracts on Human Factors in Computing Systems. 33–36.
[23] Gregory Piateski and William Frawley. 1991. Knowledge discovery in databases. MIT press. [24] Peter Pirolli and Stuart Card. 2005. The sensemaking
process and leverage points for analyst technology as identified through cognitive task analysis. In
Proceedings of international conference on intelligence analysis, Vol. 5. McLean, VA, USA, 2–4.
[25] Eric D Ragan, Alex Endert, Jibonananda Sanyal, and Jian Chen. 2015. Characterizing provenance in visualization and data analysis: an organizational framework of provenance types and purposes. IEEE transactions on visualization and computer graphics 22, 1 (2015), 31–40.
[26] Ali Sarvghad, Melanie Tory, and Narges Mahyar. 2016. Visualizing dimension coverage to support exploratory analysis. IEEE transactions on visualization and computer graphics 23, 1 (2016), 21–30.
[27] Emily Wall, Leslie M Blaha, Lyndsey Franklin, and Alex Endert. 2017. Warning, bias may occur: A proposed approach to detecting cognitive bias in interactive visual analytics. In 2017 IEEE Conference on Visual Analytics Science and Technology (VAST). IEEE, 104–115.