Research Article
A Patient-Specific Airway Branching Model for
Mechanically Ventilated Patients
Nor Salwa Damanhuri,
1Paul D. Docherty,
1Yeong Shiong Chiew,
1Erwin J. van Drunen,
1Thomas Desaive,
2and J. Geoffrey Chase
11University of Canterbury, Christchurch 8041, New Zealand 2University of Li`ege, 4000 Li`ege, Belgium
Correspondence should be addressed to Nor Salwa Damanhuri; [email protected] Received 14 March 2014; Revised 30 July 2014; Accepted 31 July 2014; Published 20 August 2014 Academic Editor: Guang Wu
Copyright © 2014 Nor Salwa Damanhuri et al. This is an open access article distributed under the Creative Commons Attribution License, which permits unrestricted use, distribution, and reproduction in any medium, provided the original work is properly cited.
Background. Respiratory mechanics models have the potential to guide mechanical ventilation. Airway branching models (ABMs)
were developed from classical fluid mechanics models but do not provide accurate models of in vivo behaviour. Hence, the ABM was improved to include patient-specific parameters and better model observed behaviour (ABMps). Methods. The airway pressure drop of the ABMps was compared with the well-accepted dynostatic algorithm (DSA) in patients diagnosed with acute respiratory distress syndrome (ARDS). A scaling factor (𝛼) was used to equate the area under the pressure curve (AUC) from the ABMps to the AUC of the DSA and was linked to patient state. Results. The ABMps recorded a median𝛼 value of 0.58 (IQR: 0.54–0.63; range: 0.45–0.66) for these ARDS patients. Significantly lower𝛼 values were found for individuals with chronic obstructive pulmonary disease (𝑃 < 0.001). Conclusion. The ABMps model allows the estimation of airway pressure drop at each bronchial generation with patient-specific physiological measurements and can be generated from data measured at the bedside. The distribution of patient-specific𝛼 values indicates that the overall ABM can be readily improved to better match observed data and capture patient condition.
1. Introduction
Application of respiratory mechanics metrics and modelling is emerging as a means to guide and improve mechanical ven-tilation in critical care [1–6]. Patient-specific models enable understanding of individual lung physiology in critically ill patients and are especially important in ARDS. Patient data can be interpreted to generate an in silico patient model. Various therapies can be tested on this model and the optimum treatment can be found.
One physiologically relevant model of lung morphology is the airway branching model (ABM) [7, 8]. The ABM defines the human lung as a bifurcating tree with 23 gener-ations and the alveoli are present in all genergener-ations beyond approximately generation 17 where gas exchange occurs [9]. The ABM is an idealized model of observed anatomy to which
fluid mechanics can be applied. In the ABM, a pressure drop occurs after each branch due to the resistive components of the airway wall and the head loss [10,11]. By estimating the pressure drop for each of these airway branches, the alveoli pressures can be estimated. This outcome provides the opportunity to monitor “regional” specific alveoli pressures that could be used to prevent overdistension of the lung that could lead to lung injury.
In practice, the ABM has been used to estimate respi-ratory pressure-flow responses in noncritically ill subjects [7, 8, 12, 13]. However, ABM models are very general, using a set of global airway dimensions that do not reflect patient-specific conditions and have not been validated in critically ill patients with respiratory failure. These issues limit bedside application of this model in monitoring or titrating mechanical ventilation.
Volume 2014, Article ID 645732, 10 pages http://dx.doi.org/10.1155/2014/645732
The dynostatic algorithm (DSA) is currently the most well-known method to estimate alveoli pressure by producing the dynostatic curve during breathing condition [14, 15]. The estimated alveoli pressure is based on the assumption that airway resistance is always the same during inspiration and expiration at isovolume. However, the ability of this method to guide therapy is limited because it does not provide or include information about airway resistance. It thus cannot offer further insight into patient-specific condition [16, 17]. Furthermore, the DSA is analysed at an assumed quasistatic state, which does not exist in normal ventilation. Therefore, the proposed patient-specific airway branching model (ABMps) seeks to bridge this gap and merge the DSA and ABM models to estimate the pressure drop using the physiological dimensions of human airways.
In particular, this study develops the ABMps to capture specific airway pressure changes and unique patient-specific clinical information that is not available from the general ABM or DSA. Three models are presented: (1) the general ABM; (2) the dynostatic algorithm; and (3) the patient-specific ABMps. These models seek to add the specificity that the DSA lacks while retaining the ability to capture alveolar pressures and thus introduce a mixture of novel elements to the overall modelling approach. The models are compared in a retrospective analysis using clinical data from critically ill mechanical ventilation patients to validate the overall approach. Weibel’s model [8] includes alveolar volume. However, this work seeks to capture alveolar pressures and thus does not include alveolar volume, which is a difference in the two analyses.
2. Methods
2.1. Patient Data and Analysis. In this study, retrospective
data from Sundaresan et al. [18] was used to compare the three models. This data was from 10 acute respiratory distress syndrome (ARDS) patients in the Christchurch Hospital Intensive Care Unit (ICU). The patients underwent a mod-ified protocol-based recruitment manoeuvre and mechani-cally ventilated at different positive end-expiratory pressures (PEEP) of 5, 10, and 15 cmH2O using a decreasing inspira-tory flow profile [19]. All patients were fully sedated and ventilated using Puritan Bennett PB840 ventilators (Covedib, Boulder, CO, USA) with volume control (tidal volume = 400– 600 ml), synchronized intermittent mandatory ventilation (SIMV) mode, throughout the trial. The clinical trials and the use of the data were approved by the New Zealand South Island Regional Ethics Committee. Further details on clinical protocols are reported in work of Chiew et al. [6]. The clinical diagnoses of the patients are shown inTable 1along with their observed auto-PEEP.
To assess model performance, the area under the pres-sure drop curve (AUC) for inspiration breathing cycle was measured and compared across the models. AUC was used instead of the sum square error due to its unique ability to also capture the pressure drop trend shape as well as its maximum magnitude. Significance tests were carried out using paired Wilcoxon rank-sum test.
Table 1: Summary of patient auto-PEEP settings [19].
Patient Sex Age
[years] Clinical diagnostic
Auto-PEEP [cmH2O]
S1 Female 61 Peritonitis, COPD 10
S2 Male 22 Trauma 12
S3 Male 55 Aspiration 10
S4 Male 88 Pneumonia, COPD 10
S5 Male 59 Pneumonia, COPD 12
S6 Male 69 Trauma 11
S7 Male 56 Legionnaires 7.5
S8 Female 45 Aspiration 12
S9 Male 37 H1N1, COPD 12
S10 Male 56 Legionnaires, COPD 3
Table 2: Physical measurements of bronchial paths [12]. Branch generations Diameter (mm) Length (mm) Reynolds number −1 (ETT) 9 330 390 0 (tracheal) 18 120 775 1 12.20 48 573 2 8.30 19 427 3 5.60 8 307 4 4.50 13 198 5–16 3.50–0.60 10.70–1.70 123–0.60 17–22 0.57–0.43 1.50–0.63 0.56–0.41 23 0.40 0.50 0.02
2.2. General Airway Branching Model. The general ABM
is a symmetrical branching tree with physiological airway branching dimensions [20]. Most of the general ABMs assume that the airway generations go up to 23 generations [11, 12]. In this study, the general ABM models the trachea at generation 0 and the alveoli at generations 17–23.Figure 1
shows the schematic ABM structure and the physical dimen-sions at every branch generation are shown inTable 2[12]. It is assumed that the airway dimensions are kept constant during inspiration.
This modelling approach captures head loss as part of Poiseuille model used. Poiseuille flow is defined as
Generation 0
Generation 1
Generation 2 Generation 3
Figure 1: The airway tree structure in which airways are specified by generation number, beginning with trachea [27].
ΔPn
ΔPn1 ΔPn1
ΔPminor1 ΔPminor1
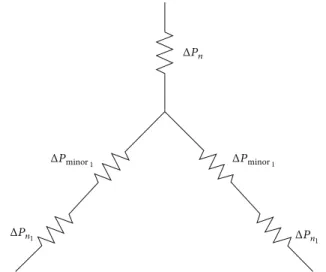
Figure 2: The Poiseuille pressure drop,Δ𝑃𝑛, and minor loss pressure drop, Δ𝑃minor, at each of the branching respiratory systems for ABMps.
where 𝜇 is the dynamic viscosity of air (1.9 × 10⁻⁵Pa⋅s /1.9 × 10−7cmH
2O⋅s), L is the length of the particular airway
branch, D is the diameter of the particular airway branch, and
Q is the flow rate of airway branch.
Head loss is defined as a pressure drop along the branch-ing system which consists of major and minor losses [13]. The major loss is defined as the pressure drop in the straight section of the airway branching system [13]:
Δ𝑃major= 𝑓
𝐿𝑉2
2𝐷. (2)
The model thus assumes that laminar flow exists in the branches since the diameter for all branches is less than 30 mm with Reynolds number being less than 2000 [10,11,21]. Thus, the laminar flow friction factor(𝑓) is defined as
𝑓 = 64
Re, (3)
where Re is the Reynolds number based on the branch diameter:
Re= 𝜌𝑉𝐷
𝜇 , (4)
where𝑉 is the velocity of the flow of the airway branch. The velocity of the flow can be defined in terms of flow rate:
𝑉 = 4𝑄
𝜋𝐷2. (5)
Hence, substituting (3), (4), and (5) into (2), the major head loss can be derived:
𝑃major=
128𝜇𝐿𝑄
𝜋𝐷4 . (6)
Equations (1) and (6) show that Poiseuille flow and major loss are the same.
In this specific model, estimates from [20] incorporate minor loss information due to the bifurcation of each branch starting from generation 1, as shown inFigure 2.
Every time the branch bifurcates to the next generation, there is a change in the velocity distribution. Thus, this airway resistance and minor loss will contribute to the pressure drop over the bronchial paths.
In addition to the resistance component of the bronchial part, there is an additional resistance in the endotracheal tube (ETT). All of these patients had ETT with the same dimensions. The length of the ETT was 330 mm and the diameter was 9 mm [22,23]. The resistance induced by the ETT is added to the overall model results. The ETT is at generation −1 and trachea is at generation 0 and then continues to the remaining generations up to generation 23. With the added ETT in the ABM model, the total pressure drop due to the resistance component, minor loss, and the artificial conducting airway can be modelled as follows:
Δ𝑃ABM= Δ𝑃𝑛+ Δ𝑃minor, (7) where Δ𝑃𝑛= 128𝜇 𝜋 23 ∑ 𝑛=−1 𝐿𝑛𝑄𝑛 2𝑛𝐷 𝑛4 , (8) Δ𝑃minor= 8𝐾𝐿𝜌 𝜋2 23 ∑ 𝑛=−1 𝑄𝑛2 𝐷𝑛4, (9)
where𝐾𝐿is the minor loss coefficient (=2) [24],𝜌 is the den-sity (1.25 kg/m3),𝑛 represents the airway branch generation, 𝐿𝑛 is the length of the particular airway branch, and𝐷𝑛 is the diameter of the particular airway branch. The flow rate of airway branch (𝑄𝑛) is assumed to be half of the previous generation flow rate.
This combined model is unique for this clinical applica-tion [20]. However, it is entirely general based on the data in
2.3. Dynostatic Algorithm Model (DSA). Another pressure
drop estimation is the dynostatic algorithm [15,25]. Proposed by K´arason et al. [14], it assumes inspiration and expiration airway resistances are the same at isovolume (𝑅insp = 𝑅exp
at isovolume). This assumption allows a surrogate of alveolar pressure, known as dynostatic pressure (𝑃dyn), to be estimated
as follows: 𝑅insp=
𝑃insp− 𝑃dyn
𝑄insp
= 𝑅exp= 𝑃exp𝑄− 𝑃dyn
exp , (10)
where 𝑄exp is the expiration flow, 𝑄insp is the inspiration
flow,𝑃inspis the pressure during inspiration, and𝑃expis the
pressure during expiration. The pressure drop (Δ𝑃DSA) during
inspiration is estimated as
Δ𝑃DSA= 𝑃insp− 𝑃dyn, (11)
where
𝑃dyn=
𝑃insp× 𝑄exp− 𝑃exp× 𝑄insp
𝑄exp− 𝑄insp
. (12)
Figure 3shows the DSA curve relative to dynamic pressure
volume data based on these assumptions. However, this model is strictly static and thus cannot capture any dynamic elements of the observed data, as also seen inFigure 3, and instead approximates the possible underlying static curve. The DSA curve would be obtained if every small increment of pressure was held long enough to achieve a static plateau pressure at each volume increment. While it is useful to esti-mate the static alveolar pressures, it is not feasible clinically.
2.4. Patient-Specific Airway Branching Model (ABMps). This
general ABM presented is extended to account for patient-specific physiological conditions observed in measured pres-sure and volume data. The ABMps airway prespres-sure drop is defined as
Δ𝑃ABMPS = Δ𝑃𝑛PS+ Δ𝑃minorPS. (13)
A patient-specific multiplier (𝛼) can be used to uniformly alter the bronchial diameter defined inTable 2to better match the observed data. Incorporating this factor into (8) and (9) yields the following, respectively:
Δ𝑃𝑛PS =128𝜇 𝜋 24 ∑ 𝑛=0 𝐿𝑛𝑄𝑛 2𝑛𝛼4𝐷 𝑛4 , (14) Δ𝑃minorPS= 8𝐾𝐿𝜌 𝜋2 24 ∑ 𝑛=0 𝑄𝑛2 𝛼4𝐷 𝑛4, (15) where 𝛼 is defined as patient-specific relative of airway diameter and is limited to𝛼 = [0.45, 1.50]. If 𝛼 = 1.0, the patient will follow the general airway dimensions proposed by [7]. If 𝛼 is <1.0, the patient-specific airway is relatively smaller than the Horsfield model [7], perhaps indicating that airway constriction. Finally, if 𝛼 > 1.0, the patient has a larger airway. Larger and smaller airways in this context imply
0 5 10 15 20 25 30 35 0.4 0.5 0.6 0.7 0.8 0.9 1 1.1 Viso Qexp Pdyn Qinsp Pexp Pinsp Pressure (cmH2O) V o lu me (L)
Figure 3: The DSA diagram and resulting quasistatic, single line pressure volume curve.
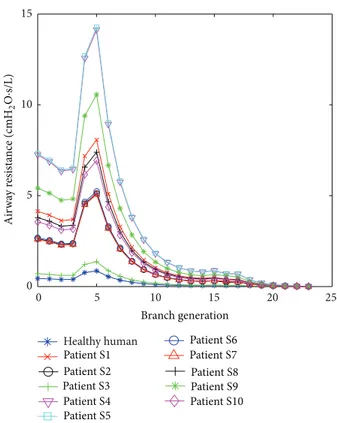
0 5 10 15 20 25 0 5 10 15 Healthy human Patient S1 Patient S2 Patient S3 Patient S4 Patient S5 Patient S6 Patient S7 Patient S8 Patient S9 Patient S10 Branch generation Air w ay r esist an ce (cmH 2 O ·s/L)
Figure 4: Airway resistance for each branch for every patient of the ABMps model.
differences in resistance in the observed data. Hence, they may also capture relative overdistension with pressure as well as patient-specific state.
To estimate a patient-specific 𝛼, Δ𝑃ABMPS is assumed to
be the same as Δ𝑃DSA, where Δ𝑃DSA is the most currently
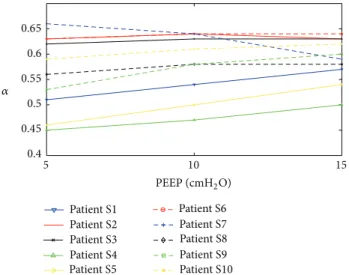
5 10 15 PEEP (cmH2O) 𝛼 Patient S1 Patient S2 Patient S3 Patient S4 Patient S5 Patient S6 Patient S7 Patient S8 Patient S9 Patient S10 0.4 0.45 0.5 0.55 0.6 0.65
Figure 5: Comparison of all𝛼 values for all patients versus PEEP for ABMps.
substituting (14) and (15) into (13), a patient-specific𝛼 can be derived as follows: 𝛼 = 4√ 128𝜇 𝜋Δ𝑃DSA 24 ∑ 𝑛=0 𝐿𝑛𝑄𝑛 2𝑛𝐷 𝑛4 + 8𝐾𝐿𝜌 𝜋2Δ𝑃 DSA 24 ∑ 𝑛=0 𝑄𝑛2 𝐷𝑛4. (16)
The value for 𝛼 for each patient and PEEP value were calculated using measurements ofΔ𝑃DSAand𝑄𝑛 and values
of𝐿𝑛 and𝐷𝑛, fromTable 2in (16). Thus, a different𝛼 value is obtained for each PEEP level and for each patient. The area under the curve (AUC) is the area under the pressure drop curve for all the three models. The AUC of pressure drop with respect to time for a single inspiration cycle shown inFigure 6
provides a good single value measure of the pressure drop when identifying the patient-specific𝛼. The AUC of Δ𝑃ABMPS
is compared with AUC ofΔ𝑃DSAfor all patients at each PEEP
level by calculating the minimum average of the absolute percentage error (APE). This comparison ensures that the model is not overfit to the data but that patient-specific aspects are used to capture and represent the fundamental trend.
3. Results
The estimated airway resistance for each branch generation is presented inFigure 4. The AUC for all 10 ARDS patients and all 3 models are shown inTable 3. It is clear that the general ABM has a very large difference compared to the DSA (𝑃 < 0.05).Table 4shows patient-specific𝛼 that relates to the patient disease state. The𝛼 values for COPD patients were significantly lower than the other patients in the cohort (ranksum 𝑃 < 0.0001, Kolmogorov-Smirnov 𝑃 = 0.001), thus indicating a more resistive airway.
Figure 5 shows the trend of 𝛼 values for all patients
at PEEP = 5 cmH2O, 10 cmH2O, and 15 cmH2O. Figure 6
compares the pressure drop curve for one breathing cycle
for patient S1, as an example, for all three models at PEEP = 5 cmH2O, 10 cmH2O, and 15 cmH2O, with𝛼 = 0.57.Figure 7
shows the pressure and volume curve for all the three models for the same patient and𝛼 value inFigure 6.
4. Discussion
It can be observed in Figure 4 that the airway resistance is higher at the trachea (generation 0) and 5th generation branch for all patients. Initially, the resistance starts to drop from generation 0, which is the trachea, up to generation 4. The resistance starts to rise at generation 5 as the length of the bronchial tube is higher at this generation compared to the previous branches [12]. Airway obstructions increased the airway resistance, as seen inFigure 4, where, for COPD patients, S1, S4, S5, S9, and S10, the airway resistance was higher compared to the healthy human and other patients. With the increased airway resistance in COPD patients, these results clearly show that a higher resistance results in the higher airway pressure drop observed and thus the conse-quent reduced volume. This estimation of airway resistance by the ABMps cannot be done by using the DSA model and highlights a useful feature of this approach.
With the patient-specific 𝛼 value, the airway resistance can be estimated, which leads to estimating the pressure drop. Furthermore, the airway resistance for each patient is different and shows that airway resistance is higher for COPD patients. Thus, this ABMps can be used to detect the disease state independently or automatically, which could not be done by the DSA.
The estimated airway pressure drop using the patient-specific ABMps with𝛼 value was significantly different from the pressure drop estimated using the general ABM (𝑃 < 0.05).Table 3shows that AUC pressure drop in the general ABM typically exhibited very large differences for all patients at all PEEP levels compared to the DSA with𝑃 < 0.05. In contrast, a good comparison is observed between the AUC of pressure drops in ABMps and DSA inTable 3andFigure 6. This result clearly shows that the general ABM does not capture the observed mechanics of critically ill mechanical ventilation patients despite it being a mix of classical mechan-ics and measured behaviour [20]. However, if it is extended with patient-specific 𝛼, it is a far better representation of the patient-specific airway dimension. In addition, these patient-specific aspects dominate the differences from the general ABM modeling approach to matching the patient-specific DSA results. This last result matches the interpatient variability noted in MV patients as a whole and shows the need for a patient-specific approach to estimated model-based alveolar pressures in this cohort.
Figure 6 illustrates an example of estimated pressure
drops for patient S1 between general ABM, ABMps, and DSA models. With𝛼 = 0.57 at PEEP = 15 cmH2O, the AUC of pressure drop for patient S1 in ABMps and DSA yields the same result of 3.33 cmH2O⋅s, where the general ABM yields a far lower 0.36 cmH2O⋅s. This difference indicates that the ABMps was able to predict the same airway pressure drop as DSA by incorporating the𝛼 term that was unique for each
Time (s) 0.8 1 1.2 1.4 1.6 1.8 2 0 2 4 6 8 10 12 ABMps DSM General ABM P ressur e (cmH 2 O)
ΔP of general ABM, ABMps, and DSM
(a) Time (s) 0.8 1 1.2 1.4 1.6 1.8 2 0 2 4 6 8 10 12 ABMps DSM General ABM P ressur e (cmH 2 O)
ΔP of general ABM, ABMps, and DSM
(b) Time (s) 0.8 1 1.2 1.4 1.6 1.8 2 0 2 4 6 8 10 12 ABMps DSM General ABM P ressur e (cmH 2 O)
ΔP of general ABM, ABMps, and DSM
(c)
Figure 6: Comparison of airway pressure drop for one breathing cycle for patient S1 with COPD for general ABM, ABMps, and DSA with𝛼 = 0.57. Plot of general ABM, ABMps, and DSA at (a) PEEP = 5 cmH2O, (b) PEEP = 10 cmH2O, and (c) PEEP = 15 cmH2O.
specific patient’s branching system. Equally, the general ABM, as defined inTable 2, is not capable of accurately capturing the observed mechanics in mechanical ventilation patients. This difference and small error𝛼 < 1.0 value are due to the respiratory failure status of these patients.
From Tables 3and 4, it is also noted that all 𝛼 values for all patients are less than 1.0. Therefore, all pulmonary paths have a smaller diameter than the expected diameters
fromTable 2. This finding reflects the clinical condition of
these patients. In particular, patients with restrictive airway conditions, such as chronic obstructive pulmonary disease (COPD), have constricted airways and respiratory failure by definition. Thus,𝛼 is smaller comparatively (𝛼 = 0.45–0.62) than what would be assumed for a healthy individual, as per
Table 2. Smaller𝛼 value also occurred in aspiration patients
(𝛼 = 0.56–0.63) where the restrictive airway condition of the lung is developed due to the entrance of foreign materials into
the bronchial generations. Thus, with the use of𝛼, ABMps is not only able to capture similar alveolar pressure as DSA but it is also able to track patient disease state over time as shown inTable 4andFigure 5. The greater airway resistance modelled with𝛼 < 1.0 results in higher pressure drops at the alveoli, as expected, and is thus a better match with the DSA. In addition, ARDS patients are often associated with regional airway collapse [26] at higher branch generations, which will also greatly alter the airway resistance [12] and supports the overall interpretation presented for these patient-specific results.
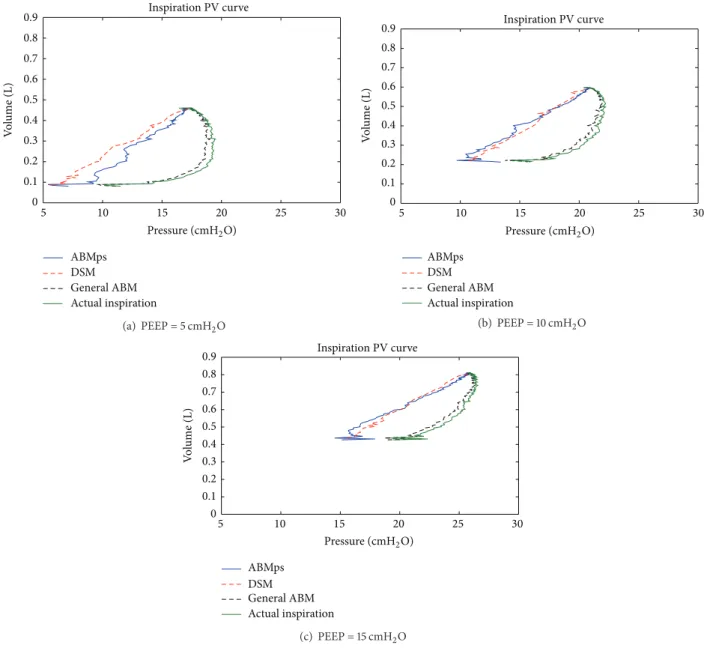
Equally, the inspiration pressure volume curve for the general ABM and the ABMps can be modelled and compared with the DSA and the actual dynamic inspiration pressure volume curve, as shown in Figure 7. The general ABM does not capture alveoli pressure like the DSA in criti-cally ill patients. The general ABM would look a lot like
5 10 15 20 25 30 0 0.1 0.2 0.3 0.4 0.5 0.6 0.7 0.8 0.9 ABMps DSM General ABM Actual inspiration Inspiration PV curve V o lu me (L) Pressure (cmH2O) (a) PEEP = 5 cmH2O 5 10 15 20 25 30 0 0.1 0.2 0.3 0.4 0.5 0.6 0.7 0.8 0.9 ABMps DSM General ABM Actual inspiration Inspiration PV curve V o lu me (L) Pressure (cmH2O) (b) PEEP = 10 cmH2O 5 10 15 20 25 30 0 0.1 0.2 0.3 0.4 0.5 0.6 0.7 0.8 0.9 ABMps DSM General ABM Actual inspiration Inspiration PV curve V o lu me (L) Pressure (cmH2O) (c) PEEP = 15 cmH2O
Figure 7: Comparison of pressure volume curve for patient S1 with COPD for general ABM, ABMps, DSA, and actual inspiration with𝛼 = 0.57.
the inspiration curve inFigure 7and shifted slightly to lower pressure. This outcome occurs because theΔ𝑃 drops are 10 times smaller than theΔ𝑃 drops in the ABMps inTable 3. Thus, the general ABM was not effective at capturing the estimated alveoli pressure volume curve in this cohort.
Both the ABMps and DSA take into account the airway resistance that occur in the lung and lead to the airway pressure drop. Furthermore, the ABMps is designed with minor loss and the patient-specific airway dimension,𝛼, that is unique for each patient. Hence, inFigure 6 the pressure volume curve for the ABMps is very similar to the DSA as PEEP increases from 5 cmH2O to 15 cmH2O with the patient-specific𝛼 = 0.57. Although the ABMps had smaller error in comparison to the DSA at lower PEEP, this inspiration pressure volume curve could still be applied as a guidance tool
for clinicians to provide a better solution for mechanically ventilated patients.
5. Limitations
Although the ABMps estimates pressure drops at every phys-iological airway branch, there are limitations to its predictive capability. This ABMps assumes that the bifurcations run throughout the entire generations from the 1st generation up to the 23rd generation based on physiological measurements and assumption by referring to Weibel et al. model which has been used widely in deterministic studies [8,11,12]. However, this assumption may not be applied in the real scenario if one or more of the bronchial paths are blocked. Nevertheless, the
Table 3: AUC of airway pressure drops for Sundaresan’s patients [18], with PEEP = 5, 10, and 15 cmH2O for general ABM, ABM specific, and DSA. Patient Auto-PEEP (cmH2O) PEEP (cmH2O) Optimal 𝛼
ABMps AUC (cmH2O⋅s) General
ABM AUC (cmH2O⋅s) DSA AUC (cmH2O⋅s) Error = AUC (ABMps-DSA) (%) PEEP 5 cmH2O PEEP 10 cmH2O PEEP 15 cmH2O S1 10 5 0.51 5.35 5.10 5.18 0.37 5.35 0.14 10 0.54 4.22 4.02 4.09 0.35 4.02 0.09 15 0.57 3.44 3.28 3.33 0.36 3.33 0.06 S2 12 5 0.63 3.11 3.03 2.79 0.50 3.11 0.13 10 0.64 2.99 2.91 2.68 0.49 2.91 0.10 15 0.63 3.18 3.10 2.86 0.45 2.86 0.19 S3 10 5 0.62 2.89 2.84 2.62 0.42 2.89 0.11 10 0.63 2.63 2.58 2.38 0.41 2.58 0.08 15 0.63 2.73 2.68 2.47 0.38 2.47 0.15 S4 10 5 0.45 10.0 9.66 10.30 0.40 10.00 0.21 10 0.47 8.20 8.05 8.36 0.40 8.05 0.16 15 0.50 6.59 6.52 6.77 0.41 6.77 0.15 S5 12 5 0.46 8.82 8.45 7.92 0.41 8.82 0.42 10 0.50 6.76 6.48 6.07 0.39 6.48 0.23 15 0.54 4.79 4.59 4.30 0.37 4.30 0.26 S6 11 5 0.63 3.03 2.92 2.92 0.46 3.03 0.07 10 0.64 2.82 2.72 2.72 0.44 2.72 0.04 15 0.64 2.80 2.70 2.70 0.44 2.70 0.03 S7 7.5 5 0.66 1.80 1.84 1.83 0.34 1.80 0.03 10 0.64 1.98 2.03 2.02 0.35 2.03 0.02 15 0.59 2.81 2.88 2.86 0.34 2.86 0.03 S8 12 5 0.56 3.76 3.69 3.71 0.37 3.76 0.04 10 0.58 3.27 3.20 3.22 0.36 3.20 0.03 15 0.58 3.09 3.15 3.11 0.36 3.11 0.02 S9 12 5 0.53 5.96 6.02 6.01 0.48 5.96 0.04 10 0.58 4.42 4.46 4.45 0.49 4.46 0.02 15 0.60 3.74 3.78 3.77 0.49 3.77 0.01 S10 3 5 0.59 3.76 3.62 3.70 0.47 3.76 0.07 10 0.61 3.32 3.20 3.27 0.45 3.20 0.06 15 0.62 3.15 3.04 3.10 0.46 3.10 0.04 Mean 0.58 0.41 4.12 0.07 [IQR] [0.54–0.63] [0.37–0.46] [3.20–4.42] [0.03–0.15]
Table 4: Patient-specific𝛼 versus disease state.
Number of patients Clinical diagnostic Range of𝛼
5 COPD 0.45–0.62
2 Aspiration 0.56–0.63
2 Trauma 0.63–0.64
1 Legionnaires 0.59–0.66
ABMps with the patient specific𝛼 value is capable of show-ing that every patient has𝛼 < 1.0, which reflects that patient’s pulmonary paths have a reduced equivalent diameter that
results in a different resistance as compared to the healthy human physiological measurements. This reduced equivalent diameter thus is a surrogate that captures the (variable) clin-ical condition of each patient. For example, COPD patients have a blockage of bronchial portions of the lungs that reduce volume. In contrast, respiratory failure or ARDS patients may experience a similar total loss of lung volume due to collapsed alveoli distributed throughout the lung. However, in both cases, adjustment to MV settings may be needed to try to recruit this lost volume, and, equally, in both cases, additional pressure is the typical mechanism used for this recruitment.
In this research, the ETT dimensions were the same across all patients. However, while ETT dimensions may vary
between patients, the ABMps remains capable of estimating this pressure drop so that an accurate estimation of the pressure drop in the deep bronchial paths can be used for predicting the alveolar pressure drop. The ETT dimensions are typically known and were consistent in this research, thus maintaining the ability to estimate this alveolar pressure drop, which is important if used to avoid and prevent further lung injury due to the provision of excessive pressure.
Although an average value of minor loss coefficient is used in this model, the ABMps was able to capture the pressure drop in the airway branching system. In addition, at the very low flows at the later generations, the contributions to pressure drop of these minor loss coefficient constants are almost negligible [13]. Thus, the use of this average value of minor loss coefficient and an ETT specific loss capture much of the loss seen. Equally, while a distribution of loss coefficients based on anatomical studies could be used, it cannot be validated given the limited measurements of pressure and flow available in pulmonary medicine. Thus, given these points, an average value is used because it captures the overall losses and pressure drops, even if intermediate pressures may not be fully accurate, and thus provides a good estimate of alveolar pressure, which is the main goal of this model.
With the use of𝛼, ABMps was able to capture similar alveolar pressure as the DSA with further insight of patient-specific airway dimensions during mechanical ventilation. However, due to limited patient data, the application of 𝛼 as a surrogate of patient-specific condition was not fully validated. In particular, as a patient recovers from ARDS, the regional collapsed alveoli may be recruited, resulting in a change in patient airway condition that would be seen in a change in the effective value of𝛼. Thus, the clinical utility of patient-specific𝛼 in tracking patient disease state warrants further investigation over larger cohorts given this initial set of results.
6. Conclusions
A patient-specific airway branching model was derived from a general ABM model and was capable of assessing the pressure drop of the airway using clinically available airway pressure and flow measurements. Using this model, the airway condition of a patient can be characterised and thus could provide clinically useful information to clinicians to guide patient-specific therapy. This result shows that even though the ABMps model is based on simple Poiseuille flow and minor loss equations, the extension to a patient-specific airway dimension,𝛼, produced consistent trends and compared well with the DSA model as the current standard for estimating alveolar pressures. This 𝛼 value could be calculated at the bedside in a similar fashion to offer addi-tional insight beyond the DSA with respect to potential to recruit volume (increase𝛼) and to monitor patient condition. Overall, these results provide a general model framework that can be customised to each patient at the bedside to help guide care. The results justify further prospective trials to assess
the clinical utility of patient-specific value of𝛼 in assessing patient condition.
Conflict of Interests
The authors declare that there is no conflict of interests.
Acknowledgments
Ministry of Higher Education, Malaysia, Universiti Teknologi MARA (UiTM), and EU FP7 Marie Curie Actions IRSES are acknowledged for providing research funding.
References
[1] A. R. S. Carvalho, F. C. Jandre, A. V. Pino et al., “Positive end-expiratory pressure at minimal respiratory elastance represents the best compromise between mechanical stress and lung aeration in oleic acid induced lung injury,” Critical Care, vol. 11, article R86, 2007.
[2] L. Gattinoni, C. Eleonora, and P. Caironi, “Monitoring of pulmonary mechanics in acute respiratory distress syndrome to titrate therapy,” Current Opinion in Critical Care, vol. 11, no. 3, pp. 252–258, 2005.
[3] Z. Zhao, J. Guttmann, and K. Moller, “Adaptive Slice Method: a new method to determine volume dependent dynamic respira-tory system mechanics,” Physiological Measurement, vol. 33, pp. 51–64, 2012.
[4] A. Sundaresan and J. G. Chase, “Positive end expiratory pressure in patients with acute respiratory distress syndrome—the past, present and future,” Biomedical Signal Processing and Control, vol. 7, no. 2, pp. 93–103, 2012.
[5] O. Stenqvist, H. Odenstedt, and S. Lundin, “Dynamic respira-tory mechanics in acute lung injury/acute respirarespira-tory distress syndrome: research or clinical tool?” Current Opinion in Critical
Care, vol. 14, no. 1, pp. 87–93, 2008.
[6] Y. S. Chiew, J. G. Chase, G. M. Shaw, A. Sundaresan, and T. Desaive, “Model-based PEEP optimisation in mechanical ventilation,” BioMedical Engineering Online, vol. 10, article 111, 2011.
[7] K. Horsfield, G. Dart, D. E. Olson, G. F. Filley, and G. Cumming, “Models of the human bronchial tree,” Journal of Applied
Physiology, vol. 31, no. 2, pp. 207–217, 1971.
[8] E. R. Weibel, “Morphometry of the human lung,” 1963. [9] T. T. Soong, P. Nicolaides, C. P. Yu, and S. C. Soong, “A statistical
description of the human tracheobronchial tree geometry,”
Respiration Physiology, vol. 37, no. 2, pp. 161–172, 1979.
[10] K. S. Burrowes, P. J. Hunter, and M. H. Tawhai, “Anatomically based finite element models of the human pulmonary arterial and venous trees including supernumerary vessels,” Journal of
Applied Physiology, vol. 99, no. 2, pp. 731–738, 2005.
[11] I. M. Katz, A. R. Martin, C. Feng et al., “Airway pressure distribution during xenon anesthesia: the insufflation phase at constant flow (volume controlled mode),” Applied
Cardiopul-monary Pathophysiology, vol. 16, no. 1, pp. 5–16, 2012.
[12] T. J. Pedley, R. C. Schroter, and M. F. Sudlow, “The prediction of pressure drop and variation of resistance within the human bronchial airways,” Respiration Physiology, vol. 9, no. 3, pp. 387– 405, 1970.
[13] I. M. Katz, A. R. Martin, P. Muller et al., “The ventilation distribution of helium-oxygen mixtures and the role of inertial losses in the presence of heterogeneous airway obstructions,”
Journal of Biomechanics, vol. 44, no. 6, pp. 1137–1143, 2011.
[14] S. K´arason, S. SØndergaard, S. Lundin, J. Wlklund, and O. Stenqvist, “A new method for non-invasive, manoeuvre-free determination of “static” pressure-volume curves during dynamic/therapeutic mechanical ventilation,” Acta
Anaesthesi-ologica Scandinavica, vol. 44, no. 5, pp. 578–585, 2000.
[15] S. Sondergaard, S. K´arason, J. Wiklund, S. Lundin, and O. Stenqvist, “Alveolar pressure monitoring: an evaluation in a lung model and in patients with acute lung injury,” Intensive
Care Medicine, vol. 29, no. 6, pp. 955–962, 2003.
[16] G. Mols, H.-J. Priebe, and J. Guttmann, “Alveolar recruitment in acute lung injury,” British Journal of Anaesthesia, vol. 96, no. 2, pp. 156–166, 2006.
[17] S. K´arason, S. Søndergaard, S. Lundin, J. Wiklund, and O. Stenqvist, “Direct tracheal airway pressure measurements are essential for safe and accurate dynamic monitoring of respi-ratory mechanics. A laborespi-ratory study,” Acta Anaesthesiologica
Scandinavica, vol. 45, no. 2, pp. 173–179, 2001.
[18] A. Sundaresan, J. G. Chase, G. M. Shaw, Y. S. Chiew, and T. Desaive, “Model-based optimal PEEP in mechanically venti-lated ARDS patients in the Intensive Care Unit,” BioMedical
Engineering Online, vol. 10, article 64, 2011.
[19] A. Sundaresan, J. G. Chase, G. M. Shaw, Y. S. Chiew, and T. Desaive, “Model-based optimal PEEP in mechanically venti-lated ARDS patients in the intensive care unit,” BioMedical
Engineering Online, vol. 10, article 64, 2011.
[20] N. S. Damanhuri, Y. S. Chiew, P. Docherty, P. Geoghegan, and G. Chase, “Respiratory airway resistance monitoring in mechanically ventilated patients,” in Proceedings of the 2nd
IEEE-EMBS Conference on Biomedical Engineering and Sciences (IECBES ’12), pp. 311–315, December 2012.
[21] K. Horsfield and M. J. Woldenberg, “Diameters and cross-sectional areas of branches in the human pulmonary arterial tree,” Anatomical Record, vol. 223, no. 3, pp. 245–251, 1989. [22] A. Sundaresan, Applications of model-based lung mechanics in
the intensive care unit [Ph.D. thesis], Mechanical Engineering,
University of Canterbury, Christchurch, New Zealand, 2010. [23] C. Straus, B. Louis, D. Isabey, F. Lemaire, A. Harf, and L.
Brochard, “Contribution of the endotracheal tube and the upper airway to breathing workload,” American Journal of Respiratory
and Critical Care Medicine, vol. 157, no. 1, pp. 23–30, 1998.
[24] B. R. Munson, D. F. Young, and T. H. Okiishi, Fundamentals of
Fluid Mechanics, John Wiley & Sons, New York, NY, USA, 1990.
[25] S. Sondergaard, S. K´arason, A. Hanson et al., “The dynostatic algorithm accurately calculates alveolar pressure on-line during ventilator treatment in children,” Paediatric Anaesthesia, vol. 13, no. 4, pp. 294–303, 2003.
[26] J. M. Halter, J. M. Steinberg, L. A. Gatto et al., “Effect of pos-itive end-expiratory pressure and tidal volume on lung injury induced by alveolar instability,” Critical Care, vol. 11, no. 1, article R20, 2007.
[27] J. H. T. Bates, Lung Mechanics an Inverse Modelling Approach, vol. 1, Cambridge University Press, New York, NY, USA, 2009.
Submit your manuscripts at
http://www.hindawi.com
Stem Cells
International
Hindawi Publishing Corporationhttp://www.hindawi.com Volume 2014
Hindawi Publishing Corporation
http://www.hindawi.com Volume 2014
INFLAMMATION
Hindawi Publishing Corporation
http://www.hindawi.com Volume 2014
Behavioural
Neurology
Endocrinology
International Journal of Hindawi Publishing Corporationhttp://www.hindawi.com Volume 2014
Hindawi Publishing Corporation
http://www.hindawi.com Volume 2014
Disease Markers
Hindawi Publishing Corporation
http://www.hindawi.com Volume 2014
BioMed
Research International
Oncology
Journal ofHindawi Publishing Corporation
http://www.hindawi.com Volume 2014
Hindawi Publishing Corporation
http://www.hindawi.com Volume 2014 Oxidative Medicine and Cellular Longevity Hindawi Publishing Corporation
http://www.hindawi.com Volume 2014
PPAR Research
The Scientific
World Journal
Hindawi Publishing Corporation
http://www.hindawi.com Volume 2014
Immunology Research
Hindawi Publishing Corporation
http://www.hindawi.com Volume 2014
Journal of
Obesity
Journal ofHindawi Publishing Corporation
http://www.hindawi.com Volume 2014
Hindawi Publishing Corporation
http://www.hindawi.com Volume 2014 Computational and Mathematical Methods in Medicine
Ophthalmology
Journal ofHindawi Publishing Corporation
http://www.hindawi.com Volume 2014
Diabetes Research
Journal ofHindawi Publishing Corporation
http://www.hindawi.com Volume 2014
Hindawi Publishing Corporation
http://www.hindawi.com Volume 2014
Research and Treatment
AIDS
Hindawi Publishing Corporation
http://www.hindawi.com Volume 2014 Gastroenterology Research and Practice
Hindawi Publishing Corporation
http://www.hindawi.com Volume 2014
![Table 2: Physical measurements of bronchial paths [12].](https://thumb-eu.123doks.com/thumbv2/123doknet/6930880.195724/2.900.463.824.451.797/table-physical-measurements-of-bronchial-paths.webp)

![Table 3: AUC of airway pressure drops for Sundaresan’s patients [18], with PEEP = 5, 10, and 15 cmH 2 O for general ABM, ABM specific, and DSA](https://thumb-eu.123doks.com/thumbv2/123doknet/6930880.195724/8.900.75.825.143.846/table-airway-pressure-drops-sundaresan-patients-general-specific.webp)
