Slip rate and mode of the Feldbiss normal fault (Roer Valley Graben)
after removal of groundwater effects
A. Demoulin
⁎
Research Associate of the Belgian NFSR, Dept of Physical Geography and Quaternary, University of Liège, Belgium Received 5 July 2005; received in revised form 20 January 2006; accepted 20 March 2006
Available online 2 May 2006 Editor: V. Courtillot
Abstract
The Feldbiss fault is the main active fault bounding to the southwest the Roer Valley Graben of NW Europe. In order to investigate the reasons of the discrepancy between its short- and long-term slip rate estimates, we have repeatedly surveyed a 2.3 km-long line by levelling at Sittard (The Netherlands) from April 2001 to December 2004. Simultaneously, three superposed aquifers were monitored on both sides of the fault. The across-fault differential groundwater variations are shown to be responsible for a seasonal 0.87 mm/m vertical motion of the fault, mainly through the effect of pore pressure changes in confined aquifers. After removal of this effect, I get a residual trend of−0.60±0.11 mm/yr for the relative motion of the hangingwall. This trend was disturbed in the summer of 2002 by transient millimetre-level up and down motions temporally associated with the small Eschweiler earthquake that occurred on July 22, 2002 on the Feldbiss fault at a distance of 35 km from Sittard. I explain this as a creep event triggered by the passage of trapped seismic waves. The subsisting discrepancy between the long-term slip rate of 0.06 mm/yr and short-term rates of∼ 1.5 mm/yr (from 1962 to 2001) and 0.6 mm/yr (from 2001 to 2004) is tentatively interpreted as resulting from the current occurrence of a decade-long episode of aseismic slip involving a large part of the fault plane. Occasionally associated with minor seismicity, this aseismic slip event could betray a thickening of the transitional region located below the upper crustal zone of stable sliding. It causes a total fault slip of 5–10 cm in a few tens of years, releasing smoothly all, or a great part of, the strain accumulated during the previous 1–2 ky of fault quiescence.
© 2006 Elsevier B.V. All rights reserved.
Keywords: Roer Valley Graben; Feldbiss fault; fault slip rate; fault creep; aseismic slip; precise levelling
1. Introduction
The Roer Valley Graben (RVG) is a region of moderate seismicity[1], struck by the Roermond, 1992, earthquake of ML∼ 5.9. It has also been shown that the
Feldbiss fault is one of the main seismogenic sources in
the area, with Late Quaternary paleoearthquakes of estimated Mw6.0–6.5[2], calling for detailed studies of
the present-day behaviour of the fault in order to support the regional earthquake hazard assessment.
Extending across densely populated areas of W Germany, the Netherlands and NE Belgium, the RVG is continuously subsiding since the Late Oligocene[3]and is still currently the most active tectonic unit within the Lower Rhine segment of the European Cenozoic Rift
⁎ Fax: +32 4 3665722.
E-mail address:ademoulin@ulg.ac.be.
0012-821X/$ - see front matter © 2006 Elsevier B.V. All rights reserved. doi:10.1016/j.epsl.2006.03.030
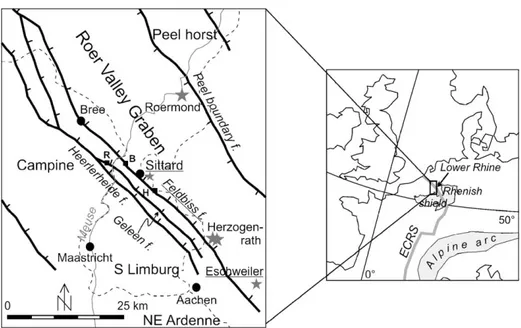
System (ECRS). It is limited to the northeast by the Rurrand–Peel Boundary fault zone and to the southwest by the NNW- to NW-striking Feldbiss fault zone. To the south of the latter, the southern shoulder of the graben is comprised, from SE to NW, of the uplifting Paleozoic NE Ardenne massif, the S Limburg block and the Campine Plateau (Fig. 1).
The incision of the Meuse valley in the uplifted shoulder, including the footwall of the Feldbiss fault, and the development of a flight of fluvial terraces provide ample evidence of the Quaternary activity of the fault zone [4,5]. Displacement rate estimates for various segments of the Feldbiss fault system during varying periods of the Middle and Late Quaternary do not exceed 0.05–0.06 mm/yr [4–7]. A similar rate of 0.07 mm/yr has been deduced for the last 45 ky from paleoseismo-logical investigations of the Bree segment of the fault in Belgium[8]. However, Van den Berg [5]suggests that this rate had strongly decreased during the last 200 ky.
By contrast, precise levelling surveys of the Dutch first order network repeated over more than 50 yrs yield a displacement rate of∼ 1.5 mm/yr for the Feldbiss fault
[9]. The discrepancy between low paleoseismological and one order of magnitude higher geodetic rates has been suggested to indicate that only a limited amount of the total strain is released seismically[8]. But, even in this case, the inconsistency remains between the present-day and Quaternary slip rates.
One possible explanation of the problem could lie in that the geodetic rate estimates, in particular for the very low rates of intraplate normal faults, are often biased by groundwater-dependent vertical movements of the ground[10]. Relying on almost four years of repeated precise levelling surveys across the Feldbiss fault at Sittard (Fig. 1), the aim of this article is therefore (1) to identify, to model and to remove every groundwater effect on surface vertical displacements in order (2) to isolate the possible tectonic component of motion and to determine the true present-day slip rate and mode of the fault.
2. Geological setting of the study area
Belonging to the Lower Rhine segment of the ECRS, the NNW- to NW-trending Roer Valley Graben is inherited from a Carboniferous foreland basin reacti-vated in various ways during several periods of the Mesozoic and the Cenozoic. After a last inversion phase during the Late Eocene-Early Oligocene[7], it has been continuously subsiding since the Late Oligocene. In its southeastern part, the RVG is almost symmetric, with ∼ 1000–1500 m-thick Cenozoic and ∼ 2500 m-thick Mesozoic sediments overlying the Paleozoic basement
[11].
The normal fault systems bounding the RVG, in parti-cular the Feldbiss fault zone (FFZ) to the southwest, are
Fig. 1. Sketch map of the Roer Valley Graben showing the location of the surveyed line across the Sittard segment of the Feldbiss fault. The Sittard segment extends from Born (B) to Hillensberg (H). (R) Rotem. The stars locate the earthquakes mentioned in the text. (ECRS) European Cenozoic Rift System.
reactivated structures of Variscan or even Caledonian age
[12]that seismic reflection profiles trace down into the Paleozoic basement at more than 4 km depth[13]. In the Sittard area, the∼ 100 km-long FFZ is mainly comprised, from NE to SW, of the parallel Feldbiss, Geleen and Heerlerheide faults, probably originating from a single crustal fault [2] (Fig. 1). As expected from the fault orientation with respect to the present-day regional stress field (SHmax direction = N145°E ± 26°[14]) earthquake
focal mechanisms and displaced morphological markers bear witness to exclusive normal faulting mode since at least the Upper Pleistocene[7,8].
The FFZ may be divided along strike in segments of 10–20 km length[8]. Here I concentrate on a segment of the Feldbiss fault itself. The NW-striking, 10–12 km-long Sittard segment is characterized by a marked mor-phological scarp whose height progressively decreases from 20 to 30 m east of Sittard to 8–10 m between Sittard and Born (Fig. 1). To the NW, the segment ends at Born where most of the recent deformation and its morpho-logical expression are taken over by the Geleen fault[7]. To the SE, the segment's limit, situated SE of Hillens-berg, corresponds to the junction with the first NE main fault and a∼ 20° change in fault strike. South of Sittard, the Heerlerheide fault is assumed to accommodate less than 10% of the recent displacement across the FFZ[15]. In this area, the 0.050–0.062 mm/yr displacement rate derived for the entire fault system from deformed ter-races of the Meuse river is mainly distributed over the Feldbiss and Geleen faults, with a Feldbiss/Geleen ratio decreasing towards NW from∼ 85/15 in the place we surveyed west of Sittard to 50/50 at Born[7].
Beyond the Uden, 1932, (ML∼ 5.0) and Roermond,
1992 (ML= 5.9) earthquakes caused by normal faulting of
the Peel Boundary fault[16], the seismicity map of the Lower Rhine graben reports 8 earthquakes of ML3.0–4.0
which occurred on the Feldbiss fault during the period 1910–1995, one of them being located in the vicinity of Sittard[8]. Recently, the ML∼ 5.1 Eschweiler earthquake
of July 22, 2002 took place on the fault 35 km to the SE of Sittard. The two strong earthquakes at Herzogenrath in 1873 and 1877 with estimated Modified Mercalli inten-sities of VII/VIII [17] probably occurred also on the Feldbiss fault. Most of the significant earthquakes within the Roer Valley Graben seem to occur at crustal depths between 10 and 17 km.
Until recently, the Quaternary activity of the FFZ was not explicitly associated with the occurrence of major earthquakes causing surface faulting. Camelbeeck and Meghraoui [18] were the first to show that the FFZ experienced several such prehistoric surface-rupturing seismic events. Six (probably) coseismic surface rupture
events testifying to normal faulting have been identified along the Bree segment of the fault, west of the Meuse valley[19]. Five of them would be younger than 137 ± 18 ky, the youngest dating back to 1000–1350 calBP. The largest observed fault slip suggests a moment magnitude higher than 6.0. Unlike the Bree segment, the next segment of Sittard seems not to have preserved any trace of paleoearthquake [20]. Instead, Houtgast et al.
[21]believe that liquefaction structures observed close to the nearby Geleen fault could indicate strong seismic shaking of the fault in the period 10–15 ky. On the same fault at Rotem, Vanneste et al.[22]described a 0.75 m vertical displacement of the 14 ky-old gravels of the Maasmechelen terrace of the Meuse (Fig. 1).
Summarizing, the available geological and paleo-seismological observations consistently agree with Late Quaternary slip rates of 0.05–0.06 mm/yr for the FFZ, but are still too few to determine the amount of strain released seismically by each segment, and in particular by the Sittard segment of the fault.
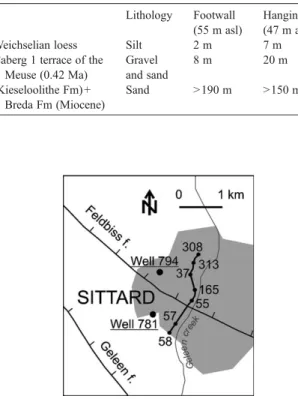
The lithological logs of the wells located close to our leveling line (Fig. 2), on the footwall and the hanging-wall of the Feldbiss fault, indicate the following thick-nesses for the successive formations (P. Jellema, written comm.):
Lithology Footwall (55 m asl)
Hangingwall (47 m asl)
Weichselian loess Silt 2 m 7 m
Caberg 1 terrace of the Meuse (0.42 Ma) Gravel and sand 8 m 20 m (Kieseloolithe Fm) + Breda Fm (Miocene) Sand N190 m N150 m
Fig. 2. Close-up of the study area. The levelled line is in bold, with the benchmark numbers of the Dutch network. The monitored wells are located very close to the ends of the section crossing the Feldbiss fault. The well 781 is disabled since April 2004.
In the footwall, two 10 m-thick lignite layers are encountered at 107–116 m and 141–151 m depth. In the hangingwall, 20 m peat are present between 72 and 94 m depth.
3. Data acquisition 3.1. Levelling data
We have repeatedly surveyed a 2.3 km-long levelling line made of six sections of the Dutch levelling network (Fig. 2). This line runs along the imperceptibly sloping western valleyside of the Geleen creek and the 0.7 km-long section between benchmarks 57 and 55 crosses the Feldbiss fault scarplet in a place where it is 5 m-high and 1.25%-steep. All surveyed benchmarks are anchored in the brick walls of N30 yr-old, stabilized buildings. I hereafter discuss mainly the motions recorded by the section 57–55. The measurements, in total 28 surveys, cover the period from April 17, 2001 to December 14, 2004 with a mean inter-survey time interval of seven weeks.
The same equipment, a LEICA NA-3000 numerical level and 3 m-long code-bar invar rods, has been used over the whole period. The sections have been double run according to the recommendations of the International
Association of Geodesy for high precision levelling. The field toleranceβ was of 0.6 mm/km. In addition, all setup points (of rods and level) were marked by nails into the ground so that the same rod came each time on the same points throughout all surveys. Moreover, owing to this procedure, at the end of the back run of a section, we could compare the fore and back readings for every internail distance (50 m), a discrepancy in excess of 0.2 mm compelling the remeasurement of the concerned internail distance. The data have been corrected for the thermal expansion of the rods. Owing to the almost non-existent terrain slope, all readings were taken between 1.2 and 2 m above the ground and unequal atmospheric refraction errors are assumed to be negligible. The standard errorsα1
of the surveys, based on the section misclosures, lie in the range 0.09–0.25 mm/√km, with a mean of 0.18 mm/√km. I also calculate an errorα1of 0.15 mm for the single
section 57–55 over the whole period of the study. This yields a 95% uncertainty of 0.43 mm on the measured height change variations of this section.
3.2. Groundwater data
Two wells of the Nederlands Instituut voor Toegepaste Geowetenschappen (TNO-NITG) are providentially lo-cated very close to the two ends of the principal section of
Fig. 3. Time series of the raw relative vertical displacement of the hangingwall with respect to the footwall of the Feldbiss fault. The motion is recorded between the two ends of the whole levelling line (A) and of the section crossing the fault (B). Vertical bars indicate the 2σ error (i.e. 2 (α211+α212)1/2L1/2, withα11andα12being the standard error at epochs 1 and 2, and L the section length) on every inter-survey displacement.
the levelled line (Fig. 2). Since September 1983, they record the water table or pressure head variations of super-posed aquifers, respectively two on the footwall and three on the hangingwall of the Feldbiss fault. The lowest, con-fined, aquifer is of regional extent. The readings were taken twice a month until the end of 2003. Since January 2004, daily readings (corrected for a jump induced by an equip-ment change) are available for the well 794 (hangingwall) but, unfortunately, the well 781 (footwall) has been defin-itively abandoned in April 2004. This is important because considering differential vertical ground motionΔDH be-tween both sides of the fault requires to take into account groundwater level variations in differential mode (ΔDGW) too and we thus discuss below the possibility of using only the data of well 794 to construct an efficient proxy of DGW.
The reading error being 0.01 m, the highest error component on groundwater data comes from the required interpolation between fortnightly values. The analysis of the daily data of 2004 shows that the uncertainty in-corporated in a linear interpolation results in an error on the groundwater variable DGW2 most generally lower than 0.2 m, i.e. less than 5% of the range of observed DGW2 values. Moreover, the error on one value is independent of those on the previous values and this error component do not affect the data of 2004, so that the only uncontrolled consequence should be a very limited uncertainty on the regression coefficient ofΔDH against ΔDGW.
4. Results: causes of ground motion
The time series ofFig. 3displays the results of our measurements as temporal variations of the height dif-ference between the two ends respectively of the whole levelling line (Fig. 3A) and the section 57–55 crossing
the fault (Fig. 3B). Considering especially the latter, we observe several inter-survey motions of up to 3 mm, largely exceeding the measurement uncertainty.
Some part of these motions could a priori be caused by the instability of the buildings supporting the benchmarks. Considering that the error linked to monument instability is not time-correlated, Savage and Lisowski [23] have introduced a fixed error term reflecting the chaotic be-haviour of the benchmarks and ranging from 0.25 to 1.00 mm depending on the monument type. However, Sylvester[24]pointed out that the fluctuating motions of benchmarks anchored in the weathered bedrock of the Piñon Flat Observatory of Southern California consider-ably decreased 3 yrs after their setting. At Sittard, all geodetic supports are well-founded houses more than 30 yrs old, which are generally recognized as the monu-ments least susceptible to instability[25]. Field verifica-tion confirmed that their behaviour can in no way account for the observed displacements. Moreover, if we consider sets of benchmarks installed respectively on the footwall and the hangingwall of the fault, they display a remark-able internal relative stability of their marks, which de-finitely rules out significant individual motions of the latter. On the footwall, the mean variation of height change between benchmarks 58 and 57 is−0.02 mm, with a standard deviation of 0.35 mm. On the hangingwall, the mean variation of height changes between benchmarks 55, 165 and 37 is−0.003 mm, with a standard deviation of 0.36 mm. These deviations include both the measurement and monument instability errors, showing that every observed motion higher than 0.7 mm between two bench-marks pertaining to these sets (e.g., BM 57 and 55) and any two epochs may be considered a true ground motion at the 95% confidence level.
After 3.67 yrs of measurement and despite frequent up and down displacements at the millimetre level, the raw resultant fault displacement displayed by the section 57–55 corresponds to a bare 2 mm relative subsidence of the hangingwall. The striking similarity in form and amplitude between the curves of the whole levelling line and that of the section 57–55 shows that the greatest part
Fig. 4. Height change variation profile along the whole levelling line displaying the resultant motion of the individual benchmarks after 3.67 yrs monitoring (April 2001–December 2004). The topography is shown in grey.
of the displacement takes place on the fault itself. This is confirmed by the profile of the levelling line displaying the resultant motion of the individual benchmarks in December 2004 (Fig. 4).
When more than two measurement epochs are available, the inferred tectonic motion rate is generally taken simply as the best linear fit to the data. However, relying on the long-term (geological) estimates, we expect that the slip rate of the intraplate Feldbiss fault be about one order of magnitude lower than the noise of near-surface origin. The main components of the latter there-fore have to be removed first. That this noise is also concentrated across the fault is demonstrated by the 1.13 mm standard deviation of the height change vari-ations of section 57–55, 3 times higher than that of the other sections, despite the proven individual stability of BM 57 and 55. At the local differential scale, the principal noise source has been shown to be the variations of the groundwater level[10,26–28].
Beyond swelling and shrinking of clay minerals, not involved in this case, soil- and groundwater variations have two opposed effects on vertical displacements of the ground, namely through loading and pore pressure
changes. As changes in water table imply both effects but variations in pressure head of the confined aquifers induce only pore pressure changes, I define two inpendent variables DGW1 and DGW2 respectively de-scribing the across-fault gradients in water table level and in the sum of the confined aquifer pressure heads. In a first step, the multiple regression of the height variations on these variables involved the period for which direct well data were available on both sides of the fault, i.e. from April 2001 to December 2003. After removal of three outliers occurring in the three-month-period after the Eschweiler, 2002, earthquake, no (partial) correlation was found between the water table variationsΔDGW1 and the ground vertical motion. This is due to minor water table variations combined with the antagonism between their loading and pore pressure effects. On the contrary, the ground displacements ΔDH are strongly linked to ΔDGW2 (correlation coefficient r=0.82, n=17), which explains 2/3 of their variance. A 1 m change in DGW2 has been calculated to induce a 1.23 mm height change variation of the section across the fault.
In an attempt to estimate the groundwater variation influence on surface displacements beyond December
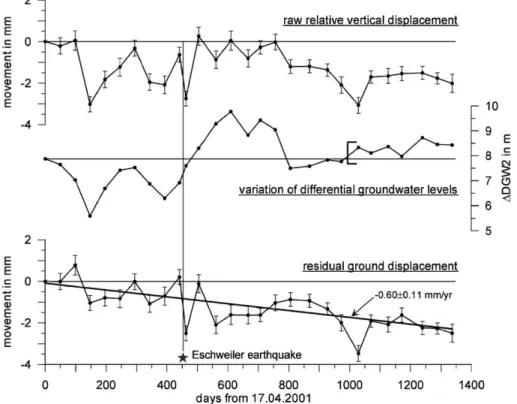
Fig. 5. Height change variations between the two ends of section 2, crossing the fault, and associated groundwater variations. Top. Temporal evolution of the raw vertical displacement of the hangingwall with respect to the footwall. Vertical bars indicate the 2σ error on each value with respect to the first measurement. Middle. Variations of the across-fault gradient in groundwater levels. The bracket shows the time from which the DGW2 values are derived from readings of the only well 794. Bottom. Residual motion with 2σ error bars after removal of the groundwater effect. The residuals display a clear trend of−0.60±0.11 mm/yr. The Eschweiler earthquake occurred on day 461 (July 22, 2002) and the next survey was carried out on day 462.
2003, after the well 781 had ceased to be monitored and DGW2 could no longer be computed, I observed for the period 1998–2003 an almost perfect relationship be-tween DGW2 and the pressure head data of the two confined aquifers monitored in the well 794 (multiple r = 0.99). Therefore, I determined DGW2 from this relation for the year 2004. Note that a trial to define proxies for DGW2 based on various linear or exponen-tial rainfall functions was unsuccessful, probably be-cause of too delayed and attenuated a rainfall influence and groundwater exploitation. Using the entire data set (04/2001–12/2004), the correlation between ΔDGW2 and the vertical displacements recorded across the fault was then confirmed (r = 0.74, n = 21 after removal of 6 outliers N 2σ, three of them being earthquake-related and two others resulting from an anomalous measure-ment in February 2004—Fig. 5, day 1029). Over the 04/ 2001–12/2004 period, ΔDGW2 explains 55% of the variance of ΔDH, a 1 m variation in DGW2 causing 0.87 mm change in DH (Fig. 6).
Removing the influence of the groundwater variations on ΔDH, the time series 2001–2004 of the residuals leaves a resultant displacement of−2.5 mm after 3.67 yrs and displays a significant trend (r =−0.74, n=27) in-dicating that the hangingwall is currently subsiding re-latively to the footwall at a rate of−0.60±0.11 mm/yr (Fig. 5). Cleared of every groundwater influence, the RMS of the residuals of this linear fit amounts now to 0.47 mm (to be compared with the previous 1.13 mm). If
one takes into account the greater length of the section 57–55 and the subsequent slight increase in measurement error, this is very similar to the 0.35–0.36 mm calculated for the other sections. Furthermore, if I weigh the regres-sion ofΔDH on ΔDGW2 and that of cleaned ΔDH on time by 1 / (e12+ e22), where e1and e2are the section
mis-closures of the two measurements definingΔDH, I get a still more significant (r =−0.85), similar subsidence rate of−0.68±0.02 mm/yr. Taking advantage of the stability of the sections extending respectively on the footwall and the hangingwall of the fault, one may also treat the ground-water influence and the remaining trend of ground mo-tion between groups of benchmarks on either side of the fault. In this way, the subsidence rate of benchmarks 55-165-37 (resp. 55-55-165-37-308-313) with respect to bench-marks 57–58 becomes −0.66±0.13 mm/yr (resp. − 0.56± 0.13 mm/yr). These quite consistent estimates not only strengthen the inferred rate, but also emphasize that the whole displacement recorded along the 2.3 km-long lev-elling line takes place on the fault itself.
This continuous slip was transiently disturbed by a jump in the middle of the time series associated with the Eschweiler earthquake. Considered separately, the trend of the pre-earthquake period is not statistically signif-icant, due to the limited number of data (n = 10). How-ever, the post-earthquake period shows a significant trend of −0.39±0.17 mm/yr (r=−0.54, n=15 after removal of the outlier of February 2004), to which the pre-earthquake trend is very similar. The jump is
Fig. 6. Correlation between the inter-survey height change variations of section 57–55 recorded from 2001 to 2004 and the associated changes in the variable DGW2, i.e. the across-fault gradient in the sum of the pressure heads of the confined aquifers. Six outliersN 2σ (see text) have been removed from the correlation.
characterized by up and down vertical ground motions in the three months following the quake, resulting in a ∼ 2.3 mm motion of the fault. However, enlarging to one year the possible period of fault adjustment after the seismic event strongly reduces this value and makes it very difficult to determine whether continuous slip or the short-term response to the earthquake prevails in the observed trend.
5. Discussion
5.1. Nature of the groundwater influence on ground displacement
The exclusive influence of the confined aquifers on the observed ground displacements and the sense of motion, a relative pressure head lowering in the hangingwall in-ducing its subsidence with respect to the footwall, point to a pore pressure effect predominant over the loading effect in the particular conditions of the Sittard area. This is consistent with observations of ground deformation due to underground reservoir exploitation [29,30] and high seasonal variations of groundwater level observed
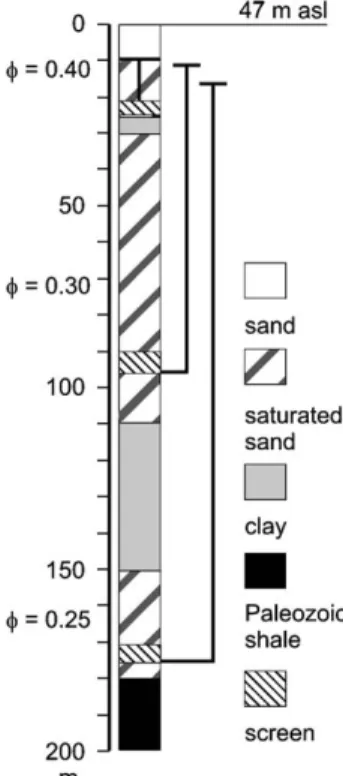
else-where[31], but in contrasts with the main role generally attributed to loading when dealing with GPS data[32,33]. A very simple modelling of the effect of pressure head variations of the confined aquifers at well 794 yields also results similar to those deduced from the relation be-tween the observedΔDGW2 and ΔDH (Fig. 7). With a typical constant of compressibility C = 300 for the sands over the whole depth of the well, the assumed porosity of the superposed sandy aquifers decreasing from 0.4 at the surface to 0.25 at 200 m depth and the observed ratio of 2.2:1 for the variation amplitude of the lower aquifer with respect to that of the higher aquifer, I get a vertical ground displacement of 0.89 mm for a 1 m change in summed pressure heads.
The reason for the predominance of the pore pressure effect lies chiefly in the very local scale of the differential displacements measured. Due to the flexural rigidity of the crust, a local gradient in loading cannot be manifested as such at the ground surface. Even if we assume that the fault is totally unlocked in the few shallow hundreds of metres, only a small part of the loading effect of the water table variations may be expressed differentially, which is about compensated by the pore pressure effect of this same aquifer. On the contrary, the fault acts as an efficient hydraulic barrier[34]so that the across-fault gradient of the pore pressure of the confined aquifers may be sharp. Moreover, this gradient will be entirely translated into the differential ground motion as its effect concerns primarily shallow host rocks.
5.2. Remote influence of a small earthquake
A small earthquake (ML= 5.1 ± 0.3) occurred in the
Roer graben on July 22, 2002. It was located near Eschweiler (N50°52.3′, E06°12.3′, ±0.8 km) at a depth of ∼ 13.5±0.6 km [35] and probably ruptured the Feldbiss fault at a distance of 35 km from Sittard. Three aftershocks with MLN2.4 are mentioned in the
Eschweiler area during the three following days. After removal of the groundwater effect, the survey of July 23 showed a hangingwall relative subsidence of 2.7 mm, i.e. the highest motion recorded in the period 2001– 2004 (Fig. 5). This displacement is confirmed by at least two benchmarks on the hangingwall. The previous measurement predated the earthquake only by 19.8 days, so that I consider this motion as most probably coseismic. During the following three months, significant up and down movements were still observed across the fault (successively + 2.4 and−2.0 mm for the hangingwall, to be compared with a 3σ uncertainty on the measured displacement of 0.6–0.8 mm). No jump in groundwater level was recorded in Sittard at the time of the
Fig. 7. Lithological and groundwater log used to model the effect of groundwater variations on the vertical displacement of the ground surface. It corresponds to an average log of the hangingwall of the Feldbiss fault near Sittard, indicating the location of the screens in well 794 and the corresponding mean water table and pressure heads.ϕ = porosity.
earthquake, but an unusual summer increase in DGW2 followed the event (Fig. 5). Owing to the negligible static stress change induced by the earthquake at Sittard, I interpret the coseismic displacement of the Feldbiss fault as a creep event dynamically triggered by the passage of trapped seismic waves[36–38]. This might have resulted in small changes in the hydraulic conductivity across the fault at shallow depth, inducing the observed later increase in DGW2, and in a subsequent transient instability causing oscillatory motions.
5.3. Temporal variations in fault slip rate as measured at the ground surface
The main point is however the subsisting discrepancy between fault slip rates estimated over different time scales. On one hand, the geodetically inferred rate of 0.6 mm/yr, which spans a period of∼ 4 yrs, is still one order of magnitude higher than the geological rate. On the other hand, as groundwater data are available since 1983 at Sittard, I have corrected for this effect the section height change measured in November 1985 by the Dutch Rijkswaterstaat across the Feldbiss fault. This leaves a relative subsidence of the hangingwall of 21.2 mm between 1985 and 2001, thus at a mean rate of 1.38 mm/yr which compares well with the (uncorrected) 1.63 mm/yr obtained for the period 1962–1985 (Fig. 8). Our observations are too spatially limited to know with certainty whether the surface motion observed at Sittard reflects fault deformation at the crustal level and affects the entire length of the segment. However, the following line of argument suggests it. Firstly, the most influential near-surface causes of ground motion (monument in-stability and groundwater level variations) have been ruled out or their effect removed, therefore strengthening the hypothesis of a true tectonic fault slip. Now, assuming a fault locked at depth, it seems that aseismic deformation
of the uppermost crust could not account for a near-surface slip rate largely exceeding that of secular creep, especially since locked and unlocked areas are distributed perpendicularly to the slip direction of a normal fault. This leads to include a larger part of the fault depth within the ongoing process. Moreover, if the geological (Late Quaternary) displacement rate of∼ 0.05 mm/yr is taken to represent the tectonically driven secular rate of strain accumulation, the comparatively high current slip rate indicates that a significant amount of strain had been accumulated previously, which is more unlikely to occur under low normal stresses in the uppermost crustal level. Assuming that the presently recorded ground displace-ment of 62 mm fairly reflects the slip amount on a fault plane area of∼ 11×10 km2(consistent with the Hanks' scaling relation[39]), I compute an equivalent moment magnitude Mw= 5.5. However, this does not preclude that
such a high slip rate might still maintain for many years, thus corresponding to a higher moment release.
Moreover, one might also speculate upon the local microseismicity, notably one earthquake that occurred close to Sittard in 1982, as being part of the process, implying that the latter involves the first ten kilometres of the fault plane at least locally. In this line of thought, the difference between the fault rates deduced from levelling surveys for the periods 1962–2001 and 2001– 2004 could be explained in two ways. Firstly, one might argue that the fault is moving episodically and that the period 2001–2004 was too short to catch any episode of enhanced displacement. Indeed, one such event could have occurred in 1982 when a small (ML= 3.7)
earth-quake struck the Sittard area on March 2. Although no reliable focal mechanism is available, the hypocentre location given by Camelbeeck [40] suggests that this quake took place at a depth of∼ 10 km on the Feldbiss fault 2 km east of Sittard. Therefore, its (indirect) effect on ground motion in this place was certainly higher than that of the Eschweiler earthquake of 2002. However, it may be difficult to ascribe the entire 38.8 mm dis-placement recorded between 1962 and 1985 to this unique small tremor. With an approximate Mw= 3.5 and
according to the relation derived by Hanks between Mo
and the source radius of small earthquakes, the Sittard earthquake of 1982 should have caused a∼ 10 mm slip on a∼ 0.8 km2rupture area. This small slip at depth, amounting to one sixth of that geodetically recorded at the ground surface between 1962 and 2004, might rather be seen as the subordinate seismic component of a mainly aseismic process of strain release on a large portion of the fault segment. I propose as a working hypothesis that such a process was responsible for the period of increased slip rate of the Sittard segment of the
Fig. 8. Evolution of the vertical offset measured by successive levelling surveys across the Feldbiss fault at Sittard from January 1962 to December 2004. The occurrence of the small Sittard earthquake on March 1982 probably caused a part of the 1962–1985 displacement.
Feldbiss fault in the years between 1962 and 2001. Recently, this rate decreased to its present-day level of 0.6 mm/yr. This process should be distinguished from secular fault creep since it proceeds at a rate 10–25 times higher than the mean late Quaternary slip rate deduced there from deformed fluvial terraces, and could involve slip at greater depths. Therefore, I am led to define it as a particular mode of aseismic slip extending over several decades of increased creep rate (and/or more frequent creep events), intermediate between silent earthquakes and secular creep.
The reasoning above settles the dilemma of large accumulation of strain in the shallow crust versus large aseismic strain release in a region of the seismogenic crust in favour of the latter term. However, the cause for extended and long-lasting aseismic slip occurring in-stead of an ordinary earthquake remains unknown. Al-though the properties of fault zone materials at Sittard are not known to be different from along seismogenic segments of the fault, the particular behaviour of this segment could perhaps betray a significant thickening of the transitional region located below the upper zone of stable (and conditionally stable) sliding. Appearing in the models using a two-state-variable frictional law[41], the transitional region is defined as that where the stiffness K of the system is only marginally lower than the critical stiffness Kc (∼ 0.9bK/Kcb1), inducing
episodic fault creep[38]. In the present case, the observed surface motion rate, persistently higher than the secular rate, suggests that aseismic slip should be related to the occurrence of an“extremely slow” earthquake rather than episodic creep events. If so, this would be the first event of this type reported on a normal fault. Indeed, all previous accounts of slow earthquakes were concerned either with subduction zones [42–46] or strike-slip environments
[47]. However, a notable difference would lie in the duration of the phenomenon, lasting here decades instead of months in the other cases.
Comparing the currently recorded displacement with the geological slip rate, the minimum return period of such an aseismic slip episode on the Sittard segment is ∼ 1030 yrs. The estimated return period for earthquakes with Mw≥5.5 is ∼ 211 yrs [48] in the Roer Valley
Graben, where the total length of active faults amounts a rough 400 km with mostly ∼ 10 km-long segments. If we assume that all segments show approximately the same level of seismic activity, the recurrence time of such an earthquake on the Sittard segment should be ∼ 8.4 ky. This suggests that, in agreement with the earlier findings[8,20], about 85% of the strain release is realized through either secular fault creep or aseismic slip episodes with associated minor seismicity.
With regard to the regional seismic hazard, one cannot determine whether the recent decrease in slip rate is on the way back to slower,‘geological’ rates or even quiescence due to completion of the strain release or, on the contrary, indicates that aseismic fault slip occurs with more difficulty because it comes nearer to a zone of stick–slip behaviour, subsequently increasing the load on that area. In the first case, a slip event would occur in an advanced stage or at the end of a loading cycle, possibly releasing the total strain of the segment. But, in the other case, one should interpret it as a preseismic feature possibly forecasting a moderate earth-quake which would rupture the bottom part of the seis-mogenic crust. Anyway, since no significant earthquake struck recently the Sittard area, I disagree with Houtgast et al.[21]who argued for postseismic relaxation creep in the similar case of high creep rate on the Peel Boundary fault, on the other side of the Roer Valley Graben.
6. Conclusion
The analysis of a 3.7 yr-long time series (comprising 28 epochs) of the ground vertical displacement across the Feldbiss fault as measured by levelling at Sittard has shown that the influence of groundwater variations on the ground motion, mainly through the effect of pore pressure changes, cannot be neglected. After removal of this in-fluence, the residual trend evidences a relative downward motion of the hangingwall at a rate of 0.6 mm/yr. Transient millimetre-scale up and down motions have been observed in close temporal association with a small earthquake occurred on the Feldbiss fault in July 2002 at a distance of 35 km from the levelled line and I suggest a cause-to-effect relation possibly due to the passage of trapped seismic waves. The persistent inconsistency be-tween reliable fault slip rates derived over various time scales has led me to propose a particular mode of strain release by year-long aseismic slip. Possibly associated with minor seismicity, these decadal episodes of increased fault creep would cause the fault to slip 5–10 cm. They could be named“ultra-silent earthquakes” since they re-lease, smoothly, the strain accumulated during a few thousands of years of fault quiescence.
Acknowledgments
I gratefully acknowledge the help of G.B. Brand from AGI (Adviesdienst Geo-informatie en ICT, Rijkswater-staat, Delft) and P.K. Jellema from DINO/TNO (Data en Informatie van de Nederlandse Ondergrond/ Environ-ment en Geosciences) offices, who respectively provided kindly the Dutch historical levelling data and the groundwater data. The time-expensive surveys were
carried out with the efficient assistance of J.L. Génicot and D. Smets. I also thank sincerely the two anonymous reviewers whose thoughtful and constructive comments contributed to improve greatly the original manuscript.
References
[1] L. Ahorner, Historical seismicity and present-day microearth-quake activity of the Rhenish massif, Central Europe, in: K. Fuch, sK. von Gehlen, H. Mälzer, H. Murawski, A. Semmel (Eds.), Plateau uplift, The Rhenish shield, a case history, Springer, Berlin, 1983, pp. 198–221.
[2] T. Camelbeeck, M. Meghraoui, Geological and geophysical evidence for large palaeoearthquakes with surface faulting in the Roer graben (northwestern Europe), Geophys. J. Int. 132 (1998) 347–362.
[3] C. Prodehl, S. Mueller, V. Haak, The European Cenozoic rift system, in: K. Olsen (Ed.), In Continental rifts: evolution, structure, tectonics, Developments in Geotectonics, vol. 25, Elsevier, Amsterdam, 1995, pp. 133–212.
[4] L. Ahorner, Untersuchungen zur quartären Bruchtektonik der Niederrheinischen Bucht, Eiszeitalt. Ggw. 13 (1962) 24–105. [5] M. Van den Berg, Neotectonics of the Roer Valley rift system:
style and rate of crustal deformation inferred from syntectonic sedimentation, Geol. Mijnb. 73 (1994) 143–156.
[6] R. Houtgast, R. van Balen, Neotectonics of the Roer Valley rift system, the Netherlands, Glob. Planet. Change 27 (2000) 131–146. [7] L. Michon, R. van Balen, Characterization and quantification of active faulting in the Roer valley rift system based on high precision digital elevation models, Quat. Sci. Rev. 24 (2005) 457–474. [8] M. Meghraoui, T. Camelbeeck, K. Vanneste, M. Brondeel, D.
Jongmans, Active faulting and paleoseismology along the Bree fault, lower Rhine graben, Belgium, J. Geophys. Res. 105/B (2000) 13809–13841.
[9] M. Van den Berg, W. Groenewoud, G. Lorenz, P. Lubbers, D. Brus, S. Kroonenberg, Patterns and velocities of recent crustal movements in the Dutch part of the Roer Valley rift system, Geol. Mijnb. 73 (1994) 157–168.
[10] A. Demoulin, Reconciling geodetic and geological rates of vertical crustal motion in intraplate regions, Earth Planet. Sci. Lett. 221 (2004) 91–101.
[11] TNO-NITG, 1999, Toelichting bij kaartblad XV Sittard-Maas-tricht, Nederlands Instituut voor Toegepaste Geowetenschappen, Utrecht, 127 p.
[12] J. Dirkzwager, J. Van Wees, S. Cloetingh, M. Geluk, B. Dost, F. Beekman, Geo-mechanical and rheological modelling of upper crustal faults and their near-surface expression in the Nether-lands, Glob. Planet. Change 27 (2000) 67–88.
[13] M. Geluk, E. Duin, M. Dusar, R. Rijkers, M. Van den Berg, P. Van Rooijen, Stratigraphy and tectonics of the Roer Valley Graben, Geol. Mijnb. 73 (1994) 129–141.
[14] B. Müller, M.L. Zoback, K. Fuchs, L. Mastin, S. Gregersen, N. Pavoni, O. Stephansson, C. Ljunggren, Regional patterns of tectonic stress in Europe, J. Geophys. Res. 97 (1992) 11783–11803. [15] R. Houtgast, R. van Balen, L. Bouwer, G. Brand, J. Brijker, Late Quaternary activity of the Feldbiss Fault zone, Roer Valley rift system, based on displaced fluvial terrace fragments, Tectono-phys 352 (2002) 295–315.
[16] R. Houtgast, 1991, Catalogus van aardbevingen in Nederland, KNMI Publ. 179, De Bilt, Pays-Bas.
[17] J. Van Gils, Aperçu historique de la séismicité de la région liégeoise, Ann. Trav. Publics Belg. 1985-4 (1985) 334–336. [18] T. Camelbeeck, M. Meghraoui, Large earthquakes in northern
Europe more likely than once thought, EOS Trans., Am. Geophys. Union 77 (1996) 405–409.
[19] K. Vanneste, K. Verbeeck, T. Camelbeeck, E. Paulissen, M. Meghraoui, F. Renardy, D. Jongmans, M. Frechen, Surface-rupturing history of the Bree fault scarp, Roer Valley graben: evidence for six events since the late Pleistocene, J. Seismol. 5 (2001) 329–359.
[20] R. Houtgast, R. van Balen, C. Kasse, Late Quaternary evolution of the Feldbiss Fault (Roer Valley Rift System, the Netherlands) based on trenching, and its potential relation to glacial unloading, Quat. Sci. Rev. 24 (2005) 491–510.
[21] R. Houtgast, R. van Balen, C. Kasse, J. Vandenberghe, Late Quaternary tectonic evolution and post seismic near surface fault displacements along the Geleen Fault (Feldbiss Fault Zone - Roer Valley Rift System, the Netherlands) based on trenching, Netherl. J. Geosci./Geol. Mijnb 82 (2003) 177–196.
[22] K. Vanneste, K. Verbeeck, T. Camelbeeck, T. Petermans, H. Beatse, New paleoseismologic evidence for a historical surface-rupturing earthquake on the Geleen fault, Lower Rhine graben area. Abstr. 2nd BELQUA Workshop, Tervuren (B), 13 mai 2004.
[23] J. Savage, M. Lisowski, Geodetic monitoring of the southern San Andreas fault, California, 1980–1991, J. Geophys. Res. 100/B (1995) 8185–8192.
[24] A. Sylvester, Leveling precision and benchmark motions, Piñon Flat Observatory, California, J. Geophys. Res. 89/B (1984) 7949–7956.
[25] I. Karcz, J. Morreale, S. Porebski, Assessment of benchmark credibility in study of recent vertical crustal movements, Tectonophys 33 (1976) 1–6.
[26] R. Edge, T. Baker, G. Jeffries, Borehole tilt measurements: aperiodic crustal tilt in an aseismic area, Tectonophys 71 (1981) 97–109.
[27] K. Evans, F. Wyatt, Water table effects on the measurement of earth strain, Tectonophys 108 (1984) 323–337.
[28] C. Braitenberg, Estimating the hydrologic induced signal in geodetic measurements with predictive filtering methods, Geophys. Res. Lett. 26 (1999) 775–778.
[29] J. Pöttgens, Ground movements over abandoned coalmines in relation to rising mine waters in Limburg (The Netherlands), Lecture French Mining Congress, Paris, 14–16 Novembre 2000, 2000, 9 pp.
[30] H. Gussinklo, H. Haak, R. Quadvlieg, P. Schutjens, L. Vogelaar, Subsidence, tremors and society, Geol. Mijnb. 80 (2001) 121–136.
[31] H. Munekane, M. Tobita, K. Takashima, Groundwater-induced vertical movements observed in Tsukuba, Japan, Geophys. Res. Lett. 31 (2004) L12608,doi:10.1029/2004GL020158. [32] T. van Dam, J. Wahr, P. Milly, A. Shmakin, G. Blewitt, D.
Lavallée, K. Larson, Crustal displacements due to continental water loading, Geophys. Res. Lett. 28 (2001) 651–654. [33] S. Zerbini, B. Richter, M. Negusini, C. Romagnoli, D. Simon, F.
Domenichini, W. Schwahn, Height and gravity variations by continuous GPS, gravity and environmental parameter observa-tions in the southern Po Plain, near Bologna, Italy, Earth Planet. Sci. Lett. 192 (2001) 267–279.
[34] V. Bense, R. van Balen, J. de Vries, The impact of faults on the hydrogeological conditions in the Roer Valley Rift System: an overview, Netherl. J. Geosci./Geol. Mijnb. 82 (2003) 41–54. [35] http://www.observatoire.be/SEISMO/en/eindex.htm.
[36] Y. Li, K. Aki, D. Adams, A. Hasemi, W. Lee, Seismic guided waves trapped in the fault zone of the Landers, California, earthquake of 1992, J. Geophys. Res. 99/B (1994) 11705–11722. [37] P. Spudich, K. Olsen, Fault zone amplified waves as a possible seismic hazard along the Calaveras fault in central California, Geophys. Res. Lett. 28 (2001) 2533–2536.
[38] W. Du, L. Sykes, B. Shaw, C. Scholz, Triggered aseismic fault slip from nearby earthquakes, static or dynamic effect? J. Geophys. Res. 108/B (2003) 2131,doi:10.1029/2002JB002008.
[39] T. Hanks, Earthquake stress-drops, ambient tectonic stresses, and stresses that drive plates, Pure Appl. Geophys. 115 (1977) 441–458. [40] T. Camelbeeck, 1993. Mécanisme au foyer des tremblements de terre et contraintes tectoniques: le cas de la zone intraplaque belge, Unpublished PhD thesis, Louvain-la-Neuve, 343 p. [41] A. Ruina, Slip instability and state variable friction laws,
J. Geophys. Res. 88/B (1983) 10359–10370.
[42] H. Dragert, K. Wang, T. James, A silent slip event on the deeper Cascadia subduction interface, Science 292 (2001) 1525–1528. [43] M. Miller, T. Melbourne, D. Johnson, W. Summer, Periodic slow earthquakes from the Cascadia subduction zone, Science 295 (2002) 2423.
[44] V. Kostoglodov, S. Singh, J. Santiago, K. Larson, A. Lowry, R. Bilham, A large silent earthquake in the Guerrero seismic gap, Mexico, Geophys. Res. Lett. 30 (15) (2003) 1807,doi:10.1029/ 2003GL017219.
[45] S. Ozawa, M. Murakami, M. Kaidzu, T. Tada, T. Sagiya, Y. Hatanaka, H. Yarai, T. Nishimura, Detection and monitoring of ongoing aseismic slip in the Tokai region, central Japan, Science 298 (2002) 1009–1012.
[46] S. Ozawa, Y. Hatanaka, M. Kaidzu, M. Murakami, T. Imakiire, Y. Ishigaki, Aseismic slip and low-frequency earthquakes in the Bungo channel, southwestern Japan, Geophys. Res. Lett. 31 (2004) L07609,doi:10.1029/2003GL019381.
[47] A. Linde, M. Gladwin, M. Johnston, R. Gwyther, R. Bilham, A slow earthquake sequence on the San Andreas fault, Nature 383 (1996) 65–68.
[48] D. Leynaud, D. Jongmans, H. Teerlynck, T. Camelbeeck, Seismic hazard assessment in Belgium, Geol. Belg. 3 (2000) 67–86.