Development and Application of an Immunization Network Design
Optimization Model for UNICEF
by
Henrique Ribeiro Carretti
Bachelor in Naval Engineering, Escola Politécnica, Universidade de São Paulo, 2016 and
Yuto Hashimoto
Master of International Development Policy, Sanford School of Public Policy, Duke University, 2019 SUBMITTED TO THE PROGRAM IN SUPPLY CHAIN MANAGEMENT
IN PARTIAL FULFILLMENT OF THE REQUIREMENTS FOR THE DEGREE OF MASTER OF APPLIED SCIENCE IN SUPPLY CHAIN MANAGEMENT
AT THE
MASSACHUSETTS INSTITUTE OF TECHNOLOGY May 2020
© 2020 Henrique Ribeiro Carretti and Yuto Hashimoto. All rights reserved.
The authors hereby grant to MIT permission to reproduce and to distribute publicly paper and electronic
copies of this capstone document in whole or in part in any medium now known or hereafter created.
Signature of Author: _________________________________________________________________ Henrique Ribeiro Carretti Department of Supply Chain Management
May 8, 2020 Signature of Author: _________________________________________________________________ Yuto Hashimoto Department of Supply Chain Management
May 8, 2020 Certified by: _______________________________________________________________________ Dr. Jarrod Goentzel Principal Research Scientist, Center for Transportation and Logistics Capstone Advisor Certified by: _______________________________________________________________________ Dr. Francisco J Jauffred Research Scientist, Center for Transportation and Logistics Capstone Co-Advisor Certified by: _______________________________________________________________________ Tim Russell Research Engineer, Center for Transportation and Logistics Capstone Co-Advisor Accepted by:_______________________________________________________________________
Prof. Yossi Sheffi Director, Center for Transportation and Logistics Elisha Gray II Professor of Engineering Systems Professor, Civil and Environmental Engineering
Development and Application of an Immunization Network Design Optimization Model for UNICEF by
Henrique Ribeiro Carretti and
Yuto Hashimoto
Submitted to the Program in Supply Chain Management on May 8, 2020 in Partial Fulfilment of the
Requirements for the Degree of Master of Applied Science in Supply Chain Management
ABSTRACT
Over the past five years, immunization coverage in Sub-Saharan Africa has stagnated at 72%. Immunization supply chains are expensive and complicated, and creating a model that helps optimize these supply chains is of great importance not only for people’s health but also for the efficient use of limited budget in developing nations. Most existing supply chain optimization models aim at minimizing costs or maximizing profit, which do not always fit in the context of humanitarian logistics. Also, they regard the demand as exogenous, but the proximity to health centers may affect people’s demand. Therefore, the objective of this project is to build an optimization model for vaccine network design that aims to maximize the access to immunization and incorporates the endogenous demand function. We take a two-step approach to build the model, and each step has a process of model formulation and validation. The first step is to formulate the toy model, a
simplified version of the model using an example dataset, to understand the basic behavior of the model. With the toy model validated, we formulate the final model, which incorporates more complexities based on the real dataset. Following that, a case study of The Gambia was conducted to validate the effectiveness of our model and to provide useful insights in a real-world context
regarding the applicability of our solution procedure. The results of the case study show the ability of the model to increase access to immunization. Through the opening of new outreach sites and the optimization of outreach allocation and scheduling, it would be possible to increase the
immunization access from 91% to 97.1%. Furthermore, our analysis contributes by showing that the better determination of the shape of a demand coverage function is a promising area of future research.
Capstone Advisor: Dr. Jarrod Goentzel
Title: Principal Research Scientist, Center for Transportation and Logistics Capstone Co-Advisor: Dr. Francisco J Jauffred
Title: Research Scientist, Center for Transportation and Logistics Capstone Co-Advisor: Tim Russell
ACKNOWLEDGMENTS
We would like to thank our capstone advisor, Dr. Jarrod Goentzel, and co-advisors, Dr. Francisco J Jauffred and Tim Russell, for their valuable guidance and great support. We would also like to express appreciation to our capstone partner organization, the United Nations Children's Fund (UNICEF), specially Ryan McWhorter and Olamide Folorunso, who provided us with valuable
feedback, supporting data, and great insights during the whole research process. Also, from UNICEF, we express our gratitude to Buya Jallow, Richard Duncan, and Rocco Panciera, who dedicated time to our interviews and provided us with important hands-on expertise in immunization practices. Moreover, we are grateful to Pamela Siska and Toby Gooley for their advice on writing. Finally, we would like to thank our mentors, family members, and friends for their support and dedication throughout the completion of our master’s program.
Table of Contents
List of figures ... 7
List of tables ... 10
1 Introduction ... 11
1.1 Current immunization supply chains optimization model limitations ... 12
1.2 Problem statement ... 12
1.3 Research questions ... 13
1.4 Study overview ... 13
2 Literature review ... 14
2.1 Vaccine network design model ... 15
2.2 Distance effect on vaccination coverage ... 23
2.3 Other factors affecting the demand ... 25
2.4 Literature review summary and gaps ... 26
3 Methodology ... 27
3.1 Toy model ... 27
3.2 Final model ... 30
4 Case study of The Gambia - Final model application ... 43
4.1 The Gambia network description... 44
4.2 Model inputs ... 45
4.3 Solution procedure – Code overview ... 69
4.4 Optimization scenarios ... 70
5.1 Gambia case scenarios optimization results ... 74
5.2 Gambia case analysis and recommendation ... 79
6 Conclusion ... 93
7 References ... 95
Appendix A: Toy model formulation ... 97
List of figures
Figure 1: Classification of the vaccine supply chain and overview of characteristics ... 16
Figure 2: Resource bundle illustration ... 32
Figure 3: Illustrative representation of the model variables ... 35
Figure 4: Example of distance effect on demand ... 43
Figure 5: The Gambia vaccination supply chain schematic view ... 45
Figure 6: Distribution of total population by site catchment area ... 47
Figure 7: Illustration of step by step procedure to derive the population data from SEDAC ... 49
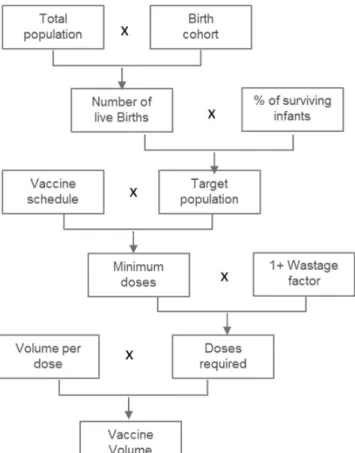
Figure 8: Calculation from population to vaccine doses. ... 50
Figure 9: Moderate access demand function (1, 5) ... 52
Figure 10: High access demand function (1, 10) ... 53
Figure 11: Low access demand function (0, 2.5)... 53
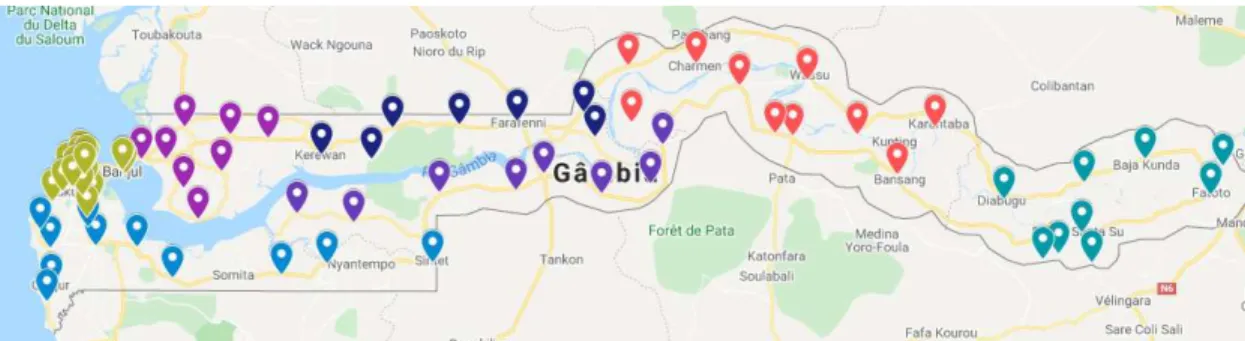
Figure 12: Plot of health care facilities in The Gambia network (colored by region) ... 54
Figure 13: Plot of outreach sites in The Gambia network (colored by region) ... 54
Figure 14: Distance calculation method ... 55
Figure 15: Extract of The Gambia road network ... 56
Figure 16: Schematic view for the calculation of road distances using OSM ... 56
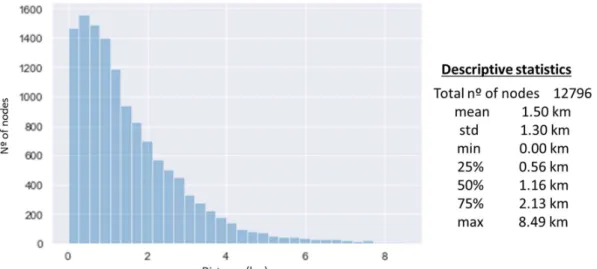
Figure 17: Histogram showing distance between the centroids of the grid and closest node in OSM road network ... 58
Figure 18: Outreach candidate sites using OSM road network approach ... 59
Figure 19: Candidate sites selection based on OSM graph closest nodes to grid ... 59
Figure 20: Vehicles used in the outreach treks ... 62
Figure 21: Blowkings 7-liter vaccine cold box ... 63
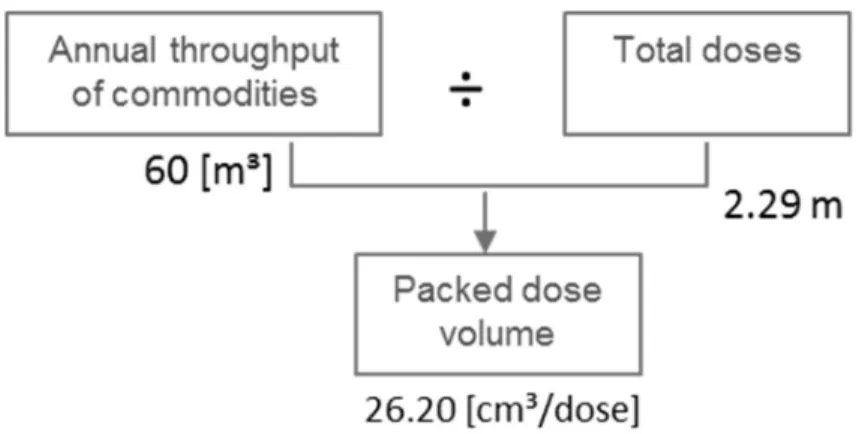
Figure 22: Calculation procedure to derive average volume of a dose including package and empty spaces ... 64
Figure 24: Histogram of number of number of facilities divided by their frequency visit ... 68
Figure 25: Histogram of total target population for each facility, dived by frequency of visits ... 69
Figure 26: Solution procedure schema ... 70
Figure 27: Outreach and fixed health centers of baseline scenario ... 72
Figure 28: Vaccination access level for different budgets. High coverage demand function ... 74
Figure 29: Number of used locations. High coverage demand function. ... 74
Figure 30: Vaccination access level for different budgets. Medium coverage demand function ... 74
Figure 31: Number of used locations. Medium coverage demand function ... 74
Figure 32: Vaccination access level for different budgets. Low coverage demand function ... 75
Figure 33: Number of used locations. Low coverage demand function ... 75
Figure 34: Scenario 2 – Vaccination access level and budget. High coverage demand function ... 77
Figure 35: Scenario 2 - High coverage demand function ... 77
Figure 36: Scenario 2 - Vaccination access level and budget. Moderate coverage demand function . 77 Figure 37: Scenario 2 - Number of open facilities. Moderate coverage demand function ... 77
Figure 38: Scenario 3 - Vaccination access level and budget. Demand (2,10)... 78
Figure 39: Scenario 3 - Number of open facilities. Demand (2,10) ... 78
Figure 40: Scenario 3 - Vaccination access level and budget. Demand (1,5) ... 78
Figure 41: Scenario 3 - Number of open facilities. Demand (1,5) ... 78
Figure 42: The Gambia DTP3 coverage levels ... 80
Figure 43: Comparison of access levels of different optimization approaches, demand function (2,10) ... 81
Figure 44: Access levels of different optimization approaches ... 82
Figure 45: Number of facilities ... 83
Figure 46: Total number of dose per facility type ... 84
Figure 47: Total monthly cost per facility ... 84
Figure 49: Mechanism of shifting to outreach sites ... 84
Figure 50: Average distance from health facilities to outreach sites ... 85
Figure 51: Number of sites per facility type ... 86
Figure 52: Total Number of doses per facility type... 86
Figure 53: Total monthly cost per facility type ... 86
Figure 54: Cost per dose per facility type ... 86
Figure 55: Average distance from health facilities to outreach sites ... 87
Figure 56: Number of outreach trips ... 87
Figure 57: Average number of doses per outreach trip... 87
Figure 58: Number of vehicles required per month, per health center ID, for outreach trips... 88
Figure 59: Average number of nurses per outreach trip ... 89
Figure 60: Number of "employees -day" requirements at health centers ... 90
Figure 61: Example of population sets creation ... 101
Figure 62: Toy model network structure ... 104
Figure 63: Toy model Scenario 1 optimal network ... 105
Figure 64: Toy model Scenario 2 optimal network ... 106
List of tables
Table 1: Comparison of key characteristics of previous vaccination network models ... 22
Table 2: Rates of visits to peripheral health facilities among children living in the western Kenya by distance lived from the nearest clinic 2003–2004 ... 24
Table 3: Percent of correct vaccination depending on walk-time ... 25
Table 4: Resource bundle parameters ... 33
Table 5: The Gambia vaccination schedule, target, wastage ... 51
Table 6: Key columns name and description of Master data xls. ... 54
Table 7: Nurse salaries in The Gambia, inflation adjusted ... 60
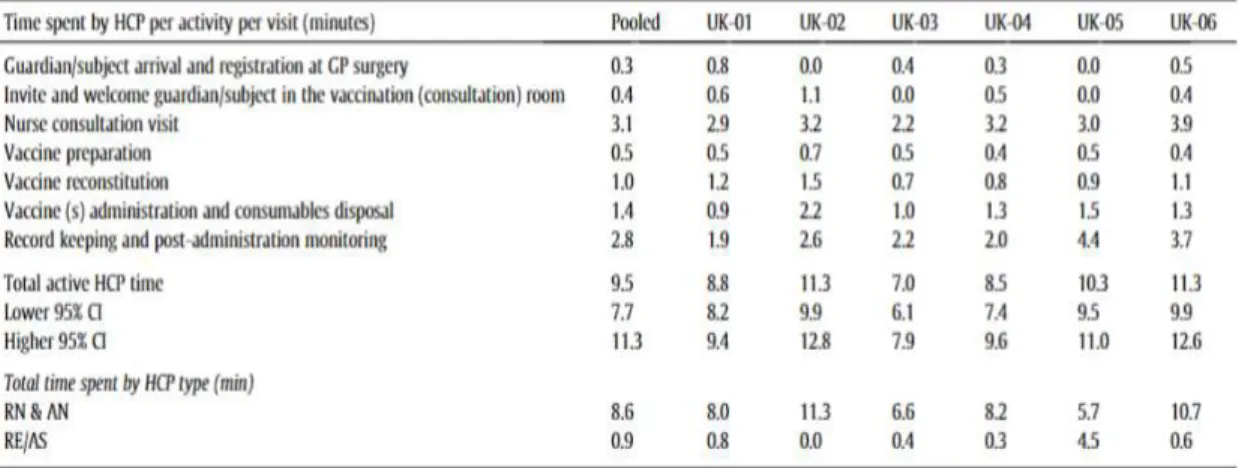
Table 8: Active HCP time by activity per single vaccine administration process ... 61
Table 9: Summary of model input parameters ... 65
Table 10: Data cleaning procedure example in National Trekking file ... 67
Table 11: List of main python libraries used and their application ... 70
Table 12: Overview of the differences between the three optimization scenarios ... 71
Table 13: Summary of inputs and outputs used in toy model validation ... 103
Table 14: Toy model baseline outputs ... 104
Table 15: Comparison of toy model scenarios outputs - baseline and high outreach costs ... 106
Table 16: Comparison of toy model scenarios outputs - baseline and high fixed health center employee costs ... 107
Table 17: Comparison of toy model scenarios outputs - baseline and high fixed health canter employee costs ... 108
1 Introduction
A rise in immunization coverage has resulted in reduced children mortality especially in developing countries. Even though remarkable progress has been achieved in the reduction in neonatal mortality, according to an annual report issued by the United Nations Children's Fund (UNICEF), 6.3 million children lost their lives in 2017, most of it from preventable causes (UNICEF, 2019).
The context of this project is an alarming situation involving vaccination in African countries. Over the past five years, immunization coverage in sub-Saharan Africa has stagnated at 72%. These factors have prompted global immunization experts attending the 2019 Regional Immunization Technical Advisory Group (RITAG) meeting to call for strengthened routine immunization (WHO Regional Office for Africa, 2019).
UNICEF is a non-profit organization internationally recognized for its humanitarian work. One of the goals that UNICEF set is that every child survives and thrives (Goal Area 1), which involves thematic work in health, nutrition, HIV and AIDS, and early childhood development. This institution plays a vital part in the progress of immunization. In 2018, the organization provided three doses of the Pentavalent (five-in-one) vaccine for an estimated 65.5 million children. UNICEF recognizes that primary health care – integrated programs and interventions across the life cycle, delivered within strong community health systems – is the most sustainable path to achieving Goal Area 1 results and the third Sustained Development Goal: healthy lives and well-being for all (UNICEF, 2019). Through the collaboration of UNICEF’s know-how in immunization and MIT’s research expertise, this project tackles the issue of increasing the level of access to vaccination in less developed countries through the design of more efficient vaccination networks.
The objective of this project is to build an optimization model for vaccine network design through incorporating innovative features that enhance the maximization of immunization coverage.
1.1 Current immunization supply chains optimization model limitations
Immunization supply chains are expensive and complicated, and creating a model that helps optimize these supply chains is of great importance not only for people’s health but also for the efficient use of limited budget in developing nations. Different types of network optimization can be found in the literature, such as demand allocation, vaccination location, production capacities, and batch sizes (Lemmens, Decouttere, Vandaele, & Bernuzzi, 2016). However, this project will focus on the most common and strategic decisions of the network in developing countries: the location of outreach immunization sites and fixed-health-center capacity.
Generally, supply chain optimization and facility location models ignore the impact of supply chain network design on demand and profit. Instead, they focus on cost. However, proximity to supply facilities may influence price and service sufficiently to affect customer behavior. In partnership with a chemical industry firm, MIT’s Center for Transportation and Logistics (CTL) previously conducted research on the impact of supply chain network design on demand. The key research development was the creation of a flexible market share function that is endogenous to the mathematical model so that an optimized solution directly considers how the design of a supply network shapes demand. The results proved this to be the case for price- and time-sensitive commodities when decision makers chose to invest more in their supply network to drive higher demand (Russell, Jauffred, & Goentzel, 2019). The impact of these findings can go beyond this single chemical firm. This previously developed model has the potential to be applied to other cases, including non-profit health facilities to increase vaccine access.
1.2 Problem statement
Given the significance of stagnated vaccine coverage in Africa and the organizational mandate of UNICEF, it is important to design a more efficient vaccine network. The goal is to increase
immunization access with responsible and efficient use of budgets. The proposed analysis helps local governments to optimize the locations and operation of outreach sites. To this end, a mathematical optimization model can be a useful tool. However, it needs to be well formulated enough to
consider the unique characteristics of vaccine supply chains. The two most important characteristics specified for such a model concern its objective function and demand modelling:
1. Objective function: Instead of minimizing cost or maximizing profit, this model should aim to maximize vaccination access
2. Demand function: Rather than having demand as fixed and exogenous, demand is endogenous and based on the proximity of health centers.
It is also important to mention that our project scope, based on the discussion with UNICEF, focused on the strategic decision of utilizing only the existing fixed health centers. The model considered adding resources to existing fixed health centers and adding new outreach sites. The model did not consider the establishment of new fixed health centers.
1.3 Research questions
Based on the problem statement, the research questions of this project are as follows: 1. How should the efficient vaccine network model be formulated in order to maximize access
to those seeking immunization services under certain constraints?
2. How does the proximity of population to vaccination health centers affect the vaccine coverage?
3. How can other factors that influence the demand for vaccinations be included in the model?
1.4 Study overview
In order to answer the above research questions, we started by performing a literature review of pertinent studies in vaccination network optimization, described in Section 2. Based on the results of this study and discussions with UNICEF, a set of characteristics for a simplified network
optimization model were defined in Section 3.1. More in-depth discussions with stakeholders resulted in the identification of new relevant aspects that were incorporated into the formulation and resulted in a final optimization model, shown in Section 3.2. This model’s efficacy was then tested in a case study of The Gambia Vaccination Network with data provided by UNICEF, discussed
recommendations on how to improve vaccination access. Finally, the study conclusions are presented in Section 6.
Previous research papers typically used approximate and aggregated data for model validation without presenting details on how the input parameters were derived. Therefore, the applicability and efficiency of such models in a professional environment are extremely limited because other users are not able to derive the necessary data input of the model.
Working with real data is often challenging and requires some assumptions and data treatment procedures. With the objective of guaranteeing the reproducibility of the developed model and its applicability in real case scenarios, the case study in Section 4 described in detail the procedures and assumptions that were required to treat the real dataset. Whenever possible data was derived from publicly available sources and its extraction procedure was explained. By doing this, we expect to assist other professionals facing the issue of handling data on their own network design models and increase the practical application of the theoretical works found in the literature.
2 Literature review
This section is organized as follows: In Section 2.1, corresponding to research question 1, we conducted a thorough research on previous vaccination network design models, and we compared them based on a set of criteria relevant to the problem. This comparison allowed us to identify some gaps and define preliminary characteristics of our model. In Section 2.2, we answered research question 2 and described how previous works have incorporated the negative impact of distance on demand. To answer the last research question, in Section 2.3, we outlined what other factors have been found in the literature that could have potential impacts on demand and how this topic could be further explored. Finally, as a conclusion, we summarized the literature review, and the identified research gaps.
2.1 Vaccine network design model
In this section, we investigated previous works in the field of vaccination network design. First, in Section 2.1.1, we identified that a wide variety of work has been done in the broad field of
vaccination networks and narrowed down our detailed review to the papers with the greatest similarity to our problem. Then, In Section 2.1.2, we conducted a more detailed review of six papers and compared them based on a set of self-established criteria in order to highlight their models’ characteristics.
2.1.1 Previous work on vaccination networks
We found two past studies that revised previous optimization models of vaccination networks. Both papers presented their own way of clustering the research they reviewed. Initially, Lemmens et al.
(2016) clustered the past studies of network design based on the type of problem they aimed to solve, giving the following framework: (1) demand allocation; (2) vaccination location; (3) production capacities, and (4) batch sizes. A more recent work by Duijzer, Van Jaarsveld, and Dekker (2018) used
four other components for classification, similarly focusing on the problem to solve. Their categorization is: (1) product; (2) production; (3) allocation; and (4) distribution (Figure 1:
Classification of the vaccine supply chain and overview of characteristics
Source: Duijzer, L. E., van Jaarsveld, W., & Dekker, R. (2018). Literature review: The vaccine supply chain. European Journal of Operational Research, 268(1), 174–192.Figure 1). Although the naming of the clusters is different, we can find similarity amongst the components presented by both papers. For instance, the vaccination location in Lemmens et al. (2016) is similar to the distribution in Duijzer et al. (2018) since the decision of where the vaccination center should be located is intrinsically connected to how vaccines are distributed.
Figure 1: Classification of the vaccine supply chain and overview of characteristics
Source: Duijzer, L. E., van Jaarsveld, W., & Dekker, R. (2018). Literature review: The vaccine supply chain. European Journal of Operational Research, 268(1), 174–192.
Further exploring the literature, we concluded that our literature review narrows down to two groups of papers - the distribution and vaccination location. We focused on location-distribution papers because the work with UNICEF specifically focuses on low-income countries. For vaccination networks in low-income countries, it is reasonable to assume that the decisions on product and production, such as who will be the supplying countries for the vaccines and how many doses of what type will be made available, are done by centralized planning arms of the governments (Chen, Norman, Rajgopal, Assi, Lee, & Brown, 2014). However, our model is not limited to developing countries and can be applied to any country with centralized planning of the health system. While previous papers fail to differentiate their studies based on the degree of development of the country, we believe this is an important consideration. Moreover, the decisions on allocation, such as who should receive the vaccine, are not pertinent to our objective of research since our project is to maximize the access to immunization and not to decide who should or should not receive vaccines. With the product, production and allocation decisions out of scope, our literature review narrows down to distribution aspects of the vaccination.
Furthermore, according to Chen et al. (2014), the basic structure of vaccine supply chains in these countries follows a similar structure, with a central storage location that serves as a supplier to a multi-layered chain formed by stores/hubs and clinics.
Focusing on vaccination-location issues in the low-income countries, we narrowed down the relevant studies to six papers.
2.1.2 Distribution design models in the literature
Defining the scope of further literature review, as distribution issues in low-income countries, we identified six papers which are highly relevant to the specified topic. In order to establish a methodology of comparing these six works, we propose the following criteria for classification:
Type of objective: Minimize costs, maximize access to vaccine
Decisions: Locations, flow between nodes, inventory level, vehicle types, storage types, and other relevant characteristics.
Network structure: Central distribution, hubs, clinics, outreach sites Demand: Fixed exogenous, stochastic, causal endogenous
Product: One vaccine, multiple vaccines Period: Single period, multi-period
Specific constraints: Vehicle/storage capacities, maximal distance
Our classification criteria are similar to what has been proposed by Duijzer et al. (2018). According to them, there are three types of decisions when designing vaccination distribution networks: (1) the design of the supply chain – number of layers and its locations; (2) The inventory control policy – size and location of stock; and (3) The distribution to end users from fixed points of dispensing (clinics for the distribution of vaccines) or via mobile facilities. Although this
segmentation makes sense, the greater level of detail in criteria is crucial in order to differentiate the existing models more precisely. It ultimately enables us to identify gaps and define specific characteristics of our model.
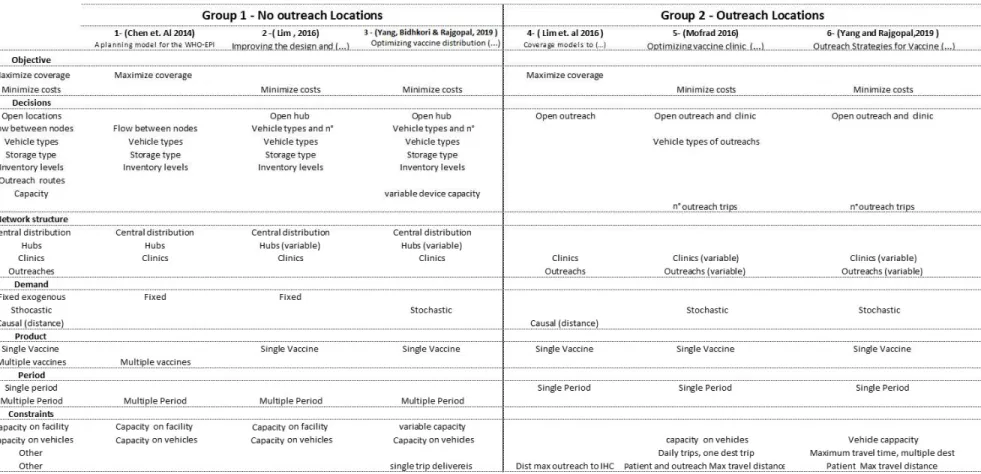
At the end of this section, a summary matrix which illustrates the different characteristics of the literature review is presented (Table 1). For the clarity of analysis, we divided the six papers into two groups based on the strong connection among the works.
2.1.2.1 Non-outreach models
In this first group, we clustered three papers which do not consider outreach sites. Chen et al. (2014) builds a general mathematical model to optimize operations in vaccination networks in low-income countries. They proposed a formulation that considers a multi-period capacitated network model with different types of storage devices, vehicles, and vaccines types. The model’s main decisions are the inventory levels and flows in a multi-period time horizon. From a vaccination perspective, they only consider the possibility to fulfill the demand from fixed health centers. The most innovative aspect of its formulation is the introduction of the vaccination regimen concept that determines how many doses of each vaccine type a child must receive to be considered fully
immunized. Apart from its complexity, their model is not making strategic decisions regarding location opening. It means that the main purpose of this work is to define the optimal way to operate a vaccination network that is already established under the scenario of several specific constraints, which differs a bit from our strategic level research objective.
Building upon the work done by Chen et al. (2014) and Lim (2016) proposed a model to redesign vaccine distribution networks in low- and middle-income countries, incorporating strategic location opening decisions. To this end, a sophisticated Mixed Integer Programming (MIP) model was proposed. The objective of this model is the minimization of costs. The model’s main decision variables are the opening of distribution hubs for a given fixed source (national distribution center) and clinics. In addition to the hub opening, the other operational decisions of the model are the flows between nodes, types and quantity of storage devices in each facility, types of vehicles used, and the number of trips. Compared to the work developed by Chen et al. (2014), the multiple vaccines complexity was removed, but the addition of the location opening, combined with other
more operational aspects, made the problem complex. Due to this complexity, the authors had to develop a novel hybrid algorithm based on MIP and an evolutionary strategy.
The most recent work addressing the optimization of vaccine distribution networks operation in low-income countries was conducted by Yang and Rajgopal (2019). This research was built upon Lim (2016) and added some complexities to the model such as flexible sizes of storage devices and a single trip constraint on deliveries. Once again, the problem complexity and size made it necessary to create a disaggregation-and-merging algorithm because standard commercial software would not be able to solve the problem directly.
Although these three papers can be a great source of the potential enhancement of our model with additional operational constraints, they considered exogenous demand and required a complex solving methodology due to the high level of operational decisions being made. Most critically, none of them incorporated outreach sites. As we describe in the next section, based on the input from interviews with UNICEF experts, we learned that the vaccination through outreach sites is highly relevant factor for the immunization efforts in low-income nations, and hence incorporating outreach sites becomes is defined as premise of our model.
2.1.2.2 Outreach models
In this section, we present three works in the second group which considered outreach sites in the vaccination network modelling. As defined by Yang and Rajgopal (2019), an outreach
vaccination operation is characterized by health care professionals who are sent from fixed clinics to villages where one-day clinics are set to vaccinate the nearby population. Outreach sites are
extremely important way to increase vaccination access in remote areas. This effort is aligned with the Reaching Every District strategy (RED) established by UNICEF and its partners since one of the operational components of RED is to reach target population through the development of different vaccination delivery strategies (Vandelaer, Bilous, & Nshimirimana, 2008).
The first quantitative model to determine optimal outreach trips and policies to maximize coverage was presented by Lim, Claypool, Norman, and Rajgopal (2016). This work, in addition to be
the first one to consider outreach sites, also considered the distance impact in coverage – a key aspect of our research. The main decisions made by the model are where outreach sites should be placed, and fixed clinics should serve as a base for the outreach operations. An important
assumption of this modelling is that each outreach must be located at a maximum distance from fixed clinics.
Building upon the work developed by Lim et al. (2016), a new formulation was created to find the design of fixed and outreach vaccination services in Hasanzadeh-Mofrad (2016). An innovative aspect of this work lies in the combination of health centers location and outreach planning by including the fact that population could also be vaccinated in health centers. Using the different approach from Lim et al. (2016), this model treats the outreach planning as a vehicle routing problem. In practice, this means that there is also a limitation on the number of vaccines that each outreach location can receive from a single trip in addition to the distance constraint already presented by Lim et al. (2016). The formulation proposed by Hasanzadeh-Mofrad (2016) is quite complex, and it includes stochasticity to the demand. However, one downside of the research is that it does not consider the effect of causal demand that is reduced with the increase in distance.
The latest work focusing on outreach planning was presented by Yang and Rajgopal (2019). Their modelling approach is very similar to Hasanzadeh-Mofrad (2016) with the main distinction of incorporating the time aspect into the outreach trip planning. In their modelling, each trip is allowed to visit multiple destinations, but it is subjected to specific time windows constraints. In this sense, the work by Yang and Rajgopal (2019) can be seen also as vehicle routing problem with time windows (VRPTW) combined with a set-covering problem (SCP).
The works proposed by Hasanzadeh-Mofrad (2016) and Yang and Rajgopal (2019) added significant complexity to the modelling of Lim et al. (2016) with the incorporation of routing aspects to outreach trips, the decision of clinics location, and service levels. However, both papers lost an important aspect of Lim et al. (2016) formulation, which is the incorporation of the negative effect of distance on immunization demand. In addition to that, the modelling approach of considering the
outreach sites as vehicle routing problems, which can be performed by different vehicle types, is already in an operational level of detail which is not the scope of this research. Finally, the health center opening decision is irrelevant to our model since the health centers locations and opening will be treated as a fixed input parameter.
We concluded that the work with most similarity to the objective of our research is Lim et al. (2016).
2.1.2.3 Models summary and research gap
Based on the criteria presented in the beginning of this section, Table 1 shows our classification of the literature.
To build upon Lim et al. (2016), the following gaps were addressed in our initial formulation: Incorporation of the fact that population can also be served by fixed clinics
Incorporation of a more flexible demand function instead of the stepwise or binary solution proposed in the reference paper.
Incorporation of flexible capacity in fixed clinics as decision variable (e.g., varying number of employees or working hours)
Incorporation of variable costs in fixed clinics depending on number of employees
Following the criteria established in the beginning of this section, and presented in Table 1, we can define our model preliminary characteristics as follows:
Objective: Maximize access to vaccine
Decisions: Open outreach; service level at fixed clinics. Structure: Clinics, and outreach sites.
Demand: Causal Product: Single vaccine Period: Single period
22
2.2 Distance effect on vaccination coverage
As we presented our second research question, one of the goals of this project is to understand the impact of distance on vaccination coverage and how to incorporate it into the model. The relevance of including this factor has been quantitatively assessed by Blanford, Kumar, Luo, and MacEachren (2012). After conducting study in Niger, their results showed with a 95% level of significance that the probability of children living at an hour distance to vaccination facilities to be fully immunized at one year old are 1.88 higher than children living in more distant areas. Because the distance is directly correlated to time, this is a strong indication that the distance effect should be considered when designing demand access to health care.
Some papers, in a health care context, modelled the negative impacts on coverage as distance from clinics to patients increases. The work developed by Verter and Lapierre, (2002) was the first to consider this aspect. In their maximal coverage location of preventive health care facilities problem, they assumed that the coverage reduced linearly with an increase of distance from patients to health facilities. After that, Tanser (2006) and Gu, Wang, and McGregor (2010) also incorporated this effect in their health care facilities location researches with similar approaches.
The first paper to incorporate this specific effect in their optimization vaccination networks models was Lim et al. (2016). They presented four different models that explored the effect of distance increase on reduction of coverage. Different from Verter and Lapierre (2002), however, they consider the reduction of coverage to be either binary or stepwise. In our modelling, we will initially assume a linear decrease in demand function based on the distance, similar to what was done by Verter and Lapierre (2002).
In addition, some papers studied the distance-decay effect quantitatively. For instance, Feikin, Nguyen, Adazu, Ombok, Audi, Slutsker, and Lindblade (2009) presented the impact of distance of residence from a peripheral health facility on pediatric health utilization in rural western Kenya. Distance-decay effect was confirmed by their research statistically. The rate of clinic visits by residents decreased linearly at 0.5 km intervals up to 4 km, after which the rate stabilized. Using
Poisson regression, for every 1 km increase in distance of residence from a clinic, the rate of clinic visits decreased by 34% (Table 2). The differences from our research are that their study was not applied to the immunization context and the target was specifically sick children. Ibnouf, Van den Borne, and Maarse (2007) studied time factor influencing immunization demand among children under five years of age in Khartoum State, Sudan. Walking time to the nearest place of vaccination strongly influenced the correct vaccination status of the child. Children of mothers who have better access to vaccine services (less than 30 minutes walking time to the nearest place of vaccination) were about 3.4 times more likely to have had the correct vaccinations than were children of mothers who have to walk 30 minutes or longer (Table 3).
Table 2: Rates of visits to peripheral health facilities among children living in the western Kenya by distance lived from the nearest clinic 2003–2004
Source: Feikin, D. R., Nguyen, L. M., Adazu, K., Ombok, M., Audi, A., Slutsker, L., & Lindblade, K. A. (2009). The impact of distance of residence from a peripheral health facility on pediatric health
utilization in rural western Kenya. Tropical Medicine and International Health, 14(1), 54-61. https://doi.org/10.1111/j.1365-3156.2008.02193.x
Table 3: Percent of correct vaccination depending on walk-time
Source: Ibnouf, A.H., Van den Borne, H.W. & Maarse, J.A.M. (2007). Utilization of family planning services by married Sudanese women of reproductive age. EMHJ - Eastern Mediterranean Health
Journal, 13 (6), 1372-1381, 2007 https://apps.who.int/iris/handle/10665/117388
2.3 Other factors affecting the demand
The last research question, and literature strand, is to understand how other factors apart from long distances negatively affect vaccination demand and how they have been incorporated to vaccination network models.
Only one paper performed an assessment of the factors impacting access to immunization services. The case study by Echakan, Oluoch, and Osuga (2018), quantitatively and qualitatively assessed through interviews of the population and health records analysis, that distance/time is a main factor in access to immunization. One additional aspect mentioned in their work was the importance of advertisement of outreach operations so that the target population is aware of when and where outreach sites will be opened. This is an intuitive piece of information that no models have considered since it goes beyond supply chain aspects.
In addition, it can be assumed from the discussion with UNICEF experts that the quality of human resources, especially at outreach locations, significantly affects the demand of vaccination. Human resource includes both the skilled health professionals and unskilled volunteers. If their morale as well as their quality of work are high, more people will tend to get vaccinated. It is not yet clear, however, how these effects can be incorporated into optimization models.
2.4 Literature review summary and gaps
From the first objective of our literature review, to understand the characteristics of previous work done on vaccination network design, we showed that a total of six papers had similar
characteristics to the object scope of our study. Of those, it was shown that in only one the demand was treated as endogenous to the model. This was the main reason for defining Lim et al. (2016) as the basis formulation for our model. The matrix comparison allowed us to compare all the works in a methodological way and to define how our model characteristics can be compared to previous research. In Section 2.2, we showed that in addition to Lim et al. (2016), other papers also incorporated effects of demand decrease based on distance, but in general we found a lack of a structured approach for defining a demand function shape and its parameters. Finally, in Section 2.3, it was shown that only one paper referenced an additional factor that could have an effect on demand which is the necessity of advertisement campaigns for the outreach sites. However, this is a factor difficult to quantify and will hardly be incorporated to supply chain optimization models.
By defining Lim et al. (2016) as the model to be used as reference to our work, we showed that other aspects can be incorporated to the formulation to increase its complexity and adherence to the case study from this project. It is important to point out that the final model characteristics will be defined in conjunction with UNICEF to achieve the required level of adherence to our specific case of study. Some papers found in the literature raise awareness for the importance to keep the formulation simple enough to allow flexibility and efficiency on the solution. Our model should not include operational level decisions such as vehicle type or storage devices types but should focus on strategic location facilities decisions. This will allow decisions makers to build the sufficient level of trust and intuition necessary for the design of efficient vaccination supply chain networks using our model.
Even though our initial toy model was based on Lim et al. (2016), the developed model was not simply be a replication of the previous research. The following gaps have been identified in their formulation and will be addressed in our model:
Incorporation of the fact that population can also be served by fixed health centers Incorporation of more flexible demand function instead of the stepwise or binary solution
proposed by the previous study
Incorporation of flexible capacity in fixed health centers
Incorporation of variable and fixed costs in fixed health centers and outreach sites
3 Methodology
The key objective of this research is to develop a network design optimization model that maximizes access to vaccination in low-income countries through the incorporation of an
endogenous demand function into the model. To achieve this end, the first step is to define what characteristics the model should possess. Specifically, this entails the selection of the decision variables, demand function, constraints, and cost factors of the problem. Initially, the toy model, a simplified version of the model, was formulated to understand the basic behavior of the model, as discussed in Section 3.1.
With the toy model validated, additional discussion with UNICEF allowed us to define the characteristics of the final model, which is outlined in Section 3.2. The final formulation incorporated the fact that the capacity of the outreach sites would no longer be fixed, but instead is dependent on the amount of resources sent from the fixed health centers.
3.1 Toy model
Based on a literature review and discussion with UNICEF, we developed our initial problem and state its characteristics in Section 3.1.1 (detailed formulation is presented in Appendix A). This initial model, called toy model, had an objective of understanding the basic factors that would influence the optimal network design and served as a tool to guide our discussions with stakeholders. The toy model was tested in a small-scale problem with fictitious data. The main results and conclusions obtained with this exercise are shown in Section 3.1.2 (further details are
presented in Appendix B). Furthermore, Python formulation for the toy model can be found in the GitHub repository1
3.1.1 Toy Model characteristics
The objective function of the toy model is to maximize the immunization access in a certain country where the vaccine is not sufficiently distributed and the potential demand for immunization services exists. The immunization can be done in either fixed health centers or outreach sites. Fixed health centers are established health centers that offer routine immunization services in the facility. Outreach sites are single-day clinics conducted in a building in a more remote community where the vaccination operation for local residents is conducted by people sent from fixed health centers. The developed optimization model must decide the number of employees necessary at the fixed health centers and which candidate outreach sites should open.
Our toy model considers that each fixed health centers has a minimum operating capacity and that the maximum capacity of each fixed health center is dependent on the number of workers of the optimal solution. Outreach sites are considered to have a fixed capacity.
Regarding costs, three types of costs are taken into consideration in the toy model: (1) direct labor cost at fixed health centers; (2) fixed implementation cost of outreach sites; and (3) the vaccine administration service cost. This last cost factor is proportional to the distance between population and immunization center. The model adopts a steady state operation.
Following our project objective, the demand for immunization was modeled as an
endogenous function. This causal demand accounts for the fact that people’s willingness or capacity to travel for immunization decreases as the distance from population center to immunization center increases. This approach is in line with other previous studies identified, as described in Section 2.2.
Details of the toy model formulation are presented in Appendix A, but the key characteristics of it can be summarized as follows:
Objective:
Maximize access to vaccine Immunization facilities types:
Fixed health centers (always open) Outreach sites
Decisions:
Number of employees at fixed health centers Open outreach sites candidates
Constraints:
Maximum distance between outreach sites and fixed health centers Minimum number of employees in fixed health centers
Maximum number of employees in fixed health centers Vaccination capacity of outreach sites
Total cost must be lower than available budget Costs:
Fixed cost for outreach implementation Fixed health center employees’ cost
Cost to serve, per vaccine, at fixed health center Cost to serve, per vaccine, at outreach sites Period:
Single period (steady state operation) Product:
Single vaccine Demand:
3.1.2 Toy model validation and conclusions
The details of the validation procedure of the toy model are presented in Appendix B. In summary, the validation was done by varying three input variables: (1) health center employee costs; (2) fixed outreach implementation costs; and (3) the linear distance coefficient of the demand function. The impacts of the input variation were evaluated in three outputs: (1) the number of employees necessary in the fixed health centers; (2) the number of outreach sites open; and (3) the total vaccination access levels obtained.
In the first scenario tested, it was observed that an extreme increase in outreach
implementation costs led to an increase in the utilization of the fixed health centers. Consequently, the number of employees in fixed health centers was increased while the number of outreach sites opened was decreased. In the second scenario tested, the opposite model behavior was witnessed when we increased the cost of fixed health center employees and obtained a final solution with less participation by the fixed health centers. Finally, we demonstrated in the last scenario that the optimal solution tends to have more outreach sites opened as the effect of distance on demand increases.
Since the results from these three tests matched the expectations, we conclude that the toy model works as expected, and that the validation process was successful. Running the different scenarios allowed us to identify some gaps in the formulation and address them in the final model.
3.2 Final model
The toy model formulation was fundamental to validating the basic dynamic of the network design problem and the impact of parameter variations in the final network configuration. However, one important factor that the toy model failed to incorporate is the fact that the size of the outreach sites may vary depending on the amount of resources used, and so its capacity should vary. Another point for improvement is that the costs of the outreach operation should not also be fixed; rather, they depend on how large and distant the outreach site is from its supplying facility. In this section,
is presented how those, and other factors were implemented in the model, together with its final mathematical formulation.
3.2.1 The addition of outreach resource supply variable
In the toy model formulation, the cost of an outreach operation would be the sum of a fixed implementation cost Co, plus the cost of vaccinating each population center j from the outreach site o, 𝑐 . This last factor would be impacted by the distance from each center j to the outreach o, with more distant centers being more expensive to serve.
This model was useful for the initial formulation of the problem and to guide the discussions with stakeholders. However, after further research and inputs from experts, three factors became clear:
1. The immunization cost from an outreach site is not dependent on the distance from the patient to the outreach site, since the fact that a person has to dislocate does not impact the cost of the operation. It undoubtedly impacts the amount of people a facility can reach, but not the costs.
2. The cost of an outreach operation is not fixed. Rather, it is driven by the amount of
resources (vehicles, nurses, and vaccines) that need to be supplied from the health centers, and by their distances to the supply source.
3. The vaccination capacity of an outreach site is not fixed, but instead is dependent on the amount of resources sent.
Considering these three factors, the new formulation added a resource flow from the fixed health center f to the outreach site o. These resources are divided in units, called bundles, and are basically everything that is key for implementing an outreach operation: nurses, vaccines doses, cold boxes, and vehicles. The amount of resource bundles and the distance between supply point and outreach destination will be the factors used to determine the outreach capacity.
3.2.2 Resource bundle concept
A resource bundle will be defined as a unitary package of the essential resources necessary to implement a certain amount of capacity in the outreach sites. The amount of resource bundles sent will impact the size of the outreach in terms of its immunization potential (in number of vaccine doses), and ultimately its costs.
After the interviews with UNICEF experts, five key resources necessary to guarantee the outreach implementation have been identified: (1) vaccines doses; (2) cold boxes and ice packs; (3) the vehicle used in the transport; (4) nurses responsible to administer the drug; and (5) other basic equipment, such as needles. Figure 2 illustrates the resource bundle concept.
Figure 2: Resource bundle illustration
The model will consider that just an integer amount of resource bundles can be allocated to each operation. The main assumption behind the resource bundle concept is that it is possible to derive correlation parameters between the quantities of each of the resources inside each bundle. For example: one vehicle may fit five people and 12 cold boxes.
For each use case of our model, the network modeler should define which of the five key resources will have a 1:1 correlation to the bundle—in other words, which of the five resources available will have one unit included in each bundle. The definition of what will be the unitary resource bundle will depend on what is the factor that is most relevant to the country-specific circumstances and its operational bottleneck. We present two examples to illustrate this concept:
In a specific network, the number of nurses could be fixed, and there is unlimited access to transportation. In this example, the best way would be to define one resource bundle as one nurse, and then derive how much of the other factors each nurse demands to fulfill the immunization capacity. In this case, the model would be allocating nurses.
In a different network the limiting factor might be the number of available vehicles. In this scenario, the unitary resource bundle should be defined by the vehicle.
For our case study application, presented in Section 4, the vehicles were defined as the unitary resource inside the bundle. It is important to highlight that we kept the formulation flexible in case a different unitary resource bundle is required to meet different countries’ needs. More details on the resource bundle definition for our case study can be found in Section 4.2.10.
Once the unitary resource has been defined, it is necessary to find the conversion factors that allow the derivation of the relative amount of key resources per bundle. The conversion factors will depend on the specific characteristics of each country’s immunization network logistics, such as vehicle types used and cold box sizes. Table 4 shows a summary of the conversion factors necessary to derive the amount of resources in each bundle.
Table 4: Resource bundle parameters
Input variable Unit
𝑉 Number of cold boxes per vehicle
𝑉𝑒 Maximum number of employees per vehicle
𝑉 Number of doses per cold box
𝑃𝐸 Employee productivity in outreach operation [Doses/employee.day]
The key takeaway from this section is the importance for the model to allow flexible sizes of outreach operations. This was accomplished through the modelling of their outreach site capacity through resource bundles. These bundles can be seen as packages of the key resources needed in each operation (nurses, vehicles, and vaccines). The decision on what aspects to consider inside the resource bundle may vary depending on each country’s specific characteristics.
3.2.3 Final model formulation
In this section, we presented the entire mathematical formulation of the problem. We defined sets, variables parameters, objective function and constraints.
3.2.3.1 Sets
Our network problem consists of three types of nodes, the fixed health centers, outreach sites and discrete populations. Their naming follows the same convention used in the toy model and is reproduced as follows:
F = set of fixed health centers f O = set of potential outreach sites o J = set of population in regions j 3.2.3.2 Variables
The variables are the mathematical representation of the decision being made by the model. There are three key decisions in the final model: (1) which facilities will be responsible for each population; (2) how many doses will be supplied to each population region; and (3) how many resource bundles will be sent from each health center to each outreach site. The decision of sending bundle quantity to an outreach site indirectly defines whether the candidate location is used or not. Figure 3 illustrated how each of these variables is positioned in the network flow.
1. Variables (already in toy model):
𝑋 = number of doses administrated to population in region j by fixed health centers f [Continuous]
𝑋 = number of doses administrated to population in region j by outreach site o, [Continuous]
𝑌 = control if there are any people from region j vaccinated by fixed health center f, [binary]
𝑌 = control if there are any people from region j vaccinated by outreach site o, [binary] 2. New Variables:
𝑋 = Total number of resource bundles sent from fixed health center f to outreach location o [integer]
Figure 3: Illustrative representation of the model variables 3.2.3.3 Parameters
The parameters used for constraints and objective function formulation are presented below and are grouped in four categories. The model incorporates a demand that varies depending on the distance that each patient of region j is to its service sites. From this perspective, the total demand of a region j, 𝐷 , initially a property of the node, can be converted to a arch demand , 𝑑 or 𝑑 ,
though its multiplication to a percentage vaccination coverage factor, 𝛼 or 𝛼 , that decreases as the distance between region j to the outreach site o or health center f increases. A more detailed explanation of the demand modelling is presented in Section 3.2.3.7.
1. Fixed health centers
𝑃𝐸 = Daily employee productivity at health center f [doses/day] 𝐶𝐸 = Employee cost per day at fixed health center f [ $/day] 2. Demand
𝛼 = vaccination coverage factor between fixed health center f to region j 𝛼 = vaccination coverage factor between outreach site o to region j 𝐷 = total demand for immunization, number of doses, in region j
𝑑 = demand for immunization, in number of doses, that outreach facility o can capture in region j
3. Resource bundle (outreach)
𝑃𝐸 = Daily employee productivity at outreach o [doses/day] 𝑉 = Average number of doses per cold box
𝑉𝑒 = Maximum number of employees per vehicle 𝑉 = Maximum number of cold boxes per vehicle 𝑐 = Total resource bundle cost
𝑉 = Number of doses per resource bundle
𝐶𝐸 = Employee cost per day at outreach site o [$/day] 𝐶 = Vehicle operation cost [$/km]
Dist = Road distance between f and o [km] 4. General
𝑐 = Total cost to have vaccines available at health centers [$/dose] 𝐵 = total available budget [$]
3.2.3.4 Objective function and cost equation
Our objective function is to maximize the total amount of doses distributed which will, consequently, increase our vaccination access levels. The total amount of doses is obtained through the sum of the doses distributed from fixed health centers 𝑋 plus the ones from outreach sites 𝑋 (Equation 1). 𝑚𝑎𝑥 ∈ 𝑋 + ∈ 𝑋 ∈ (1)
The most complex constraint, Equation 2, in our modelling is the budget. Due to the complexity of the cost equation, In order to simplify its explanation the total cost was broken down
into three factors: (A) the vehicle operation costs; (B) the vaccination cost at fixed health centers; and (C) the vaccination cost at outreach sites.
A B C 𝑋 ∈ ∗ 𝑐 + ∈ 𝑐 ∗ ( 𝑋 + 𝑋 ) ∈ ∈ + 𝑋 ∗ 𝐶𝐸 𝑃𝐸 + ∈ 𝑋 𝐶𝐸 𝑃𝐸 ∈ ≤ 𝐵 ∈ (2)
A. Resource bundle costs
The first cost component of the budget constraint refers to the cost of sending the resource bundles. As previously defined, each resource bundle in our scenario will be equal to one vehicle. The total cost of the resource bundles will be equal to the number of resource bundles sent, 𝑋 , multiplied by the unitary resource bundle cost.
For our case study application, the key resources inside a bundle unit are: (1) vehicle; (2) direct labor used on outreach; and (3) the vaccines doses.
The vehicle operation costs are given by the multiplication of the vehicle operation cost per km, 𝐶 , by the distance between each fixed health center f and the outreach site o, Dist . For the staff costs in the outreach, is assumed that each vehicle must always have a
minimum of one employee. This minimum amount will incur a cost that is accounted by the single term, 𝐶𝐸 , inside cost Equation 2.A. Since each vehicle might transport more
employees than only the assumed minimum, the cost of the additional employees, proportional to the vaccination needs and their productivity, are included in the third component of the cost equation (2.C). If the minimum quantity was not set, then in scenarios of very low demand, where staff requirements are less than one, the staff costs would be artificially smaller than the reality. The tradeoff of setting this minimum quantity is the fact that, at some circumstances, the planning of staff requirements will be considering that there will be one employee that is not directly involved in the vaccination need, which can actually be a pretty reasonable assumption. If, for example, the staff requirements for vaccination is of 1.3 employees, the total cost will be of 2.3 employees. This a
reasonable conservative simplification, since the employee productivity is often a difficult number to precise.
The costs of the vaccine doses used in outreach sites are accounted for in the second component of the cost equation (2.B).
𝑐 ∗ ∈ 𝑋 ∈ Where: 𝑐 = 𝐶 x 𝐷𝑖𝑠𝑡 + 𝐶𝐸 (2.A)
B. Cost of vaccines doses
The cost of having the vaccination network divided by the number of doses should give the cost per dose 𝐶 . This should represent the total purchase cost + the total logistic costs
(transportation, storage, and spoilage) to have the vaccine available at the health centers, excluding the last-mile distribution (outreach trips) and the direct labor used to administer each vaccine.
𝐶 ( 𝑋 + 𝑋 )
∈
∈
(2.B)
C. Cost of direct labor for vaccine administration
The direct labor costs for the vaccination can be calculated by multiplying the daily costs of an employee by the total amount of employees required to administer the doses. The number of employees required is obtained by dividing the number of doses 𝑋 by the employee
productivity 𝑃𝑒. 𝑋 ∗ 𝐶𝐸 𝑃𝐸 + ∈ 𝑋 𝐶𝐸 𝑃𝐸 ∈ ≤ 𝐵 ∈ (2.C) 3.2.3.5 Constraints
Looking at a high level, the final model formulation has only three other constraints in addition to the budget, presented in the previous section: (1) the amount of doses distributed must be lower than the demand possible to capture by each facility, given a certain demand function
shape; (2) the vaccination capacity of an outreach site is limited by the resource bundles; and (3) single sourcing constraint, which means each population is served by only one facility.
1. Demand constraint
Demand constraints control that the number of doses distributed to region j from a fixed health center f or outreach site o must be lower than the amount of demand that these facilities can capture in each region. Details on how to convert the total demand for vaccines of a region j, 𝐷 , in an arch demands 𝑑 , and 𝑑 can be found in Section 3.2.3.7. The equations for demand
constraints, (3) and (4), are simply the multiplication of the arch demand by the binary variable Y that determines whether that population center is fulfilled by the respective facility or not. Endogenous demand functions
𝑋 ≤ 𝑑 ∗ 𝑌 ∀ f ∈ F, ∀ j∈ J (3)
𝑋 ≤ 𝑑 ∗ 𝑌 ∀ o ∈ O, ∀ j∈ J (4)
2. Resource bundle constraint – Outreach size operations
The following constraint guarantees that the amount of vaccines administered at each outreach site does not exceed the capacity of vaccines of each resource bundle.
𝑋 ∗ 𝑉𝑝 ≥ 𝑋 ∀ o ∈ O (5)
This is a generic constraint under which the key factor of the equation 𝑉 , the number of doses per bundle unit, will depend on how the resource bundle is defined. For the case application of this project, it was defined that each resource bundle would be represented as a vehicle; more information is presented in Section 4.2.10.
Given the resource bundle definition, it is possible to break down Equation 5 into two sub-equations, 5.1 and 5.2. Assume that each vehicle can carry a maximum 𝑉𝑒 number of employees, and that each employee will be considered to have an average productivity at the outreach of 𝑃𝐸 doses per day. Based on that, and assuming each outreach trip must start and end in the same day, it is possible to say that with the available employees in each vehicle the number of doses per
resource bundle cannot exceed 𝑃𝐸 x 𝑉𝑒 doses per day. Consequently, the aggregated human resources constraint can be given by Equation 5.1.
𝑋 ∗ 𝑃𝐸 ∗ 𝑉𝑒 ≥ 𝑋 ∀ o ∈ O (5.1)
A similar approach is taken to calculate the maximum vaccination capability at an outreach due to vehicle transportation capacity for the vaccine doses. In this case, each cold box has a maximum number of doses per unit 𝑉 and each vehicle has a maximum number of cold boxes it can fit 𝑉 . The vehicle capacity constraint in terms of vaccine doses is given by Equation 5.2.
𝑋 ∗ 𝑉 ∗ 𝑉 ≥ 𝑋 ∀ o ∈ O (5.2) 3. Single source constraint
The last constraint, presented in Equation 6, guarantees that each population region j is serviced by one and only one facility. This constraint is important to guarantee that the total flow of vaccine dose for region j do not exceed the rejoin total demand, 𝐷 .
𝑌 + ∈ 𝑌 ∈ ≤ 1 ∀ j ∈ J (6)
3.2.3.6 Limiting the amount of resource – Potential model modification with additional constraints
The introduction of the resource bundle concept allows for great flexibility in modifying the model according to the scenario and the reality of each use-case situation. The addition of
constraints to the model to control the amount of resources available can be easily done with the application of correlation factors between the number of doses applied and productivity factors.
Some examples of new potential constraints that could be incorporated are presented below, but they were not included in our model case study application.
If the maximum number of workers in a specific health center f, 𝐴𝑒 , is a known hard constraint, the following equation could be incorporated to the model.
𝑋
𝑃𝑒 ≤
∈
𝐴𝑒 ∀ f ∈ F (7)
Where:
𝑃𝑒 = Employee productivity [doses per day] 𝐴𝑒 = Available employees at location f 2. Limit the number of vehicles from location f
If the maximum number of vehicles available in a specific health center f, 𝐴𝑣 , is a known hard constraint, the following equation could be incorporated to the model.
𝑋 𝑉 . ≤
∈
𝐴𝑣 ∀ f ∈ F (8)
Where:
𝑉 = Number of vehicles per resource bundle (equals to 1 in our application) 𝐴𝑣 = Available vehicles at location f
3.2.3.7 Endogenous demand functions
It is one of the objectives of our model to incorporate an endogenous demand function. Based on our literature review and wide agreement, we assume that the demand that a fixed health center f can capture from population center j, 𝑑 , would decrease as the distance between f and j increases. This captures the effect that people would be less willingly to participate in immunization services as the location for immunization becomes further away to them. Mathematically, this can be formulated by multiplying the demand 𝐷 by factor 𝛼 , as shown in Equation 9. This factor, called a vaccination coverage, is a function of the distance between f and j, 𝛼 = f (𝐷𝑖𝑠𝑡 ). The same logic can be extended for outreach sites, as Equation 10 shows.
𝑑 = 𝐷 ∙ 𝛼 ∀ j ∈ J, ∀ f ∈ F (9)
𝑑 = 𝐷 ∙ 𝛼 ∀ j ∈ J, ∀ o ∈ O (10)
The key question is what the shape of the function 𝛼 = f (𝐷𝑖𝑠𝑡 ) is. As we showed in our literature review, there is no consensus on what the shapes and coefficients of such function should be, and the derivation of a demand function for a specific country requires a lot of detailed data. However, the literature review allowed us to arrive at reasonable estimated numbers, boundaries on which it would be reasonable to test our model. In Section 4.2.4, we detail the three shapes tested in our use case and later, in Section 5.1, the model sensitivity to the different shapes is evaluated.
Regardless of the shape of the function—linear, exponentiation, or polynomial decay—the applicability of the Equations (9) and (10) remains. For the sake of illustration, Equations (11) and (12) show how a linear decay would be, assuming a decrease of 20% every 100 km.
𝛼 = 100% − 20% ∙ 𝐷𝑖𝑠𝑡
100 ∀ j ∈ J, ∀ f ∈ F (11) 𝛼 = 100% − 20% ∙ 𝐷𝑖𝑠𝑡
100 ∀ j ∈ J, ∀ o ∈ O (12)
In order to further explain how Equations 9to 12are applied in practice, Figure 4 illustrates an example of the potential demand captured by a fixed health center with regard to two distinct population centers. In this example, fixed health center f1 is at a distance of 𝐷𝑖𝑠𝑡 = 200 km to population in Region 2 and at a distance 𝐷𝑖𝑠𝑡 = 300 km to population in Region 3. By applying Equation 11, it is possible to derive that demand factors will be 𝛼 = 60% and 𝛼 = 40%. Since the total demand in the two regions is the same (𝐷 = 𝐷 = 500), it is possible to substitute this value and the demand factors in Equation 9 to arrive at the final demands for immunization in the arches 𝑑 = 300 and 𝑑 = 200.
With the incorporation of the demand function shown in this section, the demand becomes a property of the arch and not the node, as it is typically represented in network optimization problems. In our case, it means that the amount of demand for immunization that one region may
request will depend on how close it is to the immunization center selected by the optimization to serve this region.
Figure 4: Example of distance effect on demand
4 Case study of The Gambia - Final model application
One of the objectives of this project is to validate the developed optimization model in a real case scenario. UNICEF provided us with immunization data from The Gambia, which was used to validate the effectiveness of our model to provide useful insights in a real-world context and the applicability of our solution procedure.
This chapter is organized as follows: First, in Section 4.1, we presented an overview of The Gambia’s current vaccination network and define the scope of our analysis. After that, in Section 4.2, we described an extensive list of how all necessary inputs to the model were derived. To solve the model, a Python code in Jupyter Notebook was created; details of the solution procedure are shown in Section 4.3. Finally, in Section 4.4, the baseline scenario is created and optimization scenarios are defined.
In this chapter, simplifying assumptions were made when deriving the input data for our model. Some of these assumptions may seem simplistic. However, our main objective with this