HAL Id: tel-01141873
https://pastel.archives-ouvertes.fr/tel-01141873
Submitted on 14 Apr 2015HAL is a multi-disciplinary open access
archive for the deposit and dissemination of sci-entific research documents, whether they are pub-lished or not. The documents may come from teaching and research institutions in France or abroad, or from public or private research centers.
L’archive ouverte pluridisciplinaire HAL, est destinée au dépôt et à la diffusion de documents scientifiques de niveau recherche, publiés ou non, émanant des établissements d’enseignement et de recherche français ou étrangers, des laboratoires publics ou privés.
using aerogel-based insulating mineral rendering
Mohamad Ibrahim
To cite this version:
Mohamad Ibrahim. Improving the buildings envelopes energy performance using aerogel-based insu-lating mineral rendering. Civil Engineering. Ecole Nationale Supérieure des Mines de Paris, 2014. English. �NNT : 2014ENMP0043�. �tel-01141873�
MINES ParisTech
Centre Procédés, Energies Renouvelables et Systèmes Energétiques (PERSEE)
1 rue Claude Daunesse, 06904 Sophia Antipolis, France
T
T
H
H
E
E
S
S
E
E
École doctorale n° 432 : Sciences et Métiers de l'Ingénieur
présentée et soutenue publiquement par
Mohamad IBRAHIM
Le 19 Décembre 2014
Improving the building envelopes energy performance
using aerogel-based insulating mineral rendering
Etude de l’amélioration de la performance énergétique de
bâtiments due à l’emploi d’enduit minéral à fort pouvoir isolant
Doctorat ParisTech
T H È S E
pour obtenir le grade de docteur délivré par
l’École nationale supérieure des mines de Paris
Spécialité “
Énergétique
”
Directeurs de thèse : Patrick ACHARD et Etienne WURTZ
T
H
È
S
E
JuryMme Monika WOLOSZYN, Professeur, Université de Savoie Rapporteur
M. Olaf ADAN, Professeur, Technische Universiteit Eindhoven Rapporteur Mme Evelyne PRAT, Docteur, Directeur R&D, Société Parex Group Examinateur M. Daniel QUENARD, Docteur, Responsable Division Enveloppes et Matériaux innovants, CSTB Examinateur M. Pascal Henry BIWOLE, Maitre de conférence, Université de Nice Sophia Antipolis Examinateur
M. Etienne WURTZ, Directeur de Recherche CNRS, CEA/INES Examinateur
iii
v First and foremost, I want to express my sincere gratitude to my advisors Pr. Patrick ACHARD and Pr. Etienne WURTZ for the help and dedicated support during the past three years. It has been an honor to be their Ph.D student. Without their help and encouragement, this work would not have been achieved.
I would like to thank Dr. Pascal H. BIWOLE for all his valuable contribution and for being a member of my thesis committee.
I would also like to express my appreciation and my thanks to Pr. Monika WOLOSZYN, Pr. Olaf ADAN, Dr. Evelyne PRAT, and Dr. Daniel QUENARD for their advice and constructive criticism and for reviewing my thesis as members of my thesis committee.
I would like to acknowledge the support and help of all the colleagues and all the staff members of the PERSEE research center at Mines ParisTech. I would like also to thank all the members at the National Solar Energy Institute (INES) for their help, support, contribution, and valuable discussions. I was really fortunate to have worked in these two professional and friendly environments, Mines ParisTech and INES.
Many thanks to all the partners of PAREX.it project: Parex Group, ARMINES, CEA, LOCIE, CSTB, PCAS, and Wienerberger, with special thanks to the FUI financial support and the financial support of PAREX group.
Special thanks go to my friends who supported me during all the period of my study.
Last but not least, I would like to express my deepest gratitude to my parents and my brothers for the continuous support and encouragement during all my studies.
vii
Acknowledgement v
Contents vii
Nomenclature ix
List of Figures xiii
List of Tables xix
General Introduction ………... 1
Résumé de l'introduction en Français……… 6
Chapter 1: Background on Building Construction, Aerogel-Based Insulation, Energy Modeling and Simulation………...9
1. Buildings: Complex Dynamic Systems ... 13
2. Building Construction and Energy Performance Evolution ... 20
3. Aerogel-Based Insulating Materials: Building Applications ... 27
4. Building Energy Mathematical Models ... 34
5. Whole Building Energy Simulation Tools ... 38
6. Résumé du Chapire en Français ... 44
Chapter 2: Heat and Mass Transfer Theoretical Modeling Applied to Wall Covered with Aerogel-Based Coating………..49
1. Introduction ... 53
2. Multi-layer Wall One-Dimensional Heat Transfer Model ... 53
3. Multi-layer Wall Two-Dimensional Heat Transfer Model ... 59
4. Multi-layer Wall One-Dimensional Hygrothermal Model ... 66
5. Whole Building Energy Model ... 71
6. Multi-layer Wall with Active Loop System Model ... 74
7. Conclusion ... 80
8. Résumé du Chapitre en Français ... 81
Chapter 3: Advanced Building Envelopes Experimental Studies……….………..85
1. Introduction ... 89
2. PERSEE Test-Cell Wall Characterization ... 89
viii
6. Résumé du Chapitre en Français ... 124
Chapter 4: Advanced Building Envelopes Simulation Results and Discussion………...129
1. Introduction ... 133
2. Exterior Walls’ Thermal Performance ... 133
3. Exterior Wall’s Hygro-Thermal Performance ... 141
4. Thermal Bridge Heat Losses Treatment ... 150
5. Energy Load and Thermal Comfort Analysis... 160
6. Wall Active Loop System Performance ... 178
7. Conclusion ... 189
8. Résumé du Chapitre en Français ... 190
General Conclusion and Perspectives ………....195
Résumé de la conclusion en Français……….200
References………...203 Annexes……….……..219 Résumé………....234 Abstract………...234
ix Latin Letters
Notation unit significance
A m² area
ach h-1 air changes per hour CC - cloudiness coefficient CS € cost savings
cp J/(kg.K) specific heat
D m diameter
kg/(m.s) liquid conduction coefficient f - decrement factor
F - view factor
h W/(m².K) heat transfer coefficient J latent heat of vaporization
H J enthalpy
HDD deg.day heating degree day I W/m² solar irradiation k W/(m.K) thermal conductivity
̇ kg/s mass flow rate Nu - Nusselt number
N year lifetime
Pa pressure
PP year payback period Pr - Prandtl number Q J energy consumption q W/m² heat flux R (m²K)/W thermal resistance Re - Reynolds number r m radius r - solar reflectivity T K temperature
x v m/s velocity V m3 molume w kg/m3 moisture content x, y, z m spacial coordinates Greek Letters
Notation unit significance
- solar absorptivity
kg/(m² s Pa) water vapour transfer coefficient
kg/m3 density kg/(s3 K4) Stefan-Boltzmann constant - relative humidity h time lag % efficiency - emissivity
kg/(m s Pa) Water vapour permeability
- Solar transmissivity
s time step
m thickness
xi Notation significance a air abs absorber c convective cv Control volume dp dew point e east f fluid g glass gr ground h heating i , j node position in inside l layer n north
MRT Mean radiant temperature mm Mean monthly out outside r radiative rm Running mean s south sat saturation w water w west
xii
Notation significance
ABC Aerogel-Based Coating – In all the manuscript, we use the word “coating” to refer to a “rendering” or a “mortar” having a certain thickness C concrete
CR Condensation risk cH Continuous heating DR Dryness rate
EPS Expanded polysyrene GW Glass wool HB Hollow blocks iH Intermittent heating MG Mold growth N north nH No heating
PWF Present worth factor R Rain (driving rain) SW South-west
SHGF Solar heat gain coefficient TCI Thermal comfort index WALS Wall active loop system 1D (2D) One (two)-dimensional
xiii
Fig. 1.1: Examples of heat exchange processes between a building and the environment ... 13
Fig. 1.2: Time lag and decrement factor ... 16
Fig. 1.3: Adaptive thermal comfort region according to ASHARE Standard 55 ... 19
Fig. 1.4: Adaptive thermal comfort region according to EN Standard15251 ... 20
Fig. 1.5: Number of housing units in France per climatic region (source: FILOCOM 2009, taxe d’habitation) ... 21
Fig. 1.6: Household energy use per capita (source: IEA 2007, Energy Use in the New Millennium -Trends in IEA Countries) ... 21
Fig. 1.7: Traditional houses before World War 2 ... 22
Fig. 1.8: Prefabricated houses ... 23
Fig. 1.9: Houses after 1974 ... 23
Fig. 1.10: Aspen aerogel insulation for retrofitting of an old brick dwelling ... 28
Fig. 1.11 : A thermographic image of a timber wall where the studs of the top floor are insulated with a thin layer of aerogel insulation whereas the ground floor is not ... 28
Fig. 1.12: Cross-section through the granular aerogel based glazing ... 29
Fig. 1.13: cross-section of the monolithic aerogel based evacuated glazing ... 30
Fig. 1.14 : Thermal conductivity of today’s insulating plasters and the aerogel plaster ... 32
Fig. 1.15 : The new aerogel-based insulating coating (rendering) ... 32
Fig. 1.16: Loose coupling - successive program runs (source: Tian and Zuo 2013) ... 42
Fig. 1.17: Loose coupling - parallel program runs (source: Tian and Zuo 2013) ... 42
Fig. 1.18: Strong coupling (source: Tian and Zuo 2013) ... 43
Fig. 2.1 : Wall layer discretization ... 56
Fig. 2.2 : 1D heat transfer model comparison with analytical solution ... 59
Fig. 2.3: Wall structure of length L and width W ... 61
Fig. 2.4: Typical control volume ... 62
Fig. 2.5: Analytical solution at the grid points for ISO 10211 standard test case 1 ... 64
Fig. 2.6: Geometry and boundary conditions for ISO 10211 standard test case 2 ... 64
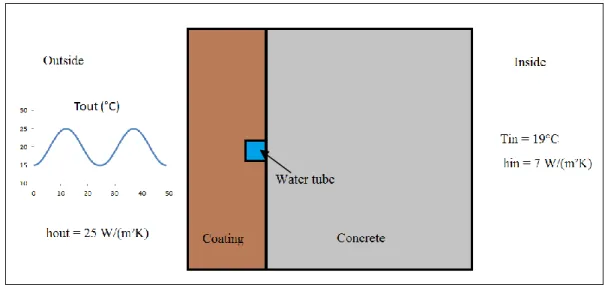
Fig. 2.7 : Comparison with HEAT2, calculation domain and boundary conditions ... 65
Fig. 2.8: Comparing the heat flux (q) across the bottom and left boundaries between HEAT2 and MATLAB code... 66
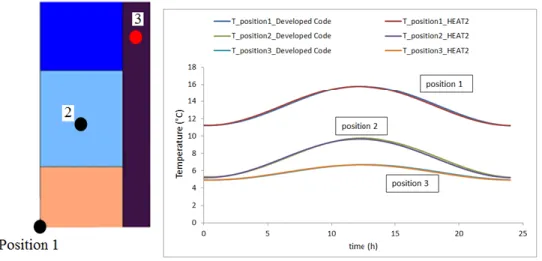
Fig. 2.9 : Comparing the temperature variation for 3 arbitrary chosen positions between HEAT2 and MATLAB code... 66
Fig. 2.10: Control volume with left and right neighbors ... 69
xiv
Fig. 2.14: South wall face view (left) and section view of one calculation domain segement (right) ... 76
Fig. 2.15: Comparison of wall active loop system numerical model with HEAT2 ... 78
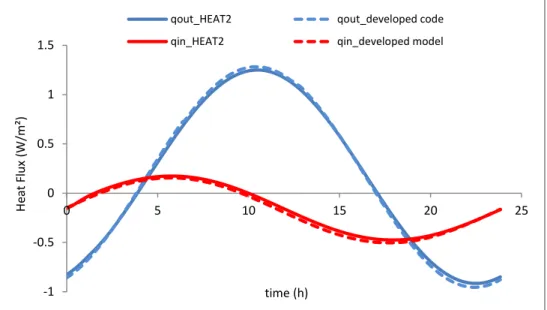
Fig. 2.16: Heat flux at the interior (qin) and exterior (qout) wall surfaces for the developed code and HEAT2 ... 79
Fig. 2.17: Water temperature (Tw) comparison between the developed code and HEAT2 ... 79
Fig. 3.1 : PERSEE experimental test-cell in Sophia Antipolis ... 90
Fig. 3.2 : Measurement sensors within the south wall... 92
Fig. 3.3: Measured outside air temperature (Tout), inside air temperature (Tin) and south wall solar irradiation (I_south) for two weeks in August ... 93
Fig. 3.4: Measured and simulated (with and without sky long-wave radiation “LWR”) outside surface temperature (Tse) ... 93
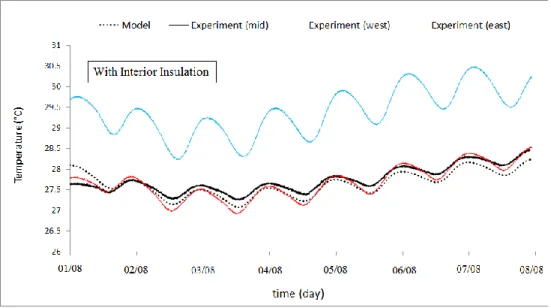
Fig. 3.5: Variation of the south inner wall surface temperature for different internal convection coefficients ... 94
Fig. 3.6 : Measured and simulated temperatures at the interface aerogel-based coating/concrete ... 95
Fig. 3.7 : Measured and simulated temperatures at the interface concrete/interior insulation ... 95
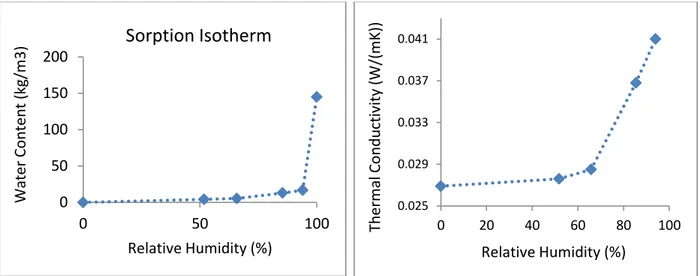
Fig. 3.8: Aerogel-based coating sorption curve and its thermal conductivity in dependence on relative humidity ... 97
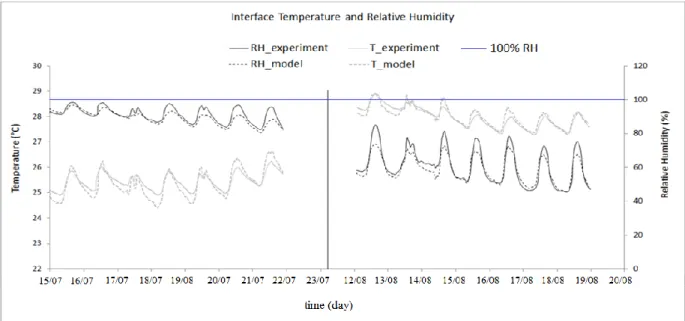
Fig. 3.9 : Measured outside (a) and inside (b) air temperature and relative humidity ... 98
Fig. 3.10: Measured and simulated temperature and relative humidity at the interface coating/concrete .. 99
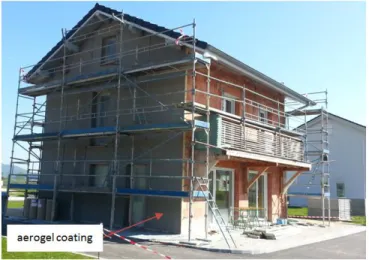
Fig. 3.11 : INES experimental platform and the experimental test house (in the red square) ... 100
Fig. 3.12: Brick-monomur ... 100
Fig. 3.13: The experimental test house while the aerogel-based coating being applied on its exterior facades ... 101
Fig. 3.14: The experimental test house construction materials ... 101
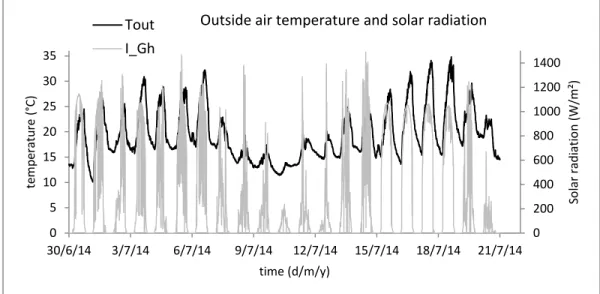
Fig. 3.15: Outside air temperature and solar radiation for the test period (case: no coating) ... 104
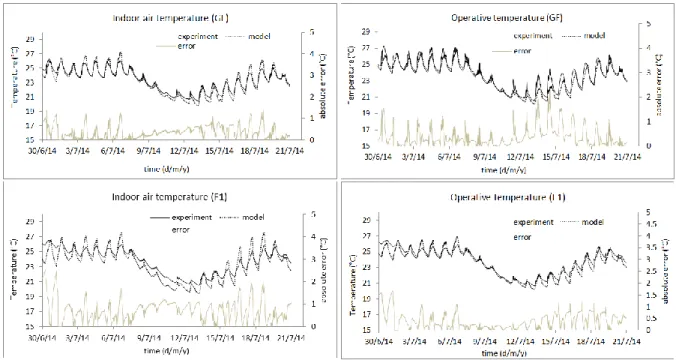
Fig. 3.16: Indoor air and operative temperatures for the GF and F1 (case: no coating) ... 105
Fig. 3.17: Outside air temperature and global horizontal solar radiation for the test period (case: with coating) ... 106
Fig. 3.18: Indoor air and operative temperatures for the GF and F1 (case: with coating)... 107
Fig. 3.19: Variation of the ground floor's indoor air temperature for different window's solar heat gain coefficients, (b) for different ground reflectivity values, (c) for different ventilation rates, and (d) with increased indoor thermal inertia ... 109
Fig. 3.20: North wall temperature comparison between model and experiment ... 110
Fig. 3.21: The experimental mock-ups: the test-case with the fluid pipes and the reference case without the pipes (Note: this figure is before applying the coating on all the facades)... 113
Fig. 3.22: Fluid pipes position in the south facade (left) and north facade (right) ... 113
xv
Fig. 3.25: South wall exterior surface temperature for the test and reference cases ... 116
Fig. 3.26: Inside air temperature for the test and reference cases ... 117
Fig. 3.27: Inlet and outlet fluid temperature of the south facade and the collected heat flux... 118
Fig. 3.28: South wall inner surface temperature for the test and reference cases ... 119
Fig. 3.29: South wall fluid inlet (a) and outlet (b) temperatures ... 121
Fig. 3.30: South and north inner surface temperature of the experimental and simulation results and the corresponding error ... 122
Fig. 3.31: Inside air temperature comparison between the experiment and the numerical model ... 123
Fig. 4.1: Outside air temperature and solar radiation used in the simulation ... 134
Fig. 4.2: Time lag and decrement factor for different insulation types and configurations for concrete walls (cH) 136 Fig. 4.3: Time lag and decrement factor for the different configurations for concrete, hollow blocks, and brick-monomur when using the coating as the insulation material (cH) ... 137
Fig. 4.4: Daily heat losses in W/m² for the different wall configurations (iH) ... 138
Fig. 4.5: Inside wall surface temperature during the whole day for some insulation configurations (iH) 139 Fig. 4.6: time lag and decrement factor for different insulation types and configurations for concrete walls (nH) 140 Fig. 4.7: Thermal comfort index for all the wall structures (nH) ... 140
Fig. 4.8: Indoor air temperature and relative humidity calculated according to EN 15026 standard ... 142
Fig. 4.9: Exterior air temperature and relative humidity over one year for the city of Grenoble ... 143
Fig. 4.10: Evolution of the total water content over the 4 years for W-2, W-4, and W-6 for the north orientation ... 145
Fig. 4.11: Dryness rate (DR) for the different walls ... 146
Fig. 4.12: Isopleths for (a) the un-insulated wall "W-1" and (b) 10cm exterior coating for the north and driving rain orientations ... 148
Fig. 4.13: Percentage of the total number of averages that each wall failed the ASHRAE-160 criterion. 149 Fig. 4.14: Relative humidity (over 4 years) and temperature (over 1 year) at the interface concrete/internal insulation for W-2, W-6, and W-8... 149
Fig. 4.15: Heat Losses at the internal wall surface for the different configurations ... 150
Fig. 4.16: Top view of the thermal bridge ... 151
Fig. 4.17: Coupling EnergyPlus to MATLAB through BCVTB ... 152
Fig. 4.18: Boundary conditions for MATLAB model ... 153
Fig. 4.19: Windows offset thermal bridge load percentage of the total heating load of the house (case1) 154 Fig. 4.20: Comparing the annual thermal bridge heating load with and without the coating (case1) ... 155
Fig. 4.21: Windows offset thermal bridge load percentage of the total heating load of the house (case2) 156 Fig. 4.22: Different positions in the wall to calculate the time lag and decrement factor ... 157
xvi
Fig. 4.26: Equipment load schedule for ground and first floors for week days and weekends ... 163
Fig. 4.27: Energy load versus ABC thickness power curve fit ... 164
Fig. 4.28: Annual heating load for the different climates and the different construction periods with and without the coating [(1) and (2) represent different construction techniques within the same period] ... 165
Fig. 4.29: Heating load as a function of the coating thickness for different interior insulation thicknesses 166 Fig. 4.30: Percentage of occupied time where heating is not needed and its degree.hour for different coating thickness and different climates (old house)... 167
Fig. 4.31: Percentage of occupied time where heating is not needed its degree.hour for different coating thicknesses and different climates (new house) ... 168
Fig. 4.32: The percentage of occupied time where overheating will probably occur according to (a) EN 15251 adaptive comfort model and (b) ASHRAE 55 adaptive comfort model for different levels of satisfaction (old house) ... 169
Fig. 4.33: The percentage of occupied time where overheating occurs for a new house having (a) no interior insulation, (b) 5cm interior insulation, and (c) 10cm interior insulation ... 172
Fig. 4.34: Percentage of discomfort time for different night ventilation rates for a new house in a Mediterranean climate ... 172
Fig. 4.35: Aerogel-based coating, heating, and total costs for the different climates ... 175
Fig. 4.36: Effect of present worth factor on the optimum coating thickness... 177
Fig. 4.37: Effect of the coating cost on the optimum thickness ... 177
Fig. 4.38: Effect of the heating set-point on the optimum coating thickness ... 178
Fig. 4.39: EnergyPlus and MATLAB Co-simulation through BCVTB ... 179
Fig. 4.40: Inner wall surface temperature resulting from EnergyPlus (E+) standalone and from the coupling strategy. ... 180
Fig. 4.41: Heating load (January - Nice) for different solar radiation control values (Icontrol) ... 181
Fig. 4.42: Annual heating load for the old and new houses with and without the WALS ... 182
Fig. 4.43: Available south wall solar radiation during the period from October to April ... 183
Fig. 4.44: Percentage reduction in the annual heating load compared to the houses without WALS for (a) old houses and (b) new houses ... 184
Fig. 4.45: North wall heat losses for houses with and without the WALS, and their corresponding percentage reductions ... 185
Fig. 4.46: North wall inner surface temperature with and without the WALS, outdoor air temperature, and south wall solar radiation intensity ... 186
Fig. 4.47: South wall outlet (Tw_so) and inlet (Tw_si) water temperatures, and the pump operation strategy ... 187
Fig. 4.48: Heating load as a function of the water mass flow rate for different pipe's diameter ... 188
Fig. A1: Geometry of the Test cell in Sophia Antipolis……….221 Fig. B1 (a-e) : Experimental Test cell Hygrothermal Performance – (a) weather data and (b-e) Sensitivity of the relative humidity at the interface coating/concrete for different (b) exterior surface solar
xvii
Fig. C1: Experimental INCAS house floor plans………...225 Fig. D1: Moisture storage functions for the different materials used in WUFI simulations………..228 Fig. E1 (a-e): Rapid Assessment Tool screen shots………231
xix
Table 1.1: Houses' Construction in France during the different periods ... 26
Table 1.2: Thermo-physical properties of the new Aerogel-based Insulating Coating ... 33
Table 1.3: Thermal conductivity of some traditional insulation products (source: M. Koebel, A. Rigaccci, P. Achard, Aerogels for Superinsulation: A synoptic view, Chapter 26, p 611, in “Aerogels Handbook (2011), editors: M. Aegerter, N. Leventis, and M. Koebel”. ... 33
Table 2.1: Model comparison with the ISO 10211:2007 standard test case 1 ... 65
Table 2.2: Model comparison with the ISO 10211:007 Standard Test Case 2 ... 65
Table 2.3: Coefficients of the discretized heat and moisture transport equations ... 70
Table 3.1 : Sensitivity analysis of some parameters on the heat flux and decrement factor ... 94
Table 3.2: The aerogel-based coating vapour diffusion resistance factor ... 95
Table 3.3: Sensitivity of some input parameters on the indoor air temperature ... 108
Table 3.1 : Sensitivity analysis of some parameters on the heat flux and decrement factor ... 96
Table 3.2: The aerogel-based coating vapour diffusion resistance factor ... 97
Table 3.3: Sensitivity of some input parameters on the indoor air temperature ... 111
Table 4.1: Thermo-physical properties of all materials used in the walls under investigation ... 134
Table 4.2: Wall assembly insulation configurations ... 141
Table 4.3: Total water content criterion ... 145
Table 4.4: Condensation risk for the different wall configurations ... 147
Table 4.5: optimum coating thickness for the different climates ... 176
Table 4.6: Payback period ... 176
Table 4.7: Case study design parameters ... 181
Table A1: Test cell construction materials thermo-physical properties……….221
Table C1: INCAS house construction materials properties………226
1
3 According to experts from GIEC (Groupement International d’expert sur l’Evolution du Climat), it is almost certain that global warming observed over the past century is linked to greenhouse gas emissions produced by the human activities. To limit the aggravation of this phenomenon, the countries must reduce their greenhouse gas emissions. All business sectors are concerned, but the building sector requires a special attention because, according to a report on energy trends in buildings (Enerdata 2012), the building sector consumed about 41% of total final energy requirements in Europe in 2010. It is the largest end-use sector, followed by transport (32%), industry (24%) and agriculture (2%). The final energy consumption of buildings has increased by around 1% per year since 1990 (Enerdata 2012).
In France, the building sector is the largest consumer of energy and accounts for about 43% of the total energy consumption (ADEME 2014). This energy consumption contributes to producing around 25% of CO2 emissions. Energy consumption from the building sector has increased by about 30% over the past 30 years due to the increase in new constructions (UNEP 2012). France has already adopted the objective of reducing its energy consumption and greenhouse gas emissions by a factor of four to five by the year 2050 as a part of its national strategy for sustainable development introduced in June 2003, and it’s Climate Plan introduced in July 2004. The new thermal regulations (French RT 2012) limit the annual primary energy consumption for new buildings to 50 kWh/m2. Also, the share of renewable energy in proportion to the total energy consumption must increase from 10% (as of 2009) to 23% by 2020.
The building sector offers significant potential for improved energy efficiency through the use of high-performance insulation and energy-efficient systems. For existing buildings, renovation has a high priority in many countries, including France, because these buildings represent a high proportion of energy consumption and they will be present for decades to come. Until the year 2009, the residential building sector in France counted around 32.2 million housing units with an annual energy consumption of about 494 TWh (ADEME 2009). Several studies (Verbeeck 2005, Enkvist 2007, EEW 2013) showed that the most efficient way to curb the energy consumption in the building sector (new and existing) remains the reduction of the heat losses by improving the insulation of the building envelope. For retrofitting and even for new buildings in cities, the thickness of internal or external insulation layers becomes a major issue of concern.
4 Nowadays, there is a growing interest in the so-called super-insulating materials, such as Aerogels. The unique properties of aerogels offer many new applications in buildings. Their extraordinary low thermal conductivity as well as their optical transparency allows their use for insulating building facades and insulating window panes.
The objectives of this work are to enhance the thermal behavior and to foster energy efficiency of buildings through the use of a newly developed aerogel-based insulating coating (rendering) as well as the use of renewable energy sources, specifically solar energy. We examine the thermal behavior of buildings having the new aerogel-based insulating coating on the external facades. This includes its effect on the building’s energy load and thermal comfort for different building construction types and in various climates. We examine the effect of the coating on time lag and decrement factor for different wall types. Also, we study the effect of this coating on limiting the heat losses through thermal bridges. The impact of the coating is scrutinized not only from a thermal perspective but also from a hygrothermal one. Through the modeling of the coupled heat and moisture transfer in different wall structures, the risk of condensation and mold growth are examined. Another objective is to propose an assisting heating system to decrease the heating demand and enhance thermal comfort. We propose a system to take advantage of the solar radiation falling on the south facade and transfer this energy to the north facade through water pipes embedded in the aerogel coating.
The thesis is composed of four chapters. The first chapter starts with a brief description of the various heat transfer exchange processes between the building and its environment and some factors influencing the building’s thermal behavior. Then, we present some state-of-the-art thermal comfort models. After that, we provide a brief history on the evolution of the construction and energy performance of the houses in France since before the World War 2 till the last decade. We move to present the characteristics of a newly developed silica-aerogel-based insulating coating after showing the importance of using aerogel based materials in the building sector. This chapter ends by showing some of the mathematical models used in determining the heat flows in a building as well as presenting a few whole building energy simulation tools.
The second chapter deals with developing all the mathematical and numerical models needed for this study. It starts with modeling the one-dimensional heat transfer in a multilayer wall
5 structure. This latter is extended to model the two-dimensional heat transfer in a multilayer wall structure to examine the impact of applying the coating on thermal bridges heat losses. Also, the one-dimensional hygrothermal (heat and moisture) model is constructed using the commercial software WUFI®. To show the impact of the coating on energy load and thermal comfort, a full-scale house thermal model is built using EnergyPlus. Finally, chapter two ends with explaining the concepts of the proposed assisting heating system (wall active water loop system). The mathematical model of this system is also presented.
The third chapter deals with all experiments done to validate the different numerical models. We have conducted three experiments. The first one is a test cell located in Sophia Antipolis. The second is a full-scale two-story house located in Chambery. The third experiment (in Chambery) is related to the newly proposed assisting heating system.
Last but not least, the fourth chapter presents all the simulation results. It provides clear recommendations on the feasibility of installing this aerogel-based coating, firstly, alone and, secondly, as insulation associated with an active water loop system.
6
Résumé de l'introduction en Français
Selon une étude réalisée par les experts du Groupement International d’expert sur l’évolution du Climat (GIEC), il est devenu certain que le réchauffement climatique est lié aux émissions de gaz à effet de serre, dues aux activités humaines. Afin de limiter ce phénomène, les pays doivent diminuer de nombreuses activités qui interviennent dans l’augmentation de la concentration des gaz à effet de serre dans l’atmosphère terrestre. Tous les secteurs de métier sont concernés par cet acte, surtout le secteur de la construction des bâtiments. En effet et selon une étude publiée dans Enerdata en 2012, le domaine de la construction consomme près de 41 % de l’énergie totale requise en Europe en 2010. Ce secteur est classé en premier sur l’échelle de la consommation en énergie, devant le transport avec 32 % de consommation, l’industrie (24 %) et l’agriculture, 2%. La consommation énergétique totale par les bâtiments évolue de 1% chaque année depuis 1990 et de 2,4% pour l’électricité (Enerdata, 2012).
En France, le secteur de la construction est le plus grand consommateur d’énergie, occupant une tranche de 43% de la consommation totale énergétique (ADEME, 2014), ce qui entraine 25% des émissions de CO2. La consommation énergétique du secteur de la construction a augmenté de 30% durant ces 30 dernières années, du fait des constructions modernes (UNEP, 2012). L’objectif de la France est de réussir à réduire son taux en consommation en énergie à un facteur de 4 ou 5 en 2050. Cet objectif fait partie de la stratégie nationale pour un développement durable introduite en Juin 2003. Les nouvelles régulations thermiques adoptées limitent la consommation annuelle en énergie primaire des nouvelles constructions à 50KWh/m2 (RT 2012). De plus, ceci est conjugué avec une augmentation du recours aux énergies renouvelables, avec une part passant de 10% (2009) à 23% en 2020, par rapport à la consommation énergétique totale.
Le secteur de la construction offre un potentiel significatif pour améliorer l’efficacité énergétique en utilisant des systèmes énergétiques efficaces et une isolation de haute performance. Pour les bâtiments existants, leur rénovation est devenue une grande priorité pour certains pays, y compris la France, puisqu’ils représentent une proportion élevée de l’énergie consommée et seront présents, en termes de construction, pour le prochain siècle. Jusqu’à l’année 2009, la construction résidentielle comptait près de 32.2 millions de maisons avec un niveau de consommation en énergie annuelle qui a atteint les 494 TWh (ADEME, 2009). Des études
7 (Verbeeck 2005, Enkvist 2007, EEW 2013) ont montré que la solution la plus efficace pour contrôler la consommation énergétique du secteur de la construction (anciens et nouveaux bâtiments) est de réduire la perte énergétique en améliorant l’isolation externe installée. L’amélioration de la performance thermique courante de l’enveloppe des bâtiments est essentielle pour réduire la demande en énergie requise pour les constructions. Pour la réhabilitation et même pour les nouveaux bâtiments, l’épaisseur des couches de l’isolation externe et interne est devenue un problème. Aujourd’hui, il y a un intérêt majeur pour l’utilisation des matériaux dits super-isolants, comme les aérogels. Les aérogels présentent des propriétés uniques qui s’avèrent très intéressantes et qui doivent être prise en compte dans les nouvelles règles des constructions. En effet, avec leur transparence optique et leur très faible conductivité thermique, les aérogels peuvent être utilisés dans l’isolation des façades opaques et des parties vitrées.
L’objectif de ce travail est d’étudier l’amélioration du comportement thermique et l’économie d’énergie possible des bâtiments par l’utilisation de nouveaux enduits isolants à base d’aérogel et aussi d’ énergies renouvelables, notamment l’énergie solaire. La thèse est composée de quatre chapitres. Le premier chapitre introduit le concept de la construction et le comportement thermique. Le deuxième chapitre décrit les modèles mathématiques et numériques utilisés pour cette étude. Le troisième explique toutes les expériences qui ont été faites pour valider les modèles numériques. Enfin, le dernier chapitre présente les résultats de la simulation.
9
CHAPTER 1
B
ACKGROUND ON
B
UILDING
C
ONSTRUCTION
,
A
EROGEL
-B
ASED
I
NSULATION
,
E
NERGY
11
Chapter 1
Background on Building Construction, Aerogel-Based Insulation, Energy
Modeling and Simulation
Chapter Contents
1. Buildings: Complex Dynamic Systems ... 13 1.1. Introduction ... 13 1.2. Factors Affecting the Building’s Thermal Response... 14 1.2.1. Thermal Insulation ... 14 1.2.2. Thermal Mass Associated with Natural Ventilation ... 14 1.2.3. Solar Radiation ... 16 1.3. Thermal Comfort ... 17 1.3.1. Introduction ... 17 1.3.2. Simple Models ... 17 1.3.3. Conventional Models ... 17 1.3.4. Adaptive Models ... 18 2. Building Construction and Energy Performance Evolution ... 20 2.1. Introduction ... 20 2.2. History of Construction in France ... 22 2.2.1. Traditional Way till the World War 2 ... 22 2.2.2. Construction Strategy after the World War 2 ... 22 2.2.3. Interior Insulation: A Reaction after the Oil Crisis in 1970 ... 23 2.2.4. Exterior Insulation: The New Approach ... 24 2.2.5. Summary ... 25 3. Aerogel-Based Insulating Materials: Building Applications ... 27 3.1. Introduction ... 27 3.2. Opaque Composite Silica Aerogel-Based Materials ... 28 3.3. Translucent Silica Aerogel-Based Materials ... 29 3.4. Life Cycle Assessment ... 30
12 3.5. The New Aerogel-Based Coating ... 31 4. Building Energy Mathematical Models ... 34 4.1. Introduction ... 34 4.2. Simple Steady State Models ... 35 4.3. Dynamic Models ... 36 4.3.1. Detailed Complex Models ... 36 4.3.2. Reduced-Order Models ... 37 5. Whole Building Energy Simulation Tools ... 38 5.1. Introduction ... 38 5.2. Why do we need these tools? ... 38 5.3. Some Building Energy Simulation Softwares ... 39 5.3.1. EnergyPLus ... 39 5.3.2. TRNSYS ... 39 5.3.3. IDA ICE ... 40 5.3.4. IES VE ... 40 5.3.5. ESP-r ... 40 5.4. Co-Simulation ... 41 5.4.1. Introduction ... 41 5.4.2. Advantages of Co-simulation ... 41 5.4.3. Coupling Strategies ... 42 5.4.4. Co-simulation Platforms ... 43 6. Résumé du Chapire en Français ... 44
13
1. Buildings: Complex Dynamic Systems 1.1. Introduction
A building can be seen to be like a box, protecting its contents from climatic conditions. Its envelope acts like an exchanger, gaining and releasing heat to the environment. It is crucial to know how to design an energy efficient envelope by examining its effect on the thermal performance of the building in order to improve the comfort of its occupants while consuming as little energy as possible.
Thermal performance of buildings refers to the heat exchange processes that occur between the building and its surroundings. This enables us to estimate the cooling and heating loads of the building, and as a result, to make proper selection and sizing of the various heating, ventilation, and air-conditioning (HVAC) systems needed to maintain thermal comfort during air-conditioning periods. For non-air-conditioned spaces, this would allow us to calculate the indoor air and operative temperatures which help estimate the duration of uncomfortable periods.
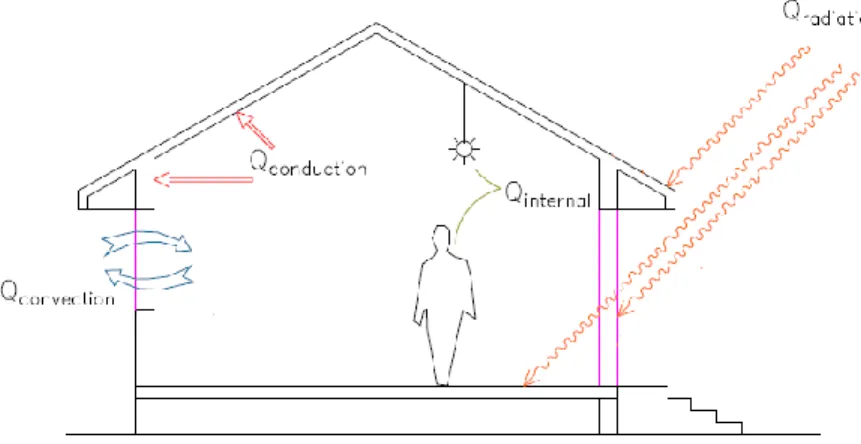
Heat is exchanged between the building and its surrounding environment through different means (Fig. 1.1). One way is heat conduction through the walls, roofs, floors, etc. Another way is convection from different surfaces. Solar radiation is absorbed by the building internal surfaces after penetrating through windows. Also, heat is added to the space from the various internal sources such as occupants, lights, equipment, etc. Air flow from or to the space through infiltration and ventilation contributes to bringing or removing heat.
14
1.2. Factors Affecting the Building’s Thermal Response
Many factors affect the thermal performance or response of a building. Among these are: thermal insulation, thermal mass associated with natural ventilation, and solar gains.
1.2.1. Thermal Insulation
According to Cadiergues (1986), a well-insulated wall reduces the heat losses to the outside during the cold season and reduces the transmitted heat to the inside during the day in the hot season. It also prevents condensation in the wall through avoiding the too low temperatures. Besides, it improves thermal comfort by preventing the too hot or too cold thermal sensation near the walls due to radiative exchange.
On the other side, a well-insulated envelope may lead to overheating in hot summers where the absorbed solar radiation during the day (entering through windows) may be trapped inside without being able to be released to the outside.
The position of insulation plays an important role in the dynamic thermal behaviour of exterior walls. Different construction types exist:
insulation at the outside wall surface
insulation at the inside wall surface
insulation at the middle of the wall
insulation is distributed within the wall structure
Generally, insulation materials are not dense; thus, they cannot store a large amount of heat per unit volume. This leads to fast response to the imposed driving forces. Tsilingiris (2006) showed that for intermittently conditioned spaces, the thermal insulation performs better when installed at the interior wall side. Due to its low thermal capacitance, when the heating cycle begins, there is a rapid increase of room temperature up to the desired thermostat setting level. Conversely, Kossecka and Kosny (1998) showed that for a continuously heated and/or cooled building, the best solution from an energy point of view is placing insulation at the exterior wall surface.
1.2.2. Thermal Mass Associated with Natural Ventilation
During the winter season, thermal inertia absorbs and stores the excess heat due to solar radiation during the day and releases it at a later time in the night when it gets colder outside.
15
During summer nights, when the outside air temperature is lower than the temperature inside the building, it is possible to apply natural ventilation. The ventilated air promotes convection and dissipation of the heat stored in the envelope to the outside. This strategy allows reducing the peak energy loads of the building; thus, reducing the required size of the HVAC system. In the non air-conditioned buildings, it helps to dampen strong fluctuations of the exterior temperature and to maintain the inner surface temperatures fairly at a constant temperature irrespective of fluctuating outer surface temperature. Also, thermal mass can delay the heat penetrating into the indoor space to a later time more desirable for occupants.
However, the improvement of summer thermal comfort by adopting thermal inertia and natural ventilation depends on the climate. The contribution of thermal inertia varies greatly depending on the nature of the external stresses cycles to which the building is subjected (Givoni 1994, Roucoult 1999).
Two parameters are defined: time lag and decrement factor (Fig. 1.2). Time lag is the time it takes for the heat wave to propagate from the outer surface to the inner surface of the wall and the decrement factor is the decreasing ratio of its amplitude. These are calculated as following:
(1.1)
(1.2)
where represent the time when the inside and outside surface temperatures are at their maximums, respectively. represent the time when the inside and outside surface temperatures are at their minimums, respectively. are the maximum and minimum inner wall surface temperatures and the maximum and minimum outer wall surface temperatures, respectively.
16 Fig. 1.2: Time lag and decrement factor
Extensive research was carried out dealing with wall heat flux and temperature time lag and decrement factor. Most of these studies dealt with optimizing the properties and distribution of the different material layers in a wall/roof to increase time lag and to decrease decrement factor (Asan and Sancaktar 1998, Asan 2000, Ulgen 2002, Kontoleon 2008, Kaska and Yumrutas 2008, Kaska and Yumrutas 2009, Sun et al. 2013).
1.2.3. Solar Radiation
Solar radiation incident on building facades contributes in two ways. The first one is the solar radiation absorbed by the exterior opaque surfaces then transmitted to the inside. Dexter and Bickle (1978) indicate that the efficiency of a building exterior surface is its ability to collect solar radiation and transmit it to the inside. For climates where the heating season is dominant, it is more important to have higher efficiency. For climates where the cooling season is dominant, it is more important to have less efficiency. The second way is the direct solar gains through windows. Solar radiation passes through the wall glazing surfaces to be absorbed by the interior room surfaces (especially the floor). Part of this energy is transmitted directly to the indoor air and another part is absorbed to be transmitted at a later time of the day. It is crucial to optimize the sizes of the windows, their glazing properties, their orientation, and their interior and exterior shading devices. In cold winters, it is important to benefit from the passive solar gains through the windows. In hot summers, it is important to decrease the solar gains to prevent overheating.
17
1.3. Thermal Comfort 1.3.1. Introduction
The ISO Standard 7730 (ISO 2005) defines thermal comfort as the mental condition that expresses satisfaction with the thermal environment. A lot of factors affect the occupants’ thermal comfort, such as room temperature, humidity, air velocity, etc. Extensive research has been done trying to model thermal comfort within spaces. Most practitioners refer to standards such as ASHRAE Standard 55 (ASHRAE 2010) and ISO Standard 7730 (ISO 2005) to estimate thermal comfort. These standards are based primarily on mathematical models developed by Fanger and his colleagues on the basis of laboratory studies (Fanger 1970). 1.3.2. Simple Models
The easiest way is to use the indoor air temperature as an indicator to assess thermal comfort. This method calculates the number of hours during which the indoor air temperature exceeds a certain comfort value (for example, 26°C or 27°C in summer). Alternatively, the operative temperature could be used to account for radiative heat exchange between the occupants and the different room surfaces.
1.3.3. Conventional Models
Throughout the last few decades, a lot of research has been carried out to develop a mathematical model that predicts thermal sensation and comfort of occupants. Three thermal comfort models are widely used: Fanger model (Fanger 1970), Pierce two-node model (Gagge et al. 1970 and Gagge et al. 1986), and KSU model (Azer and Hsu 1977). All three models are related to heat balance equations of the human body and a thermal sensation scale. Some environmental variables (air temperature, mean radiant temperature, relative humidity, and air velocity) as well as human factors (metabolic rate and clothing insulation) are used to predict thermal comfort levels.
Fanger obtained his mathematical model of thermal comfort by conducting experiments in a climatic chamber. Participants wore standard clothing and performed standard activities while subjected to different thermal environments. They recorded their thermal sensation using a 7 point scale varying between -3 to +3 where 0 represents neutrality. Positive numbers represent warm/hot environment whereas negative numbers represent cool/cold environment.
18
Using correlated data from the experiments and taking all major human body heat losses, the model was developed using the predicted mean vote (PMV) index calculated using equation (1.3). For a thermally comfortable environmental, PMV should lie between -0.5 and 0.5. ( ) ( ) (1.3) where:
H is the internal heat production rate per unit area (W/m2)
L is the energy loss from body (W/m2)
M is the metabolic rate per unit area (W/m2)
The Pierce Two-Node Model (Gagge et al. 1970, Gagge et al. 1986) divides the human body into two parts: core and skin. Heat balance equations are developed. Thermal sensation, measured using a similar scale as that of Fanger, is then calculated to assess thermal comfort.
The KSU model (Azer and Hsu 1977) is similar to the Pierce Two-Node model except that there is a variation in the heat balance calculation between the core and the skin in cold environment and a variation of the skin wettedness in warm environment. Berglund (1978) shows further details about the theoretical background of these models.
1.3.4. Adaptive Models
The PMV method for calculation of thermal comfort has faced a lot of criticism. The main point is that the PMV approach is derived from laboratory tests under steady state conditions. Some publications say that this approach could be misleading when used to predict thermal comfort (Humphreys et al. 2002, Stoops et al. 2004, Jokl et al. 2007). Most remarks say that the PMV does not take into consideration the effect of adaptation: psychological, physiological, and behavioral adaptation. Hence, several researchers prefer estimating thermal comfort using adaptive models. However, these latter are intended to be used in naturally ventilated buildings.
1.3.4.1. Adaptive Comfort Model Based on ASHRAE Standard 55-2010
This model relates the indoor comfort temperature (operative temperature) to the mean monthly outdoor air temperature. It defines two regions (as shown in Fig. 1.3) where 80% and 90% of occupants are satisfied.
19 Fig. 1.3: Adaptive thermal comfort region according to ASHARE Standard 55
The red line (comfort temperatures), and the 90% and 80% acceptability limits of Fig. 1.3 have equations (1.4-a), (1.4-b), and (1.4-c), respectively.
Top = 0.31*To,mm + 17.8 (1.4-a) Top = 0.31*To,mm + 17.8 ± 2.5 (90% acceptability) (1.4-b) Top = 0.31*To,mm + 17.8 ± 3.5 (80% acceptability) (1.4-c) where:
Top is the operative temperature (°C)
To,mm is the monthly mean outdoor air dry-bulb temperature (°C). 1.3.4.2. Adaptive Comfort Model Based on EN Standard 15251-2007
This model is similar to that of ASHRAE standard but it relates the operative temperature to the weekly outdoor mean temperatures as shown in Fig. 1.4. It defines three acceptability regions: 90%, 80%, and 65% acceptability.
20 Fig. 1.4: Adaptive thermal comfort region according to EN Standard15251
The red line (comfort temperatures), and the 90%, 80%, and 65% acceptability limits of Fig. 1.4have equations (1.5-a), (1.5-b), (1.5-c), and (1.5-d), respectively.
Top = 0.33*To,rm + 18.8 (1.5-a)
Top = 0.33*To,rm + 18.8 ± 2 (90% acceptability) (1.5-b) Top = 0.33*To,rm + 18.8 ± 3 (80% acceptability) (1.5-c) Top = 0.33*To,rm + 18.8 ± 4 (65% acceptability) (1.5-d) where:
Top is the operative temperature (°C)
To,rm is the running mean outdoor air dry-bulb temperature (°C) of the previous 7-day daily mean outdoor air dry-bulb temperatures.
1. Building Construction and Energy Performance Evolution 1.1. Introduction
Until the year 2009, the residential building sector in France counted around 32.2 million housing units with an annual energy consumption of about 494 TWh (ADEME 2009, Chiffres clés du batiment,). Figure 1.5 shows the number of individual and collective houses for three significant periods in building construction for the different climatic zones of France (FILOCOM 2009, taxe d’habitation,).
21 Fig. 1.5: Number of housing units in France per climatic region (source: FILOCOM 2009, taxe d’habitation)
In the Building Sector, space heating and domestic hot water remain the most important energy users, as presented in Fig. 1.6(IEA 2007, Energy Use in the New Millennium - Trends in IEA Countries). Since the first oil crisis, the implementation of building thermal regulations (RT 1974) through a combination of higher efficiencies of equipment and improved thermal performance of the building envelope has led to a significant reduction in the per capita energy requirement for space heating.
Fig. 1.6: Household energy use per capita (source: IEA 2007, Energy Use in the New Millennium -Trends in IEA Countries)
In most industrialized countries, new buildings will only contribute between 10% to 20% additional energy consumption by 2050 whereas more than 80% of the energy consumption will be influenced by the existing building stock and 75% of current buildings will still be standing in 2050.
22
1.2. History of Construction in France1 1.2.1. Traditional Way till the World War 2
This period can be divided into two periods: the first one (before 1914) includes the old buildings where the construction was based on local materials such as millstone, with little professionalized implementation.
The second period (1914-1948) represents the period where some manufactured materials started to be used in building construction such as cement, solid brick, interlocking tiles, etc.
These houses consume around 214kWh/m²
(final end-use energy) per year for space heating. Exterior walls are composed mainly of one of the following materials: stone rubble (sandstone, limestone, granite…), mud-brick, solid bricks, timbered structure with soil, brick, or mixed filling. For the ceiling and roof, the construction is wood. Windows are simple glazed with wooden joinery, and the window-to-wall ratio is around 10%. No specific thermal insulation is used.
1.2.2. Construction Strategy after the World War 2
At the end of the World War 2 (WW2), there was an urgent need to rebuild the devastated country. For many, traditional tools and techniques seem somewhat obsolete; they cannot meet the very important and urgent reconstruction needs. Thus, during the reconstruction period, it was vital to experience different construction techniques. Here came the necessity to apply the methods used in industry to the building construction sector: serial, mass, and standard production (construction). That was then called “Building Industrialization”.
1
Reference: “ DHUP (2007), Typologie des bâtiments d’habitation en France, ” and “ DHUP (2011), Etude socio-technico-economique du gisement de travaux de rénovation énergétique dans le secteur immobilier résidentiel, ” as reported by “Analyse Détaillée du Parc Résidentiel Existant, Report 2009”.
23
Prefabricated homes were the solution because their construction was rapid and standard. For individual houses, the construction material for exterior walls was hollow concrete blocks or hollow
bricks. For collective (community) houses, the construction material was reinforced concrete. For the houses constructed between the years 1948 and 1967, the space heating energy consumption is approximately 226 kWh/(m².year). The ceiling, floor and roof are composed of wood with interlocked tiles or asphalt shingles. Windows are simple glazed and the window-to-wall ratio varies between 20-27%. No specific thermal insulation is used.
For the houses constructed between the years 1968 and 1974, the space heating energy consumption is approximately 177 kWh/(m².year). The ceiling and roof are composed of wood with interlocked tiles or concrete shingles as final coating. It’s in these years where insulation started to enter the building industry; however, its implementation was still low. Some of these houses have insulation (4-10cm glass wool) below the ceiling or below the pitched roof. The floor is composed of concrete slab or terracotta. Two types of window glazing are used: simple or double, and the window-to-wall ratio is approximately 37%. In general, no specific thermal insulation is used in the exterior walls.
1.2.3. Interior Insulation: A Reaction after the Oil Crisis in 1970
After the increase in oil prices in 1970, the French government set a policy encouraging energy conservation by improving the performance and efficiency of heating systems and by using thermal insulation in the building fabric. In 1974, the first thermal regulation (RT 1974) was launched forcing buildings to have
thermal insulation. Also, the petrochemical industry diversified its markets by producing large amounts of glass wool insulation and polystyrene facilitating the entry of insulation into the building sector.
Fig. 1.8: Prefabricated houses
24
For this period, we distinguish two periods: the first one is between 1975 and 1981, and the second is between 1982 and 1989. Houses in the first period (1975-1981) have exterior walls composed of either masonry blocks, hollow bricks, or stone, with thermal insulation having an R-value of 2.3 (m².K)/W. Energy consumption for space heating is approximately 142 kWh/(m².year). The ceiling/roof is composed of wood with cement finishing. Also, thermal insulation (R = 4.8(m².K)/W) is added below the pitched roof. Windows are simple or double glazed and the window-to-wall ratio is around 25%. The floor is composed of concrete slab or terracotta with thermal insulation (R=1 (m².K)/W).
The majority of the houses in the second period (1982-1989) have exterior walls composed of concrete hollow blocks (67%) with interior insulation having an R-value of 2.4 (m².K)/W. Others (15%) have walls composed of hollow bricks with interior insulation. In addition, other materials are also used such as solid bricks, wood, cellular concrete. Energy consumption for space heating is approximately 106 kWh/(m².year). The ceiling/roof has insulation of R = 4.8(m².K)/W. Windows are simple or double glazed and the window-to-wall ratio is around 25%. The floor is composed of concrete slab or terracotta with thermal insulation having an R-value of 0.8 (m².K)/W for ground floor or R=1.9 (m².K)/W for crawl spaces.
1.2.4. Exterior Insulation: The New Approach
For homes built after 1990, exterior walls are, majorly, composed of concrete blocks with thermal insulation having an R-value of 3 (m².K)/W. New types of hollow bricks (such as brick- monomur) are also used possessing a higher energetic performance than those used in previous periods. Ceilings and roofs have thermal insulation of R-value = 6 (m².K)/W. Floors also have thermal insulation (R = 3 (m².K)/W) below the concrete slab. The installed windows were at first simple glazed, and then became double glazed. The window-to-wall ratio is around 20%. Energy consumption for space heating is approximately 95 kWh/(m².year).
During these last two decades, the rehabilitation of existing buildings introduced the concept of exterior insulation. It is difficult to choose between interior and exterior insulation. Moreover, thermal regulations in force today still don’t recommend on the best way to insulate buildings. This technique of building insulation has its advantages and its drawbacks.
25
1.2.4.1. Advantages of Using Exterior Insulation - reduces heat losses through thermal bridges
- enhances thermal comfort through increasing the thermal inertia near the inside of the living space
- preserves the usable area of the living space
- conducts the work without the necessity for inhabitants’ displacement (for existing buildings); thus, facilitates rehabilitation
- decreases the possibility of condensation
- avoids polluting the interior air due to the insulating materials used
- modifies/improves the aesthetic of buildings (especially old ones; not convenient with some ornamented or heritage buildings)
1.2.4.2. Drawbacks of Using Exterior Insulation
- causes a problem when balconies and parapets are present
- high inner thermal inertia may not be suitable in some cases (intermittent heating/cooling)
- should be protected from outside conditions - more difficult to install than interior insulation
- can’t be used when ornamented or heritage facades are to be preserved
1.2.5. Summary
Table 1.1 summarizes the construction types of French houses since before the WW2 till the last decade.
26 Table 1.1 : Houses' Construction in France during the different periods
period
< 1948 1948 - 1967 1968-1974 1975-1981 1982-1989 1990-2000 Space
Heating
Final energy use for space
heating 214 (kWh/m²/year) 226 (kWh/m²/year) 177 (kWh/m²/year) 142 (kWh/m²/year) 106 (kWh/m²/year) 95 (kWh/m²/year) Opaque wall Construction - Stone rubble: (such as sandstone, limestone, granite…) - mud-brick - solid bricks - timbered structure with soil, brick, or mixed filling - hollow concrete blocks - hollow bricks - reinforced concrete -hollow concrete blocks - hollow bricks - reinforced concrete -masonry blocks -cellular concrete -hollow brick - stone - concrete hollow blocks (67% of houses) - hollow bricks (15%) - concrete blocks - more energy efficient hollow bricks (such as brick monomur) Thermal Insulation No No No R = 2.3 (m².K)/W R = 2.4 (m².K)/W R = 3 (m².K)/W Roof/ceiling Construction wood with a final coating based on local materials wood with interlocked tiles or asphalt shingles wood with interlocked tiles or concrete shingles wood with cement finishing ( wood with cement finishing ( Concrete insulated beam Thermal Insulation No No Some houses start to have insulation (4-10cm glass wool) R = 4.8 (m².K)/W) R = 4.8 (m².K)/W) R = 6 (m².K)/W) Floor Construction
Wood (on arcs) or slab on ground
Wood concrete slab or terracotta
concrete slab or
terracota
concrete slab or
terracota Concrete slab
Thermal Insulation No No No R= 1 (m².K)/W) R = 0.8 (m².K)/W for ground floor or R=1.9 (m².K)/W for crawl spaces. R = 3 (m².K)/W) Window
Construction Simple glazed Simple glazed Simple / Double Simple /
Double Simple / Double
Simple then Double Window to
27
2. Aerogel-Based Insulating Materials: Building Applications 2.1. Introduction
The strict new thermal regulations and the notion of the net zero energy building (nZEB) ensure that new buildings do not place additional burden upon energy resources. For existing buildings, as shown in the previous section, renovation has a high priority in many countries, and France is one of them, because these buildings represent such a high proportion of energy consumption and they will be present for decades to come. Several studies (Verbeeck and Hens 2004, Enkvist et al. 2007, Energy Efficiency Watch Final Report 2013) have shown that the most efficient way to curb the energy consumption in the building sector (new and existing) remain the reduction of the heat losses by improving the insulation of the building envelope. A step beyond the current thermal performance of building envelope is essential to realize the intended energy reduction in buildings. For retrofitting and even for new buildings in cities, the thickness of internal or external insulation layers becomes a major issue of concern. Therefore, there is a growing interest in the so-called super-insulating materials, such as Aerogels.
Silica aerogels are silica-based dried gels having very low weight and excellent thermal insulation performance (Bisson et al. 2004). Specifically, they have high porosity (80-99.8%), low density (3 kg/m3), and low thermal conductivity (0.014 W/m-1.K-1), (Soleimani Dorcheh A. 2008). Silica Aerogels are an innovative alternative to traditional insulation due to their high thermal performance, although the costs of the material remain high for cost-sensitive industries such as the building industry. Research is continuing to improve the insulation performance and to decrease the production costs of aerogels. The unique properties of aerogels offer many new applications in buildings (TAASIS 2011). The extraordinary low thermal conductivity of aerogels as well as its optical transparency allows its use for insulating building facades and insulating window panes. Two different types of silica aerogel-based insulating materials are being used in the building sector. The first type is the opaque silica aerogels-based materials and the second one is the translucent materials.
28
2.2. Opaque Composite Silica Aerogel-Based Materials Aerogel blankets/panels are used to insulate building walls, grounds, attics, etc. Aspen Aerogels Inc. (Northborough, MA, US) has developed an insulation blanket based on silica aerogels, Spaceloft® (www.aerogel.com/products /pdf/Spaceloft_MSDS.pdf). It has a thermal conductivity of 0.0131 W/(m.K). Spaceloft® was used to convert an old mill house in Switzerland into an energy saving passive house (Fig. 1.10). A 9mm thickness layer was used externally and internally on the
walls and also internally on the floors. The U-value of the walls improved from 1 W/(m2K) to 0.2 W/(m2K) (Case study, www.aerogel.com /markets/Case_Study_House_Renovation_web.pdf). Due to its small thickness, Spaceloft® can be installed on interior walls of buildings preserving the area of the occupied spaces. A case study was done in the United Kingdom where a number of governmental housing units were retrofitted by adding Spaceloft® insulation layer at the interior wall surfaces (Case study, www.aerogel.com/
markets/Case_Study_Interior_Wall_web.pdf). A 44% reduction in the U-value, a 900 kWh/year energy reduction, and a 400 kg/year reduction in carbon emissions were obtained.
In a typical building, the framing is not insulated, resulting in heat losses through the studs. Spaceloft® insulation decreases heat loss through thermal bridges and improves thermal performance up to 40% in steel studs and up to 15% in wood studs. Fig. 1.11 shows the reduction in the thermal bridges heat losses between the ground floor un-insulated frames and the top floor insulated frames (Case study, www.aerogel.com/markets /Case _Study_Framing_web.pdf).
Aerogel Blanket
Fig. 1.10: Aspen aerogel insulation for retrofitting of an old brick dwelling
Fig. 1.11 : A thermographic image of a timber wall where the studs of the top floor are insulated with a thin layer of aerogel insulation whereas the ground floor is not
29
In another study, thermal performances and experimental tests were performed on walls and roofs using aerogel insulation (Kosny et al. 2007). Hot box measurements on wall assemblies containing aerogels showed that the R-value of wood framed walls is improved by 9% and that of a steel framed wall by 29%. Finite difference simulations performed on steel-framed wall assemblies using 0.6cm thick aerogel strips showed that aerogel can help in reducing the internal surface temperature differences between the center of the cavity and the stud location from 3.2ºC to only 0.4ºC. For roof structures, hot box measurements performed on the fastened metal roof insulated with aerogel strips showed an increase in the overall roof R-value by about 14%.
2.3. Translucent Silica Aerogel-Based Materials Another type of silica aerogel-based materials which are used in buildings is the translucent insulation materials. These materials have the advantage to combine a low thermal conductivity along with high transmittance of solar energy and daylighting. Research has been conducted in the last decade on the development of highly insulating windows based on granular
aerogels and monolithic aerogels (Pajonk 1998). A new glazing element based on granular silica aerogel was developed at ZAE Bayern, Germany (Reim et al. 2002, Reim et al. 2005). The glazing consists of 16mm double skin sheet made of polymethylmethacrylate filled with granular silica aerogels separated by two gaps filled with krypton or argon and installing glass panes at the ends (Fig. 1.12). Two types of granular silica aerogels are used: semi-transparent spheres and highly translucent granulates. Three window systems were developed. The first is a daylighting system by applying a low-e coating (emissivity = 0.08) on the panes. A total solar transmittance between 0.33 and 0.45, and a U-value having a range of 0.44-0.56 W/(m2K) were obtained. The second system is a sun protecting system developed by applying a lower emissivity (0.03) to the glass panes. A U-value of 0.37-0.47 W/(m2K), a visible transmittance of the range of 0.19 and 0.38, and a solar transmittance between 0.17 and 0.23 were achieved. The third is a solar collector by placing a heat exchanger between a layer of aerogels and two glass panes. When
Fig. 1.12: Cross-section through the granular aerogel based glazing