Mise en garde
La bibliothèque du Cégep de l’Abitibi-Témiscamingue et de l’Université du Québec en Abitibi-Témiscamingue (UQAT) a obtenu l’autorisation de l’auteur de ce document afin de diffuser, dans un but non lucratif, une copie de son œuvre dans Depositum, site d’archives numériques, gratuit et accessible à tous. L’auteur conserve néanmoins ses droits de propriété intellectuelle, dont son droit d’auteur, sur cette œuvre.
Warning
The library of the Cégep de l’Abitibi-Témiscamingue and the Université du Québec en Abitibi-Témiscamingue (UQAT) obtained the permission of the author to use a copy of this document for nonprofit purposes in order to put it in the open archives Depositum, which is free and accessible to all. The author retains ownership of the copyright on this document.
DIFFÉRENCIATION GÉNÉTIQUE ET STRUCTURE DES POPULATIONS BORÉALES DE CROSSOCALYX HELLERIANUS (NEES EX LINDENB.)
MEYL. EN AMÉRIQUE DU NORD
MÉMOIRE PRÉSENTÉ
COMME EXIGENCE PARTIELLE DE LA MAÎTRISE EN ÉCOLOGIE
PAR
NUWAN SAMEERA LIYANAGE
UNIVERSITÉ DU QUÉBEC EN ABITIBI-TÉMISCAMINGUE
GENETIC DIFFERENTIATION AND STRUCTURE OF BOREAL POPULATIONS OF CROSSOCALYX HELLERIANUS (NEES EX LINDENB.)
MEYL. IN NORTH AMERICA
THESIS SUBMITTED
IN PARTIAL FULFILMENT OF THE REQUIREMENTS FOR THE MASTER'S DEGREE IN ECOLOGY
BY
NUWAN SAMEERA LIYANAGE
ACKNOWLEDGEMENTS
Foremost, I would like to express my sincere gratitude to my supervisor Nicole Fenton, Ph.D (UQAT), for the continuous support of my study, for her patience, inspiration, enthusiasm, and expert advice. Her guidance helped me in all the stages of this project. I could not have imagined having a better supervisor and mentor for my study. A special thanks go to the members of my committee, Francine Tremblay, Ph.D (UQAT) and Juan Carlos Villarreal Aguilar Ph.D (Université Laval) for their valuable insights and suggestions, which have greatly supported the success of this study.
I am indebted to Julie Arseneault (UQAT), Jennifer Doubt (Canadian Museum of Nature), Richard Canners (Royal Alberta Museum), and Krista Williams (ABMI) for their support in collecting the samples and planning my research. I wish to express my deepest gratitude to Endre Gy. Toth (UQAT) for his enormous support and assistance for laboratory work, data analysis, and writing of my project. This project was funded by the National Science and Engineering Research Council (NSERC) of Canada and I wish to show my gratitude to them for funding this research.
Furthermore, I would like to show my appreciation to all the members of the UQAT laboratory of bryology, and the entire Institute of Forest Research who have helped me in numerous ways during this project. Finally, I wish to acknowledge the support and great love of my family, my boyfriend, and my friends. They kept me going on and this work would not have been possible without their input.
ACKNOWLEDGMENTS ... iii
LIST OF FIGURES ... vi
LIST OF TABLES ... vii
SUMMARY ... viii
CHAPTER I GENERAL INTRODUCTION ... 1
1.0 Context ... 1
1.1 Bryophyte population genetics and factors influencing genetic variation ... 2
1.1.1 Biological factors ... 2
1.1.2 Geographic factors ... 4
1.2 Crossocalyx hellerianus (Nees ex Lindenb.) Meyl. ... 5
1.3 Objective of the study ... 7
1.3.1 Specific objctives ... 7
1.4 Hypotheses ... 7
CHAPTER II GENETIC DIFFERENTIATION AND STRUCTURE OF BOREAL POPULATIONS OF CROSSOCALYX HELLERIANUS (NEES EX LINDENB.) MEYL. IN NORTH AMERICA ... 9
2.1 Abstract ... 9
2.2 Introduction ... 11
2.3.1 Regional setting and sampling ... 15
2.3.2 Microsatellite genotyping... 19
2.3.3 Statistical data analysis ... 20
2.3.3.1 Genetic diversity estimation ... 20
2.3.3.2 Genetic variation and population structure ... 21
2.4 Results ... 22
2.4.1 Genetic diversity in Canada ... 23
2.4.2 Genetic variation in Canada ... 24
2.4.3 Spatial genetic structure ... 27
2.4.3.1 Among Canadian provinces ... 27
2.4.3.2 Intercontinental ... 29
2.5 Discussion ... 29
2.6 Conclusion ... 34
CHAPTER III GENERAL CONCLUSION ... 35
APPENDICES ... 37
Figure Page 1.0 Map of the worldwide distribution of Crossocalyx hellerianus (Nees ex
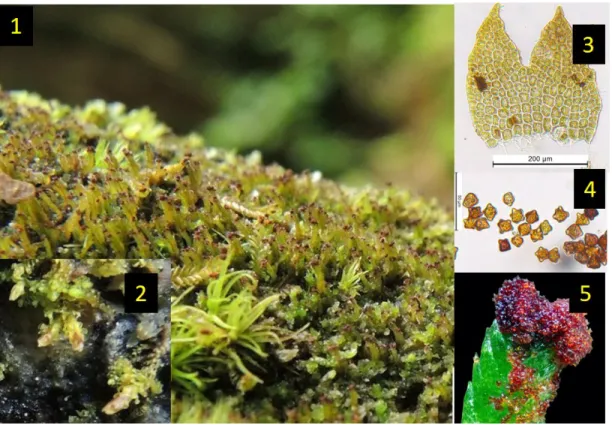
Lindenb.) Meyl. ... 5 2.1 C. hellerianus (Nees ex Lindenb.) Meyl. 1. Habitat, 2. Gametophytes with
perianths (copyright: Markus Reimann), 3. Leaf lobe, 4. Gemmae (copyright: Kristian Hassel, NTNU), 5. Gemmiferous shoot (copyright: Des Callaghan).. ... 14 2.2 Estimated genetic structure of Crossocalyx hellerianus in Canada for
K = 11 based on BAPS and TESS analyses. a) Cross-Canada results for the BAPS analysis; b) Zoomed in maps for each region showing the sampled populations; c) Results of the TESS analysis for Canadian populations. Population codes are found in Table 2.1. (the colors are not the same and cannot be compared between analyses) ... 27 2.3 Mapped results from the barrier analysis indicating locations of barriers
and their level of bootstrap support. ... 28 2.4 Population genetic structure of Crossocalyx hellerianus populations from
Canada, the Czech Republic, and Finland as estimated by TESS. Canadian samples finish with "CA", populations from the Czech Republic finish with “CZ” and populations from Finland finish with “FI”. ... 29 A.1 Sampling site distribution in Canada. ... 37 A.2 Allele frequency maps of Canadian colonies of Crossocalyx hellerianus .... 37
Table Page 2.1 Sample information, population codes, GPS coordinates, locations and
number of individuals selected per population ... 17
2.2 Population and colony genetic variation (AMOVA) of Crossocalyx hellerianus in Quebec, Alberta, and within the populations QCA, QCI, and ABB ... 24
2.3 Population and province level genetic variation (AMOVA) of Crossocalyx hellerianus ... 26
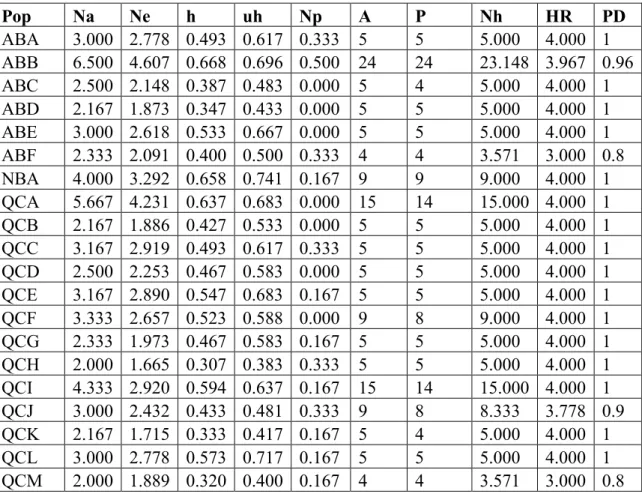
A.1 Colony level genetic diversity calculations in Canada ... 39
A.2 Population level genetic diversity calculations in Canada ... 40
Studying population genetic parameters of dominantly asexual bryophyte species is interesting due to the unique features of their life cycle, such as a relatively short distance dispersal capacity and a lack of the advantages of sexual reproduction. Studying asexual species becomes even more interesting when the study species are also habitat specialists, are rare in part of their global distribution, and have a dominant haploid life cycle. We chose a species that falls into all the above categories, Crossocalyx hellerianus (Nees ex Lindenb.) Meyl.; a minute dioicous epixylic liverwort with dominant asexual reproduction, which inhabits decaying logs and stumps of coniferous trees in boreal and subalpine forests with a circumboreal- subcontinental distribution. The objective of this study is to identify the spatial pattern of genetic variation and structure of C. hellerianus from population (site) to regional (100 km) and intercontinental scales (10 000 km) and to subsequently answer the question, how do the current distribution of the species and dispersal limitations shape the spatial genetic patterns of C. hellerianus?
Samples were collected from three provinces in Canada: Quebec (15 populations, 104 individuals), Alberta (six populations, 50 individuals), and New Brunswick (one population, nine individuals). Using already published data, we compared Canadian and European populations with six populations (99 individuals) from the Czech Republic and four populations (241 individuals) from Finland. Six polymorphic microsatellite markers were used to genotype the individuals. The sequenced data were analyzed for genetic diversity estimations, genetic variation, and population structure parameters using different software packages.
Despite the dominant asexual reproduction mode of this species, we observed a high level of genetic diversity even within colony and population levels. Also, we found some evidence of long-distance dispersal of asexual propagules of the species. In terms of genetic variation and structure, we observed two main clusters in North America and few barriers to gene flow, which is a pattern similar to that found in boreal tree species in North America that were influenced by post-glacial dispersal patterns. The populations from the Gulf of St-Lawrence region were differentiated from the other populations. At the intercontinental level, three significant clusters were observed as
Canadian, Czech, and Finnish populations each formed a cluster, although a connection between Europe and North America is suggested via the Gulf of St-Lawrence region. The results of this research indicate that the populations of asexually reproducing species can be as genetically diverse as sexually reproducing species. Furthermore, the genetic structure of the species in North America has been shaped by post-glacial dispersal patterns and biogeographic connections between North American and Europe.
Keywords: Crossocalyx hellerianus, bryophytes, liverworts, population genetics, spatial genetic patterns, SSR Microsatellite markers
RÉSUMÉ
L'étude des paramètres génétiques des populations d'espèces à dominance asexuée est intéressante en raison des caractéristiques uniques de leur cycle de vie, telles que la capacité de dispersion sur une distance relativement courte et l'absence des avantages de la reproduction sexuée. L'étude des espèces asexuées devient encore plus intéressante lorsque les espèces étudiées sont également des spécialistes de l'habitat, sont rares dans une partie de leur distribution mondiale et ont un cycle de vie haploïde dominant. Nous avons choisi une espèce qui entre dans toutes les catégories ci-dessus, Crossocalyx hellerianus ; une minuscule hépatique dioïque épixylique à reproduction asexuée dominante, qui habite les troncs et les souches de conifères en décomposition dans les forêts boréales et subalpines avec une répartition circumboréale et subcontinentale. L'objectif de cette étude est d'identifier le schéma spatial de la variation génétique et de la structure de C. hellerianus depuis la population (site) jusqu'aux échelles régionale (100 km) et intercontinentale (10 000 km) et de répondre ensuite à la question suivante : comment la répartition actuelle de l'espèce et la limitation de la dispersion ont-elles façonné les schémas génétiques spatiaux de C. hellerianus?
Des échantillons ont été prélevés dans trois provinces du Canada : le Québec (15 populations, 104 individus), l'Alberta (six populations, 50 individus) et le Nouveau-Brunswick (une population, neuf individus). En utilisant des données déjà publiées, nous avons comparé les populations canadiennes et européennes avec six populations (99 individus) de la République tchèque et quatre populations (241 individus) de la Finlande. Après avoir extrait l'ADN des échantillons canadiens, six marqueurs microsatellites polymorphiques (SSR) ont été utilisés pour génotyper les individus. Les données séquencées ont été analysées pour estimer la diversité génétique, la variation génétique et les paramètres de la structure génétique à l'aide de différents logiciels. Malgré le mode de reproduction asexué dominant de cette espèce, nous avons observé un niveau élevé de diversité génétique, même au sein des colonies et des populations, qui pourrait être dû à des mutations somatiques. Nous avons également trouvé des preuves de la dispersion à longue distance des propagules asexuées de l'espèce. En termes de variation et de structure génétiques, nous avons observé deux groupes principaux en Amérique du Nord et peu d'obstacles au flux génétique, ce qui est un schéma similaire à celui trouvé chez les espèces d'arbres boréaux en Amérique du Nord qui ont été influencés par les schémas de dispersion post-glaciaires. Les populations de la région du Golfe du Saint-Laurent ont été différenciées des autres populations. Au
niveau intercontinental, trois groupes importants ont été observés, les populations canadienne, tchèque et finlandaise formant chacune un groupe, bien qu'un lien entre l'Europe et l'Amérique du Nord soit suggéré via la région du golfe du Saint-Laurent. Les résultats de cette recherche indiquent que les populations d'espèces à reproduction asexuée peuvent être aussi diversifiées génétiquement que les espèces à reproduction sexuée. En outre, la structure génétique des espèces en Amérique du Nord a été façonnée par les schémas de dispersion post-glaciaire et les connexions biogéographiques entre l'Amérique du Nord et l'Europe.
Mots-clés : Crossocalyx hellerianus, bryophytes, hépatiques, génétique des populations, modèles génétiques spatiaux, marqueurs microsatellites de la SISR
GENERAL INTRODUCTION
1.0 Context
Bryophytes are a haploid dominant plant group that includes mosses, liverworts, and hornworts. Evolutionarily, they are the first land invaders and their species diversity is second only to that of flowering plants (Shaw et al, 2011). Ecologically, they influence many ecosystem processes such as microclimate variation, nutrient cycling, soil erosion, and tree growth/stand productivity (Turetsky, 2003; Glime, 2007; Fenton et al, 2010). Bryophytes are of particular importance in the vast boreal forests, where their biomass is dominant in some forest types (Qian et al, 1998; Fenton et al, 2010; Turetsky et al, 2010).
Bryophytes disperse through sexual spores and asexual propagules such as gemmae. Historically, it has been assumed that only a few bryophyte species disperse more than a few meters from the source colony (Szövényi et al., 2012), although the spores of most species are wind dispersed (Longton, 1997; Maciel-Silva and Pôrto, 2014). Vegetative propagules such as gemmae have less dispersal capacity, and their dispersal is generally believed to be limited to a few centimeters or meters around the parent colony (Glime and Bisang, 2014; Szövényi et al., 2012). As their propagules are believed to travel only short distances, bryophytes have been assumed to have distance
dependant dispersal, i.e., the genetic relatedness of populations should decrease with increasing distance between them (Sundberg, 2005). Although, some studies confirm this limited dispersal capacity of bryophyte propagules (Szövényi et al., 2012), other studies report long-distance dispersal in bryophytes that is independent of distance from the source population (Barbé et al, 2016; Lönnell et al., 2014; Sundberg, 2013; Zanatta et al., 2020).
1.1 Bryophyte population genetics and factors influencing genetic variation
A population can be defined as potentially interbreeding individuals of the same species which live within a restricted geographical area (Freeland et al., 2011). Therefore, studying genetic variations of plant populations is simply defined as plant population genetics (Waits and Storfer, 2016). Genetic diversity (amount of genetic variation) and genetic structure (distribution of genetic variation) are the two main variables studied under plant population genetics. They are primarily influenced by biological factors (mutation, selection, genetic drift, and gene flow) and geographic factors (Waits and Storfer, 2016).
1.1.1 Biological factors
Movement of genes within and among populations via mating and dispersal can be simply defined as gene flow. High gene flow rates homogenize allele frequencies in populations and inversely low gene flow rates produce population isolation and high genetic inter-population variation (Waits and Storfer, 2016). In bryophytes, it is observed that gene flow rates are high for most species, despite their theoretically limited dispersal capacity, resulting in relatively low genetic variation among populations (Hutsemekers et al., 2008). For example, Cronberg et al. (1997) observed low among-population genetic variation (GST = 0.073) in Hylocomium splendens at
different geographic scales in Scandinavia, which demonstrates high gene flow rates of some bryophytes across the landscape.
Genetic drift is the random change in allele frequency between generations (Freeland et al, 2011). When the effective (breeding) population size declines, there is frequently a rapid decrease in genetic diversity due to genetic drift (Waits and Storfer, 2016). In the absence of selection, this effect can result in the fixation or extinction of alleles within a short period (Freeland et al., 2011). This effect predominantly influences small populations because low-frequency alleles can be easily lost between generations for random reasons (Waits and Storfer, 2016). Despite this, Pohjamo et al., (2008) found that population size did not influence the genetic diversity of the liverwort Trichocolea tomentella, which supports the fact that genetic drift in bryophytes may be low despite the fact that some populations are relatively small.
Inbreeding generally occurs when the individuals of the population are genetically closely related. So, inbreeding reduces genetic variation, which in turn influences genetic drift (Freeland et al, 2011). It is said that the level of inbreeding is one of the main reasons for low genetic variation among individuals of coloniesof bryophytes because, in addition to selfing in unisexual species, asexual reproduction also results in inbreeding in bryophytes (Stenøien and Såstad, 2001). Therefore, it would be expected that genetic variation is lower in bisexual (monoecious) species of bryophytes. According to Vanderpoorten and Goffinet (2009), around 60% of mosses and 70% of liverworts are dioicous (unisexual). However, empirical tests using haploid genetic data of bryophytes do not support lower genetic variation in bisexual species than in unisexual species (Stenøien and Såstad, 2001). This may be explained by the fact that most dioicous bryophytes do not reproduce sexually because of the failure of swimming sperm to find female plants, therefore reducing their advantage (Vanderpoorten and Goffinet, 2009).
Genetic recombination during sexual reproduction is one of the main factors that influence the genetic variation, but not all bryophyte species have been shown to
reproduce sexually. For example, only 50% of species in Great Britain regularly produce sporophytes (Paton, 1999), and worldwide 4% of bryophytes have never been recorded with sporophytes (Frey and Kürschner, 2011). That means the regular reproduction method of many bryophyte species is vegetative reproduction, which may lead to lower genetic variation of the species. As an example, Pfeiffer et al., (2006) observed low within population genetic diversity in vegetatively reproducing moss Rhytidium rugosum.
1.1.2 Geographic factors
Isolation by distance and habitat fragmentation are described as the main geographic factors influencing the genetic variation of populations by increasing the possibility of breeding among genetically close individuals (Zartman et al., 2006). Isolation by distance is the correlation between genetic variation and geographic distance of populations, which is mainly influenced by landscape restrictions for dispersal (Slatkin, 1993). As an example, Snäll et al., (2004) observed that in two epiphytic bryophyte species, Orthotrichum speciosum and O. obtusifolium, genetic variation is high among individual populations separated by only 350 m, suggesting isolation by distance at small geographic scales. However, in study of, Kyrkjeeide et al., (2016a), observed extensive gene flow in a few Sphagnum species in the northern hemisphere, supporting the fact that oceans act as weak barriers against gene flow and isolation by distance at greater distances are low in bryophytes.
High levels of habitat fragmentation (loss of habitat due to the division of continuous areas into smaller areas (Didham, 2010) increase the distances among populations and act as a dispersal barrier leading to the reduction of gene flow and an increased influence of genetic drift by reducing the sizes of populations (Zartman et al., 2006). For example, Wilson and Provan (2003) found that within-population genetic variation
in Polytrichum commune in fragmented peat bogs was lower than in large non-fragmented bogs in Northern Ireland, suggesting restricted gene flow. On the other hand, Zartman et al. (2006) showed that the genetic diversity of Radula flaccida was not affected by habitat fragmentation, suggesting that dispersal capacity had a greater influence on genetic variation than fragmentation.
1.2 Crossocalyx hellerianus (Nees ex Lindenb.) Meyl.
Figure. 1 Map of the worldwide distribution of Crossocalyx hellerianus (Nees ex Lindenb.) Meyl.
C. hellerianus is circumboreal- subcontinental species which can be mainly found in central and northern European countries, northern and central parts of Russia, eastern and western parts of North America, and a few reported occurrences in Mexico, Guatemala, Japan, Bhutan and China (Fig. 1) (Gradstein and Vana, 1994; Kitagawa, 1966; Pohjamo and Laaka-Lindberg, 2004; Schill and Long, 2003). According to Hodgetts (2015), C. hellerianus is an IUCN red-listed species in most European countries. In Canada, the species is recorded in the Northwest Territories, the Yukon
Territory, and the provinces of Alberta, British Columbia, New Brunswick, Newfoundland and Labrador, Nova Scotia, Ontario, and Quebec (Hong, 1996; Leclerc, 2015; Hagborg, 2017). It is frequently observed on epixylic (growing on decaying wood) habitats in boreal forests across the country (Arseneault et al., 2012; Caners et al., 2013).
Crossocalyx hellerianus (Fig. 2.1) commonly named Helller’s Notchwort is a leafy liverwort species in the Family Anastrophyllaceae L. Söderstr., De Roo & Hedd. (Söderström et al, 2010). The basionym of the species is Jungermannia helleriana Nees ex Lindenb. and Anastrophyllum hellerianum (Nees ex Lindenb.) R.M. Schust. and Sphenolobus hellerianus (Nees ex Lindenb.) Steph. are two of the commonly uses synonyms of the species (Tropicos, Missouri Botanical Garden, 2017). C. hellerianus is a dioecious liverwort whose habitat is decaying logs and stumps of coniferous trees in boreal and subalpine forests (Schill and Long, 2003). The gametophyte shoots are small (up to 8 mm long and 0.9 mm wide) and creeping, ascending to erect, with little branches at the apex (Schill and Long, 2003). The most common reproduction method of C. hellerianus is asexual reproduction by gemmae as sexual reproduction is rare (Pohjamo and Laaka-Lindberg, 2003), which may result in less genetic variation among the individuals of a population. Gemmae are found on gemmiferous shoots creating purplish-red tips. Gemmae are usually unicellular and cubical (Schill and Long, 2003). In one study in Finland, sporophytes were observed on only three of the 25 studied colonies, and sporophyte density was 5.5 – 9.0 cm-2. The proportions of
shoots were 57.2% sterile; 35.1% gemmiferous: 3.4% male; 4.3% female (Pohjamo and Laaka-Lindberg, 2003). The spores and gemmae of the species are similar in size (<10 μm). Approximately 42 000 spores are produced per capsule and 1 200 gemmae are produced per shoot. However, propagule production per area of the colony is much higher for gemmae with 132 000 gemmae cm-2 compared to 27 720 spores cm-2.
and Laaka-Lindberg, 2003; Pohjamo et al., 2006). Furthermore, gemmae germination occurs more rapidly than for spores.
Pohjamo et al. (2006) found that 3.6 to 10.5% of spores and around 1% of gemmae of C. hellerianus landed within the source colonies ensuring the persistence of local colonies. Furthermore, dispersal patterns were similar in open and forested habitats and dispersal was distance-dependent up to 10 m. More than 50% of spores dispersed greater than 10 m and gemmae showed some ability for long-distance dispersal, which may contribute to gene flow at the landscape level.
1.3 Objective of the study
The goal of this study is to identify the spatial pattern of genetic variation and structure of C. hellerianus from population (site) to regional (100km) and intercontinental scales (10000km) to answer the question, how does the current distribution of the species along with dispersal limitation shape the spatial genetic patterns of C. hellerianus? 1.3.1 Specific objectives
1. To obtain enough samples of the species from the areas of interest through field collection and contacting herbariums.
2. To study the population genetics parameters using suitable software. 1.4 Hypotheses
H1: Considering the evidence for low dispersal capacity of this species in Europe, we predict that there should be a low level of genetic variation within and a high level of genetic variation among populations of C. hellerianus.
H2: At broader spatial scales, the low dispersal capacity of C. hellerianus results in a high level of the spatial genetic structure of colonies present at provincial and intercontinental level.
CHAPTER II
GENETIC DIFFERENTIATION AND STRUCTURE OF BOREAL POPULATIONS OF CROSSOCALYX HELLERIANUS (NEES EX LINDENB.)
MEYL. IN NORTH AMERICA
2.1 Abstract
Population genetic studies of liverworts have received increasing attention in the scientific community over the last decade. However, few studies have been undertaken in North America and none in Canada. Crossocalyx hellerianus is a minute dioecious epixylic liverwort with a circumboreal sub-continental distribution, which primarily reproduces through asexual gemmae. Although, it is a rare IUCN red-listed and patchily distributed species in Europe, it is a relatively common species in boreal Canada, which raises several questions such as, what is the current spatial genetic structure of bryophytes particularly asexual dispersal limited liverworts? What is the contribution of asexual propagules to long-distance dispersal? Here we identify the spatial pattern of the genetic variation and structure of C. hellerianus from population (site) to regional (100 km) to intercontinental scales (10 000 km) to answer the question, how does the current species distribution and dispersal limitation shape the spatial genetic patterns of C. hellerianus? Samples were collected from boreal forests in Quebec, Alberta, and New Brunswick in Canada. Extracted DNA was analyzed using six microsatellite markers already developed in Europe for this species and the sequenced data was used to find genetic diversity, genetic differentiation, and genetic structure, and compared with published data from Europe. Despite the dominant
asexual reproduction mode of this species, we observed a high level of genetic diversity even within colony and population levels, which may be mainly due to somatic mutations. In terms of genetic structure, we observed two different clusters in North America and few barriers to gene flow. This pattern presents some similarities with the genetic structure of boreal tree species in North America. At the intercontinental level, three significant clusters were observed as Canadian, Czech, and Finnish populations each formed a cluster. There is a connection between North America and Europe via the Gulf of St-Lawrence region. The results of our research indicate that the populations of asexually reproducing species can be as genetically diverse as sexually reproducing species. Furthermore, we suggest that the genetic structure of the species in North America has been shaped by the post-glacial dispersal patterns of trees, their dominant substrate and biogeographic connections between North American and Europe.
Keywords: Crossocalyx hellerianus, bryophytes, liverworts, population genetics, spatial genetic patterns, SSR markers
2.2 Introduction
Uneven distribution of genetic variability in a species, manifests in genetic differentiation and structure, and is a result of complex interactions between neutral and selective evolutionary processes such as demography, selection, mutation, migration, and drift (Loveless and Hamrick 1984). Ecological factors are also particularly important when affecting reproduction and dispersal, and therefore influence the development of differences within and among populations (Loveless and Hamrick 1984; Eckert et al., 2008).
By investigating genetic patterns of differentiation and structure we may better understand how species-specific traits that influenced dispersal (Duminil et al., 2007; Janes and Batista, 2016; Verity and Nichols, 2014). Also, differentiation due to natural selection, at the local scale, may provide information on environmental interactions and adaptations to local selection pressures (Guisan and Thuiller, 2005; Trakhtenbrot et al., 2005). Lastly, genetic differentiation gives an exceptional opportunity to study historical imprints of demographic fluctuations and colonization events in species (Eckert et al., 2008).
Although the consequences of genetic differentiation and structure in natural plant populations are frequently studied, bryophytes are some of the most widely dispersed plant species but are still little investigated (Patino and Vanderpoorten, 2018). In particular, studies focusing on bryophyte population genetics, including diversity and differentiation, are scarce.
The population genetic background of bryophytes is interesting due to their differences from higher plants. Bryophytes have a dominant haploid phase compared to the dominant diploid phase in higher plants. Although it is experimentally confirmed that haploid organisms adapt faster as selection is more efficient than in their diploid counterparts (Gerstein et al., 2011), genome-wide comparison of Arabidopsis thaliana (L.) Heynh. and Funaria hygrometrica Hedw. showed that selection is not more
efficient in haploids than in diploids (Szövényi et al., 2013). Moreover, reproduction rates via asexual reproduction are higher in bryophytes compared to higher plants (Frey and Kürschner, 2011), influencing the genetic structure and differentiation of populations. Also, mitotic mutations in somatic cells can play a major role in creating genetic diversity especially in long-lived or clonal species like bryophytes (Haas et al., 2020; Yu et al., 2020).
Furthermore, bryophytes are interesting to study because of our rudimentary understanding of their dispersal capacity, which is an influential factor for genetic differentiation and structure. Although, there is now a lot of evidence for the long-distance dispersal capacity of sexual spores of bryophytes (Szövényi et al., 2012; Lewis et al., 2014; Kyrkjeeide et al., 2016a), the long-distance dispersal capacity of asexual propagules of bryophytes is still not clear (Laaka-Lindberg et al., 2003).
Another reason that bryophytes are interesting subjects is that a high proportion of bryophytes are habitat or substrate specialists (Söderström and Herben, 1997), and the lack of continuous habitats and substrates can restrict gene flow. Lastly, there are fewer population genetics studies of bryophytes compared to those on higher plants, and the majority of those studies are limited to Europe. Consequently, compared to Europe, we know less about population genetic parameters of bryophytes in North America especially in Canada. There are many worldwide studies of Sphagnum species (Kyrkjeeide et al., 2016a), which included Canadian populations and some studies of common moss species like Pleurozium schreberi (Willd. ex Brid.) Mitt. (Kotelko et al., 2008), and Dicranum elongatum Schleich. ex Schwägr. (Cassie et al., 2008). In liverworts, very few population genetics studies have been completed in North America (Porella platyphylla (L.) Pfeiff. -Wyatt et al., 2005; Mannia fragrans (Balb.) Frye & L. Clark - Hock et al., 2008). According to our knowledge, there are not any population genetic studies on any liverwort species in Canada, although there are some population genetic studies in Europe for some of the liverwort species present in
Canada (North America). However, European studies cannot be applied directly to Canada because of the differences in landscape characteristics such as habitat fragmentation, forest management, and different geographic histories like different migration patterns and glacial refugia.
Crossocalyx hellerianus is a minute dioecious epixylic liverwort, inhabiting decaying logs and stumps of coniferous trees in boreal and subalpine forests (fig. 2.1). It is a circumboreal species that is mainly found in central and northern European countries, northern and central parts of European Russia, and eastern and western parts of North America (Kitagawa, 1966; Gradstein et al., 2001; Schill and Long, 2003; Pohjamo and Laaka-Lindberg, 2004). Although, it is a “least concern” species on the European Red List of bryophytes (Hodgetts et al., 2019), C. hellerianus is a regionally endangered or vulnerable species in most European countries (Hodgettets, 2015). The most common reproduction method of C. hellerianus is asexual reproduction by gemmae (Pohjamo and Laaka-Lindberg, 2003), which may result in less genotypic variation among the individuals of a population. In Finland, sporophytes were observed in only three out of the 25 studied colonies and proportions of sexual shoots were low (Pohjamo and Laaka-Lindberg, 2003). The spores and gemmae of the species are similar in size (<10 μm) and propagule production per area of the colony is much higher for gemmae with 132 000 gemmae cm-2 compared to 27 720 spores cm-2. Furthermore, the percentage
germination and germination speed of gemmae are also higher than spores (Pohjamo and Laaka-Lindberg, 2003; Pohjamo et al., 2006).
Pohjamo et al., (2006) found that 3.6 to 10.5% of spores and around 1% of gemmae of C. hellerianus landed within the source colonies ensuring the persistence of local colonies. They also reported that dispersal patterns are similar in open and forested habitats and that dispersal is distance-dependent up to 10 m and distance independent afterwards. They have concluded that both spores and gemmae have the ability for long-distance dispersal permitting significant gene flow at the landscape level
(Pohjamo et al., 2006). One study of population genetics of C. hellerianus in Europe reported a high level of genetic diversity and differentiation of the populations of the species in the Czech Republic and Finland but also the occasional detection of identical genotypes even at distances such as 20 to 80 m (Holá et al., 2015). So, these facts justify C. hellerianus as an interesting species to study genetic differentiation and structure of liverworts in North America.
Figure 2.1. Habit and features of C. hellerianus (Nees ex Lindenb.) Meyl. 1. Habitat, 2. Gametophytes with perianths (copyright: Markus Reimann), 3. Leaf lobe, 4. Gemmae (copyright: Kristian Hassel, NTNU), 5. Gemmiferous shoot (copyright: Des Callaghan).
The objective of this study is to identify the spatial pattern of genetic variation and structure of C. hellerianus from population (site) to regional (100 km) and intercontinental scales (10 000 km). The identification of these patterns will answer the question, what are the spatial genetic patterns of C. hellerianus? To answer that question, we test the two following hypotheses: H1: Considering the evidence for low
dispersal capacity of this species in Europe, we predict that there should be a low level of genetic variation within and a high level of genetic variation among populations of C. hellerianus. H2: At broader spatial scales, the low dispersal capacity of C. hellerianus results in a high level of spatial genetic structure of colonies present at provincial and intercontinental scales.
2.3 Materials and Methods
2.3.1 Regional setting and sampling
Samples were collected from boreal forests in three provinces in Canada: Quebec (QC), Alberta (AB), and New Brunswick (NB). However, the majority of the samples (see Table 1) were collected in Quebec. The sampling forest landscape of Quebec is composed of a mosaic of old and regenerating boreal forest stands after natural fire and harvest (Chaieb et al., 2015). The dominant tree species is black spruce (Picea mariana (Mill.) Britton, Sterns & Poggenb.) with Pinus banksiana Lamb., Populus tremuloides Michx, Abies balsamea (L.) Mill. and Betula papyrifera Marshall. as secondary forest species. The forest understory is dominated by bryophytes such as Pleurozium schreberi (Brid.) Mitt. and Sphagnum species (Barbé et al., 2016). Between 2008 and 2014, the bryophyte community was sampled by the members of Bryology laboratory at University of Quebec in Abitibi-Temiscamingue in a series of forest sites. Within each forest site, three 50m2 plots were established and within each plot, all bryophyte
species on all substrates (e.g. deadwood, tree bases) were sampled (Barbé et al., 2017). In total, 69 forest sites (225 plots) were sampled. From this large database, 11 sites with at least one colony of C. hellerianus were selected (Table 2.1).
In addition to the sites from this database, we also analyzed samples from elsewhere in Quebec and Canada (Table 2.1). Samples QCI and QCJ came from Central Québec (Dolbeau and Mauricie) in coniferous forests, with the understory dominated by bryophytes. The sample QCN was collected from Mont Kékéko near the city of
Rouyn-Noranda in northwestern Quebec. Species like P. mariana Populus spp, and B. papyrifera dominated the stand. The understory was dominated by bryophytes and ericaceous species. The sample QCO came from an Abies - Betula mixed forest in the Parc National de la Gaspésie, Quebec, and was obtained from the National Museum of Canada.
The samples of C. hellerianus from Alberta were obtained with the help of the Alberta Biodiversity Monitoring Institute (ABMI) at The Royal Alberta Museum. Population ABA is from the Lower Foothills Natural Subregion of Alberta in a Pinus species dominated forest with an understory dominated by Rhododendron groenlandicum (Oeder) Kron & Judd and P. schreberi (Natural Regions Committee, 2006). Populations ABB and ABF are from the Central Mixedwood Subregion of Alberta in P. tremuloides dominated forests with Shepherdia canadensis (L.) Nutt., Vaccinium myrtillus L., Rosa spp., and Viburnum edule Raf. dominating the understory (Natural Regions Committee, 2006). Population ABC is from the Central Mixedwood Subregion of Alberta in a P. mariana dominated forest with R. groenlandicum and P. schreberi dominating the understory (Natural Regions Committee, 2006). The ABD population is also from the Central Mixedwood Boreal Subregion but in a Pinus Mixedwood stand with an understory dominated by S. canadensis, V. myrtillus, Rosa spp., and V. edule. Population ABE is from the Northern Mixedwood boreal subregion of Alberta in a stand dominated by Picea spp. and Sphagnum spp (Natural Regions Committee, 2006).
The samples from New Brunswick were obtained from coniferous stands in a riparian zone in a highly managed landscape. The site is dominated by Thuja and Picea species and the understory is dominated by bryophytes.
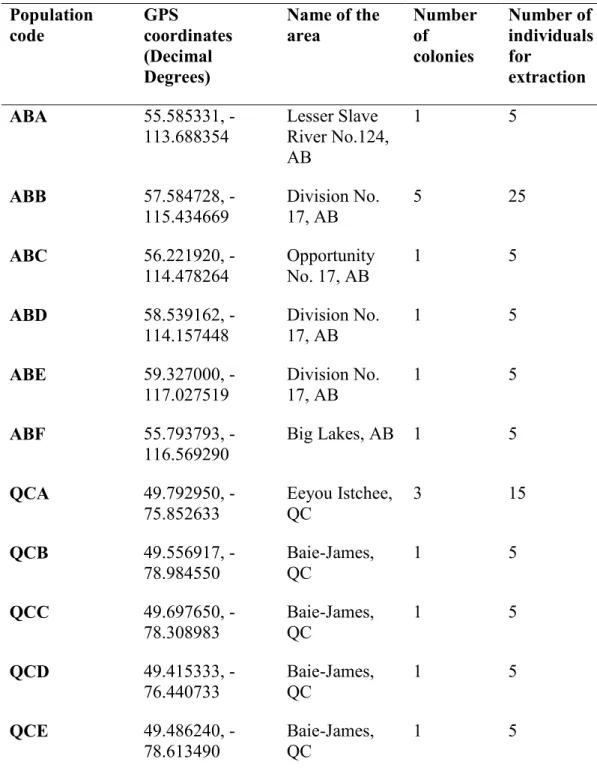
Table 2.1 Sample information, population codes, GPS coordinates, locations and number of individuals selected per population
Population code GPS coordinates (Decimal Degrees) Name of the area Number of colonies Number of individuals for extraction ABA 55.585331,
-113.688354 Lesser Slave River No.124, AB 1 5 ABB 57.584728, -115.434669 Division No. 17, AB 5 25 ABC 56.221920, -114.478264 Opportunity No. 17, AB 1 5 ABD 58.539162, -114.157448 Division No. 17, AB 1 5 ABE 59.327000, -117.027519 Division No. 17, AB 1 5 ABF 55.793793, -116.569290 Big Lakes, AB 1 5 QCA 49.792950, -75.852633 Eeyou Istchee, QC 3 15 QCB 49.556917, -78.984550 Baie-James, QC 1 5 QCC 49.697650, -78.308983 Baie-James, QC 1 5 QCD 49.415333, -76.440733 Baie-James, QC 1 5 QCE 49.486240, -78.613490 Baie-James, QC 1 5
Table 2.1 cont. QCF 49.173440, -76.281040 Baie-James, QC 2 9 QCG 49.194270, -76.754680 Baie-James, QC 1 5 QCH 49.100450, -76.601300 Baie-James, QC 1 5 QCI 49.001221, -71.898147 Dolbeau, QC 3 15 QCJ 47.857713, -72.811586 Mauricie, QC 2 10 QCK 49.774020, -76.016560 Baie-James, QC 1 5 QCL 49.784310, -76.012520 Baie-James, QC 1 5 QCM 49.880196, -78.805655 Baie-James, QC 1 5 QCN 48.182001, -79.162579 Kékéko, Rouyn-Noranda, QC 1 5 QCO 48.944322,
-66.124609 Parc National de la Gaspésie Gîte du Mont-Albert, QC
1 5
NBA 47.291583,
-67.610833 Drummond, NB 2 9
Each collection site was considered as a population, and each sample [i.e. all shoots (gametophores) on a single substrate] within a site was considered as a colony. Although there are different ways to define an individual in bryophytes, each shoot was
considered as an individual as we wanted to see the clonality of the species. In total, 163 individuals from 22 populations were selected for DNA extraction: six populations (represented by ten colonies) from Alberta containing 50 individuals; one population (two colonies) from New Brunswick containing nine individuals; and 15 populations (21 colonies) containing 104 individuals from Quebec.
To compare our results with those of Europe for this species, we used already published data from Holá et al. (2015) who used the same genetic markers to study population genetic parameters of the same species in Europe. We chose the samples without any missing data (six populations with 99 individuals in the Czech Republic and four populations with 241 individuals from Finland) for our comparison. The Czech populations represent all the known Crossocalyx hellerianus populations in the Czech Republic in 2012 and they are located in the temperate zone. The samples were collected from herb-rich and acidophilous mountain mixed forests that were dominated by Fagus spp. and Picea spp. According to Holá et al. (2015), the Finnish populations are from the boreal zone of southern Finland where the forests were dominated by Picea spp. with some Pinus, Betula and Populus admixtures. The mean distances among Czech populations is around 55km and among Finnish populations is around 62km. The distance between Czech populations to Finish populations is around 1 500 km.
2.3.2 Microsatellite genotyping
Genomic DNA was extracted from 0.02 mg of haploid plant tissue using the Extract-N-Amp Plant PCR Kit (Sigma-Aldrich, Saint Louis, MO, USA) following the manufacturer’s instructions. We chose microsatellite markers for two reasons: first, they are cost effective but reliable and second microsatellite data are the only population genetic data available for comparing the populations of C. hellerianus in other continents (Holá et al. 2015). Six polymorphic simples sequence repeats (SSR) loci: Pr1 (GenBank accession no.: KM065843), Pr2 (KM065842), Pr3 (KM065837),
Pr4 (KM065839), Pr5 (KM065845) and Pr6 (KM065840) developed by Holá et al. (2015) were used to genotype all the individuals. Forward nuclear primers were fluorescently labeled; Pr1, Pr2, Pr3, Pr4 with 6-FAM, while Pr5 was labeled with HEX and Pr6 with NED. Amplification of microsatellite loci was carried out through polymerase chain reaction (PCR) following the protocol of Holá et al. (2015). Primer-pair specific annealing temperatures (Ta) were optimized and determined using
gradient PCR (Ta: 54 ºC for Pr1, Pr2, Pr3, Pr4 and Pr5, and 58 ºC for Pr6). PCR was
performed in a 20-µL reaction volume containing 4 µL (20-80 ng/µL) DNA, 10 µL Extract-N-Amp PCR ReadyMix, 2.5 µM of each primer, 5 µL QIAGEN ultrapure nuclease-free water. The PCR reaction was performed in an Eppendorf Mastercycler Pro thermocycler (Applied Biosystems, Foster City, CA, USA). The PCR protocol for Pr1, Pr2, Pr3, Pr4, and Pr5 loci consisted of an initial step of 94 ºC for 3 min, followed by 30 cycles of 94 ºC for 30 s, 54 ºC for 30 s, 72 ºC for 1 min, followed by 72 ºC for 10 min and Pr6 loci consisted of an initial step of 94 ºC for 3 min, followed by 30 cycles of 94 ºC for 30 s, 58 ºC for 30 s, 72 ºC for 1 min, followed by 72 ºC for 10 min Amplified DNA fragments were checked by electrophoresis with a 1 % (w/v) GelRed-stained (Biotium, Hayward, CA, USA) agarose gel in 1× TBE buffer. Finally, fragments were sized (FLA; fragment length analysis) on an automated ABI 3730xl capillary DNA sequencer (Applied Biosystems, Foster City, CA, USA). Each genotype was visually examined with ABI Peak Scanner software (Applied Biosystems, Foster City, CA) and the exact genotypes were determined by using GeneMapper Software v. 4.1 (Life Technologies, Carlsbad, CA, USA). Unclear samples were reamplified and rescored.
2.3.3 Statistical data analysis 2.3.3.1 Genetic diversity estimation
Standard genetic diversity indices including the number of alleles (Na), number of effective alleles (Ne), number of private alleles (Np), and haploid genetic diversity (h)
were calculated with GenAlEx v.6.5 (Peakall and Smouse, 2006). The number of haplotypes per population (A), the number of private haplotypes (Ph), the effective number of haplotypes (Nh) and haplotypic richness (HR) was calculated using rarefaction method (El Mousadik and Petit, 1996), as implemented in Haplotype Analysis software (Eliades and Eliades, 2009). For each population and each colony, the extent of clonality was estimated as the proportion of distinguishable genotypes (PD; the number of different multilocus genotypes/number of individuals analyzed) according to Ellstrand and Roose, (1987); Arlequin v.3.5 software was used to identify shared haplotypes among colonies and populations.
2.3.3.2 Genetic variation and population structure
Analysis of molecular variance (AMOVA) implemented in Arlequin v.3.5 software (Excoffier and Lischer, 2010) was used to determine the partition of the genetic variation within and among populations. Pairwise population differentiation (pop vs. pop and regions vs. regions) was estimated using ΦPT (ΦPT; an analog of FST) and its
significance was tested by randomly permuting individuals among sites 999 times. The average number of migrants (Nm) was calculated using GeneAlEx 6.5.
The rate of gene flow between the sampled populations/regions was expressed as the number of migrants per generation (Nm) where N is the effective population size and m is the proportion of migrations per generation. Nm is estimated as Nm=[(1/ΦPT) −1]/2 based on the formula of Wright (1984) and as implemented in GenAlEx. 6.5. Different approaches were employed to investigate the spatial genetic structure of the populations. First, a Bayesian clustering approach implemented in TESS 2.3.1 (Durand et al, 2009) was used to infer the most probable number of groups or subpopulations (K) in the SSR dataset incorporating the geographical location of colonies as a priori information. Twenty independent runs for each K ranging from 1–17 (based on pilot
runs) was carried out with a burn-in of 10 000 and a total number of 50 000 sweeps. The optimal value of K was determined by choosing the lowest Deviance Information Criterion (DIC) compared between each K as Durand et al (2009) and François and Durand (2010) emphasized that the lower values of DIC indicate better models compared to models with higher values of DIC. The 20 runs corresponding to the best K were averaged using CLUMPP v1.1.2 (Jakobsson and Rosenberg, 2007) and represented in the form of bar graphs using the “pophelper” package (Francis, 2017) implemented in R (R Core Team, 2013). The same analysis was done compared with samples from Europe with twenty independent runs for each K ranging from 1–25. Second, we used BAPS 6.0 (Corander and Marttinen, 2006; Corander et al., 2008a, 2008b) to conduct hierarchical clustering with admixture analyses on the microsatellite dataset. BAPS was run with the maximal number of groups (K) set to 1–17 (equal or larger than the population number), and each run was replicated 50 times. The most plausible number of K from the BAPS analysis was plotted on a topographic map using ESRI ArcGIS (ArcMap 10.2.2, Redlands, CA, USA).
Delimitations in species’ spatial genetic pattern (i.e., genetic discontinuities) corresponding to the change in genetic variation between populations were evaluated with BARRIER 2.2 (Manni et al., 2004). Within the analysis, geographic coordinates were connected with Delaunay triangulation and the corresponding Voronoi tessellations were projected. Monmonier’s maximum difference algorithm (1973), implemented in BARRIER, traces a barrier along the Voronoi tessellations where the distance value is maximal. The estimated number of barriers was set from 1 to 9. The significance of the detected barriers was tested using 1000 resampled bootstrapped (population pairwise) DA genetic distance matrices (Nei’s chord distance; Nei, 1978)
generated in MICROSATELLITE ANALYSER (MSA) software (Dieringer and Schlötterer, 2003).
2.4.1 Genetic Diversity in Canada
All the loci were polymorphic at different levels. The number of alleles per locus varied from 5 (Pr 3 and Pr 5) - 23 (Pr 2 and Pr 6) size variants. The number of different alleles (Na) per colony was 1.667 - 3.167 and the number of effective alleles (Ne) varied from 1.529 - 2.994. Genetic diversity (h) per colony ranged from 0.240 - 0.573 and unbiased diversity (uh) varied from 0.300 - 0.717. The number of private alleles (Np) per colony ranged from 0.000- 0.333 and haplotype richness (HR) varied from 2.400 -3.000 (see Table A.1).
At the population level, the Naper population was 2.000 -6.500 and the Ne varied from 1.665 - 4.607. The genetic diversity per population ranged from 0.307 - 0.668 and the unbiased diversity varied between 0.383 to 0.741. The average number of private alleles per population ranged from 0.000- 0.500 and haplotype richness varied from 3.000 -4.000 (see Table A.2).
At the provincial level, the Naper population varied from 4.000 - 12.333, and the Ne varied from 3.292 -5.492. The genetic diversity per population ranged from 0.658 -0.67 and the unbiased diversity varied between 0.676 too 0.741. The number of private alleles per population ranged from 1.500- 3.500 and haplotype richness ranged from 7.941 -8.000 (see Table A.3).
The clonality of C. hellerianus was verified for each colony in each population and varied between 0.8 - 1.0. Therefore, we did not observe any clonality in this species. However, based on the shared haplotype analysis, a few shared haplotypes were observed: QC174 = AB031 that was shared between populations "QCK" and "ABC", QC152 = QC035 that was shared between populations "QCJ" and "QCA", and QC122 = QC092 that was shared between "QCI" and "QCF".
2.4.2. Genetic variation in Canada
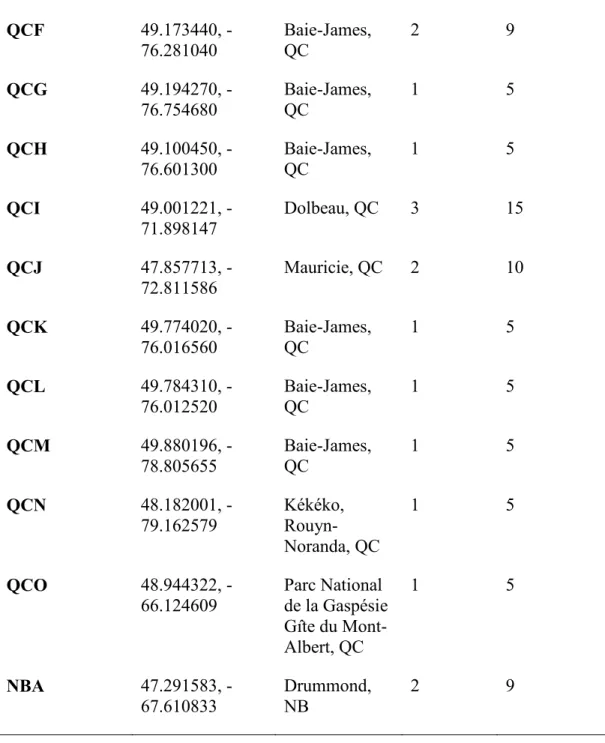
Before examining colony level differentiation, we examined overall differentiation within provinces. The results of the AMOVA analysis for Quebec indicated that 14% of the genetic variance was found among populations and 86% of the variance was found within populations (0.143 ΦPT; p = 0.001). For Alberta, it was 11% among populations and 89% within-populations. In population-level analyses (among colonies), populations QCA, QCI, and ABB indicated 9%, 15%, and 26% among colony variance correspondingly. Consequently, there was 91%, 85%, and 74% respectively within colony variance showing the majority of genetic variation was found at the colony level. (See Table 2.2).
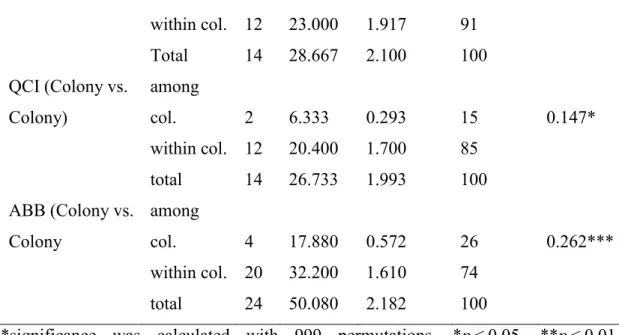
Table 2.2. Population and colony genetic variation (AMOVA) of Crossocalyx hellerianus in Quebec, Alberta, and within the populations QCA, QCI, and ABB.
Spatial scale Source of variation D.f. Sum of squares Estimated variance Variance (%) ΦPT Quebec (Pop vs. Pop) among pop. 14 52.499 0.293 14 0.143*** within pop. 89 156.511 1.759 86 Total 103 209.010 2.051 100 Alberta (Pop.vs. Pop.) among pop. 5 17.120 0.221 11 0.106*** within pop. 44 82.480 1.875 89 Total 49 99.600 2.096 100 QCA (Colony vs. colony) among col. 2 5.667 0.183 9 0.087*
Table 2.2 cont. within col. 12 23.000 1.917 91 Total 14 28.667 2.100 100 QCI (Colony vs. Colony) among col. 2 6.333 0.293 15 0.147* within col. 12 20.400 1.700 85 total 14 26.733 1.993 100 ABB (Colony vs. Colony among col. 4 17.880 0.572 26 0.262*** within col. 20 32.200 1.610 74 total 24 50.080 2.182 100
*significance was calculated with 999 permutations. *p < 0.05, **p < 0.01, ***p < 0.001. D.f. = Degree of freedom
The overall AMOVA analysis indicated that 13% of the genetic variance was found among populations and 87% of the variance was found within populations (0.134 ΦPT; p = 0.001). The comparison of populations among provinces showed that genetic variance between Alberta and Quebec was lower (4%) than the genetic variance between Alberta and New Brunswick (6%) and the genetic variance between Quebec and New Brunswick (6%) (See Table 2.3). Considering all populations, the gene flow was estimated at 3.219 migrants per generation.
Table 2.3 Population wise and province-wise genetic variation (AMOVA) of Crossocalyx hellerianus. Spatial scale Source of variation D.F. Sum of square Estimated variance Variance (%) ΦPT North America (Pop vs. Pop) among pop. 21 81.335 0.283 13 0.134*** within pop. 141 256.769 1.821 87 total 162 338.104 2.104 100 Quebec vs.
Alberta among pop. 1 7.825 0.086 4 0.041***
within pop. 152 308.610 2.030 96 total 153 316.435 2.116 100 Quebec vs. New Brunswick among pop. 1 4.106 0.125 6 0.057** within pop. 111 226.787 2.043 94 total 112 230.894 2.168 100 Alberta vs. New Brunswick among regions 1 4.080 0.132 6 0.060** within regions 57 117.378 2.059 94 total 58 121.458 2.192 100
*significance was calculated with 999 permutations. *p < 0.05, **p < 0.01, ***p < 0.001. D.f. = Degree of freedom
2.4.3 Spatial genetic structure 2.4.3.1 Among Canadian provinces
Eleven clusters (K=11) were observed using the Bayesian approach of population structuring (BAPS software) (see Figs. 1a and b). Although there were a lot of admixtures, some geographic separation is visible. The colonies from Alberta formed two distinct clusters whereas the colonies from Quebec and New Brunswick formed several indistinct clusters (see figs. 2.2a and b). The TESS results indicated that there are two significantly different clusters observed in the colonies (lowest DIC = 3205.2 at K=11): a western cluster including all the colonies from Alberta and an eastern cluster including all the colonies from Quebec and New Brunswick (see fig 2.2c).
a)
b)
Figure 2.2 Estimated genetic structure of Crossocalyx hellerianus in Canada for K = 11 based on BAPS and TESS analyses. a) Cross-Canada results for the BAPS analysis; b) Zoomed in maps for each region showing the sampled populations; c) Results of the TESS analysis for Canadian populations. Population codes are described in Table 2.1. (the colors are not the same and cannot be compared between analyses. The green background shows the boreal forest cover)
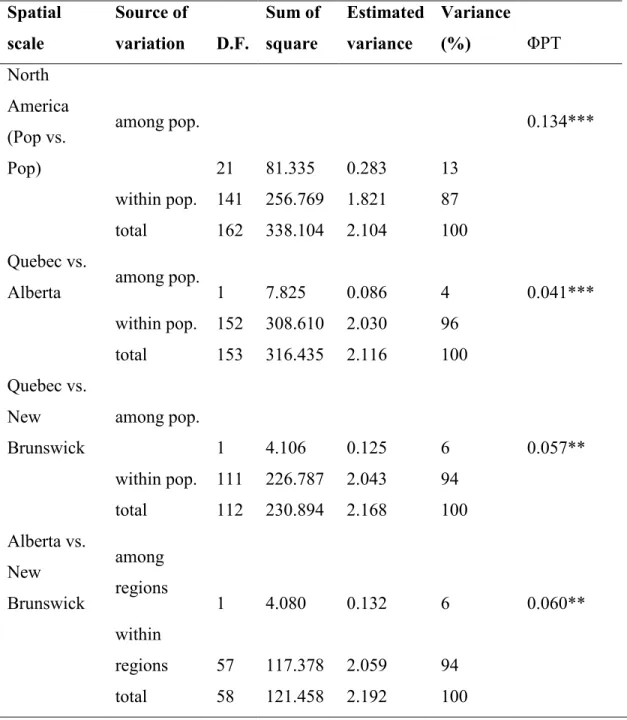
The Barrier analysis identified four strong barriers to gene flow among the populations (see Fig 2.3). There was a clear barrier separating western (Alberta) and eastern (Quebec and New Brunswick) populations with 100% bootstrap support (barrier B). In Alberta, the six populations were divided by another strong barrier (barrier A). In Eastern Canada, there was a strong barrier between populations from western Québec and those on the Boreal shield and a 98.9% bootstrap supported barrier between New Brunswick and the Gaspé Peninsula and the rest of the Quebec.
Figure 2.3 Mapped results from the barrier analysis indicating locations of barriers and their level of bootstrap support. (The green background shows the boreal forest cover)
2.4.3.2 Intercontinental
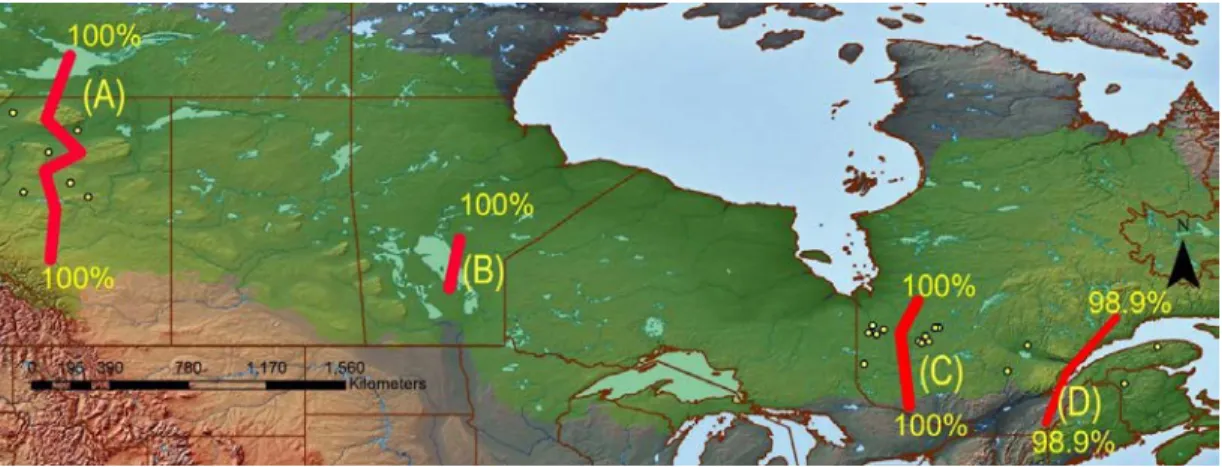
The TESS analysis comparing Canadian and European populations found three significant clusters [lowest DIC (10061) was observed at K= 24; see Fig. 2.4]: 1) Canadian cluster; 2) Czech Republic cluster; and 3) Finnish cluster. The results also indicated that the populations from the Gaspé Peninsula and New Brunswick were more closely related to the Czech Republic populations than other Canadian populations
Figure 2.4 Population genetic structure of Crossocalyx hellerianus populations from Canada, the Czech Republic, and Finland as estimated by TESS. Canadian samples finish with "CA", populations from the Czech Republic finish with “CZ” and populations from Finland finish with “FI”.
2.5. Discussion
While there are numerous studies of genetic differentiation and structure of bryophytes, particularly in Europe, little is known regarding these processes in North America. As per our knowledge, this is the first population genetic study of a Canadian boreal liverwort species. Despite the dominance of asexual reproduction, this species showed high genetic diversity, even at the colony and population levels. Similar levels of genetic diversity and molecular variance have been recorded for this species in Finland and the Czech Republic (Holá et al., 2015). A high level of genetic diversity is a well-observed phenomenon in bryophytes even at the population level (Holá et al., 2015; Korpelainen et al., 2011; Pohjamo et al., 2008). For example, similarly high levels of
genetic diversity have been observed in other dominantly asexual liverworts such as Trichocolea tomentella (Ehrh.) Dumort. (Pohjamo et al., 2008), and Barbilophozia attenuata (Nees) Loeske (Korpelainen et al, 2011), in the latter case for an area as small as 0.5 ha.
Several reasons may explain this high level of genetic diversity. One of the main explanations is that neutral somatic mutations play a major role in creating high genetic diversity in asexual species (Holá et al., 2015). A high number of cell divisions happen in somatic cells in gemmae producing species, providing a higher chance of mutations occurring during the DNA replication process. This can be one of the main reasons for the high variability of ISSR markers too. A second possibility is the accumulation of genotypes over a long period of time. This idea was raised in the studies of several bryophyte species such as the liverwort with dominant asexual reproduction, T. tomentella (Pohjamo et al., 2008), the pre-dominantly clonal moss Hylocomium splendens (Hedw.) Schimp. (Cronberg, 2002) and clonal flowering plant species like Circaea lutetiana L. (Verburg et al, 2000). Finally, some studies highlight that the high genetic diversity of bryophytes might be due complex demographic scenarios such as high mountain refugia (Désamoré et al., 2016).
In almost all the populations in Canada, the individuals of C. hellerianus are genetically unique, showing few genotypes among populations or regions. Similarly, no genotype was shared between populations separated by at least 4 km in Europe (Holá et al., 2015). These results suggest that recruitment from neighboring populations is a rare or unlikely event. Also, we observed few genotypes shared even between colonies a few meters apart within a single population. But we have observed three shared genotypes, two genotypes shared in populations in the Quebec Boreal Shield and one genotype shared between Alberta and Quebec which shows some evidence for long-distance dispersal capacity of the species. Similarly, the 3.219 Nm value provides evidence of dispersal of the species among regions.
Both of our spatial genetic structure analyses (BAPS and TESS) showed two main genetically distinct groups of C. hellerianus in Canada: a western group and an eastern group. A similar division was observed in a population genetic study of six Sphagnum species, two of them (S. angustifolium and S. quinquefarium) showed similar western and eastern differentiation (Kyrkjeeide et al., 2016a). That study was, to our knowledge, the only related vast range population study of Canadian bryophytes covering the boreal region (Kyrkjeeide et al., 2016a). Therefore, we also compared our genetic pattern with those obtained by phylogeographic and population genetic studies of boreal trees in North America. The genetic structure of common boreal tree species, Pinus banksiana Lamb. (Godbout et al., 2005), Picea glauca (Moench) Voss (De Lafontaine et al., 2010), P. mariana (Geŕardi et al., 2010) showed genetic differentiation of populations of western North America from populations of eastern North America, which was similar to the genetic structure of C. hellerianus determined in this study. The main explanation proposed for this genetic differentiation of western and eastern populations is that they originate from different glacial refugia (Godbout et al., 2005; De Lafontaine et al., 2010; Geŕardi et al., 2010). Additionally, P. mariana showed another genetic cluster in populations from Eastern coastal regions including the Gulf of St-Lawrence region (Geŕardi et al, 2010). It is noteworthy that the deadwood of these common boreal tree species are the main habitat for the epixylic liverwort we studied. So, it seems those tree species and the epixylic plant species living on them such as C. hellerianus follow similar population genetic structure patterns.
The genetic structure of C. hellerianus inside Quebec shows a disjunctive pattern with a lot of admixtures, but we identified a strong barrier against gene flow separating western Quebec from the boreal shield (central Quebec). Roi and Stringer (1976), described bryo-floristic regions in the North American boreal zone, and they have highlighted highly variable bryophyte species patterns in P. mariana stands in the
James Bay area. We found another strong barrier separating the six populations from Alberta into two, but we were unable to find any association of factors describing the pattern we observed. The pattern may be due to barriers generated by the observed disjunctive distribution pattern of C. hellerianus in western North America (Hong, 1996), or to the highly variable elevation of the sampling sites, or to origins from two geographically close glacial refugia.
We observed a genetic separation of the Gulf of St. Lawrence region from the rest of Quebec. This is supported by a strong barrier (Barrier D) against gene flow between these two regions in barrier analysis and similarly, the AMOVA results of the regions show that the genetic distance between C. hellerianus populations in New Brunswick and those of Alberta or Quebec is greater than the genetic distance between Alberta and Quebec. This observation can be due to four reasons: 1) glacial refugia or early deglaciation in the Gulf of St-Lawrence region, and Atlantic Canada compared to more western sites (Chauvin and LaSalle, 1985; Godbout et al., 2010); 2) the St-Lawrence River may act as a geographic barrier; 3) C. hellerianus in the Gulf of St.-Lawrence region and C. hellerianus in Quebec and Alberta have different origins similar to the different glacial origins of P. mariana in North America (Jaramillo Correa et al., 2004); 4) C. hellerianus in boreal Canada may have first established in the Gulf of St.-Lawrence region from a glacial refugium or from long distance spore dispersal if Europe was possibly a source and then dispersed gradually to Quebec and eventually Alberta. A study of the moss flora of the gulf of St.-Lawrence region suggested five migration and dispersal history patterns (Belland, 1987). According to Belland (1987), the largest group of disjunctive mosses support the idea of migrating from the south or surviving in the glacial refugia in Wisconsonian ice-free areas in the Gulf of St-Lawrence. A boreal bryophyte community with C. hellerianus was discovered in tropical montane forest in Mexico (Gradstein and Vana, 1994) which may support Belland's idea of southern to eastern migration pattern. Likewise, Godbout et al. (2010) studied more focusing at the Pinus banksiana populations from eastern Canada and
have identified a coastal glacial refugium in maritime Atlantic Canada. According to their spatial analysis of molecular variance, populations in the St-Lawrence region were identified as a genetically divergent group. So, these studies may explain the observation of genetically divergent C. hellerianus populations in the St.- Lawrence region in our study.
Our genetic structure analysis of C. hellerianus of Canada with European samples shows three significantly separated groups, the Canadian group, the Czech group, and the Finnish group. Although we observed a western and eastern Canadian separation before, when we analyze all the samples along with European samples, all the Canadian samples fell into a single group. In the meantime, we have observed that there is a genetic connection of C. hellerianus in the Gulf of St-Lawrence region to the samples of the Czech Republic. The genetic connection to Europe might be due to the migration of the species between Europe and eastern Canada (Kyrkjeeide et al., 2016a) or as a result of vicariance (Shaw, 2001). In a study of the dispersal of six Sphagnum species in the northern hemisphere, it was observed that five Sphagnum species belong to a single genetic group in eastern North America and Europe, suggesting that the Atlantic Ocean acts as a weak barrier for the dispersal of Sphagnum spores (Kyrkjeeide et al., 2016a). They have also observed that the wind pattern in the Atlantic Ocean supports the dispersal of spores than seeds of higher plants (Kyrkjeeide et al., 2016a). Correspondingly Sphagnum magellanicum Brid. and another eight Amphi-Atlantic moss species show evidence for high migration between Europe and North America (Désamoré et a.l, 2016; Kyrkjeeide et a.l, 2016b) Similarly, the studies of Stenøien et al., (2011), and Szövényi et al., (2008), showed evidence of the genetic connection between bryophytes in North America and Europe. Specifically, the genetic study of Sphagnum angermanicum Melin showed evidence of North American origin and the recent establishment of the species in Europe (Stenøien et al., 2011). A similar idea can be seen in the genetic study of the lichenized fungi Letharia vulpina (L.) Hue (Högberg et al., 2002). According to Frahm and Vitt (1993), two-thirds of bryophyte species are
shared between Europe and North America, and this similarity is even higher in Arctic and Boreal zones. These studies support our results showing the intercontinental migration of C. hellerianus between Europe and North America.
2.6. Conclusion
The results of our study provide for the first time some valuable population genetics insights on a liverwort species in Canada. Although we hypothesized low genetic diversity at the population-level due to limited dispersal capacity and asexual dominancy, we have observed that the populations of C. hellerianus are genetically diverse. This finding lends, support to the idea that asexually reproducing species can be as genetically diverse as sexually reproducing species. Additionally, it is important to understand the true mechanism behind the genetic diversity of clonal or asexually reproducing species. Factors, such as habitat specialty (limited to epixylic habitats) do not seem to have a critical effect on the genetic diversity of a liverwort species like C. hellerianus. Furthermore, the genetic structure of C. hellerianus in boreal North America seems to be shaped by post-glacial dispersal patterns, and these patterns are similar to the genetic structures of boreal tree species which become the substrate for C. hellerianus. By demonstrating high genetic variance in Quebec and Alberta, and showing biogeographic connectivity between North American and Europe, populations from the St- Lawrence region indicate potential migration and colonization patterns of C. hellerianus in Boreal North America. Further studies need to be done to assess the phylogeography of C. hellerianus to confirm this idea.