UNIVERSITÉ DU QUÉBEC À MONTRÉAL
NITROGEN A V AILABILITY AND TRANSFORMATIONS IN MISSISQUOI BA Y,
LAKE CHAMPLAIN: EFFECTS ON PHYTOPLANKTON COMMUNlTY STRUCTURE
AND CY ANOBACTERIAL BLOOMS
PH.D. DISSERTATION
PRESENTED
AS PARTIAL REQUIREMENT
FOR THE DOCTORATE IN BIOLOGY
BY
MARKJ. McCARTHY
Avertissement
La diffusion de cette thèse se fait dans le rèspect des droits de son auteur, qui a signé le formulaire Autorisation de reproduire et de diffuser un travail de recherche de cycles supérieurs (SDU-522- Rév.01-2006). Cette autorisation stipule que «conformément à l'article 11 du Règlement no 8 des études de cycles supérieurs, [l'auteur] concède
à
l'Université du Québecà
Montréal une licence non exclusive d'utilisation et de publication de la totalité ou d'une partie importante de [son] travail de recherche pour des fins pédagogiques et non commerciales. Plus précisément, [l'auteur] autorise l'Université du Québec à Montréalà
reproduire, diffuser, prêter, distribuer ou vendre des copies de [son] travail de rechercheà
des fins non commerciales sur quelque support que ce soit, y compris l'lntern~t. Cette licence et cette autorisation n'entraînent pas une renonciation de [la] part [de l'auteur]à
[ses] droits moraux nià
[ses] droits de propriété intellectuelle. Sauf entente contraire, [l'auteur] conserve la liberté de diffuser et de commercialiser ou non ce travail dont [il] possède un exemplaire.»L _
__ _
UNIVERSITÉ DU QUÉBEC À MONTRÉAL
DISPONIBILITÉ ET TRANSFORMATIONS DE L'AZOTE DANS LA BAIE
MISSISQUOI DU LAC CHAMPLAIN: EFFETS SUR LA STRUCTURE DE LA
COMMUNAUTÉ DE PHYTOPLANCTON ET SUR LES FLEURS D'EAU DE
CY ANOBACTÉRIES
THÈSE DE DOCTORAT
PRÉSENTÉE COMME EXIGENCE PARTIELLE
POUR LE DOCTORAT EN BIOLOGIE
PAR
MARK J. McCARTHY
study at UQÀM and conduct this project, and for providing monitoring data and comments on the text. I have no doubt that I was a challenge for his patience, and 1 appreciate his understanding and guidance. 1 also thank my proposai committee: Dr. Paul A. del Giorgio for his excellent comments, guidance, and use of his membrane in let mass spectrometer; and Dr. Wayne S. Gardner for his comments and support, and for analyzing ammonium samples. 1 am also deeply thankful for his kindness, mentorship, friendship, guidance, and encouragement over the last 13+ years. I have learned so much from him, and 1 will forever be indebted. Dr. Moritz Lehmann provided ftnancial support, guidance, comments on the text, and analyzed samples for isotopie composition of nitrate, and 1 am grateful for his involvement and discussions. Ors. Roxane Maranger and Charles Greer served on my synthesis exam committee, and 1 appreciate their time and thoughtful comments. 1 would particularly like to thank Alexandre Guindon, who translated the abstract to French and without whom this project would not have been possible, both from a scientific and persona( perspective. 1 also thank Drs. Steve Carini, Wally Fulweiler, Frank Jochem, Peter Lavrentyev, Hans Paerl, Thad Scott, Steve Wilhelm, and Clayton Williams for their friendship, support, and guidance over the years. lrina Moukina and Serge Paquet performed the phytoplankton counts, and 1 thank them for their assistance. My labmates at UQÀM, Jennifer Boisvert, Martine Camiré, Guillaume Cloutier, Catalina Gonzalez-Rueda, Pierre Marcoux, Dr. Alexandrine Pannard, Isabelle Roby, Genevieve Thibodeau, and Gabriela von Rückert Heleno were instrumental in the success of this project at various stages, and 1 appreciate ali of their assistance. 1 am also grateful to Catherine Beauchemin and Alice Parkes for analyzing nutrient samples and their assistance with the logistics of field work. Veronique Ducharme-Riel, Lisa Fauteux, and François Guillemette from the del Giorgio lab assisted with the membrane in let mass spectrometer, and 1 am grateful for their help. 1 would also like to thank Dr. Silvia E. Newell for her ongoing support, encouragement, love, and companionship, especially during the difficult writing phase. Finally, 1 would like to thank my parents and family for their incredible support during this mid-I ife career interruption. My sons, Jake, Eric, and Rian, inspire me every day, and I dedicate this dissertation to them.
TABLE OF CONTENTS
LIST OF FIGURES ... vii
LIST OF TABLES ... xi
RESUMÉ ... xiii
SUMMARY ... xiv
CHAPTER 1: GENERAL INTRODUCTION ... ! 1 .1. Background ... 1
1.1.1. Seasona1 phytoplankton dynamics in lakes-light, temperature, and N forms ... 7
1.1.2. Importance of.water column NH/ uptake and regeneration processes ... 12 1.1.3. Sediment-water interface nutrient fluxes and N transformations ... 16
1.2. Study site description ... 20
1.3. Approaches used ... 24
1.3.1. Ambient nutrients and phytoplankton community structure ... 24
1.3.2. Water column NH/ regeneration, potentia1 NH/ uptake, and N fïxation ... 25
1.3.3. Sediment-water interface nutrient fluxes, DNRA, 02 demand, and N transformations ... 26
1.3.4. Relationships between N transformations, ambient nutrients, and phytoplankton community structure ... 29
1.4. Summary: objectives and hypotheses ... 32
CHAPTER II: AMBlENT NUTRIENTS AND PHYTOPLANKTON COMMUNITY STRUCTURE IN MISSISQUOI BAY, LAKE CHAMPLAIN, 2006-2009 ... 36
2.1. Summary ... 36
2.2. Introduction ... 37
2.3. Materials & Methods ... .40
2.4. Results ... .41
2.4.1. Phosphorus in Missisquoi Bay ... .41
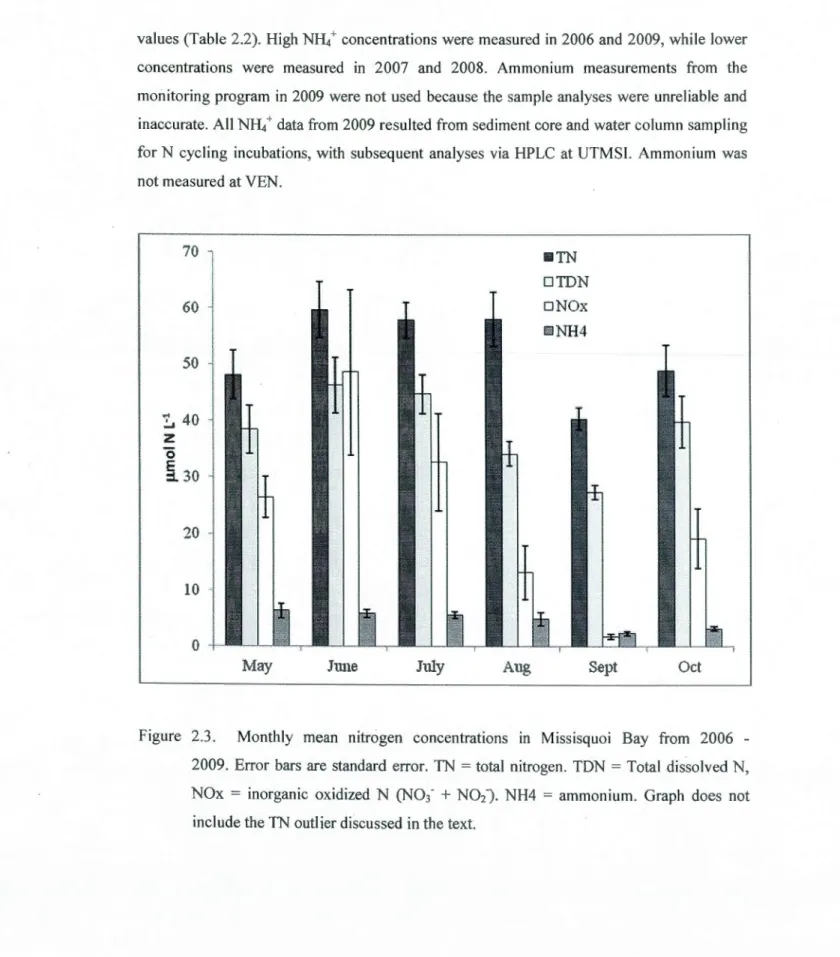
2.4.2. Nitrogen in Missisquoi Bay ... .44
2.4.3. Phytoplankton in Missisquoi Bay ... .47
2.5. Discussion ... 55
2.5.1. What are the trends of ambient nutrient concentrations during the growing season (May through October)? ... 57
2.5.1.1. Phosphorus ... 57
2.5.1.2. Nitrogen ... 59
2.5 .2. What are the dominant phytoplankton groups du ring the growing season? ... 61
2.5.3. Which N form in Missisquoi Bay is most conducive to growth ofthe dominant phytoplankton group? ... 65
-CHAPTER III: WATER COLUMN NITROGEN CYCUNG IN MISSISQUOI BA Y,
LAKE CHAMPLAIN ... 66
3.1. Summary ... 66
3.2. Introduction ... 67
3.3. Materials & Methods ... 70
3.4. Results ... 73
3.4.1. Water column characteristics and hydrochemistry ... 73
3 .4.2. Phytoplankton ... 73
3.4.3. Water column potential NH/ uptake ... 78
3.4.4. Water column NH/ regeneration ... 80
3.4.5. Water column N fixation ... 83
3.5. Discussion ... 86
3.5.1. Relationships between ambient conditions and phytoplankton ... 86
3.5.2. Water column potential NH/ uptake and autotrophy versus heterotrophy ... 88
3.5.3. Water column NH/ regeneration ... 90
3.5.4. Water co1umn N fixation ... 92
3.5 .5. Conclusion ... 93
CHAPTER IV: SEDIMENT-WATER INTERFACE NITROGEN TRANSFORMATIONS IN MlSSISQUOl BAY, LAKE CHAMPLAIN ... 94
4.1. Summary ... 94
4.2. Introduction ... 95
4.3. Materials & Methods ... 99
4.4. Results ... 1 03 4.4.1. Ambient conditions ... ! 03
4.4.2. SWI nutrient fluxes ... ! 04
4.4.3. DNRA and NIAF ... l 07 4.4.4. SOD ... 1 09 4.4.5. Net 28N2 flux ... ll 0 4.4.6. Potential denitrification (DNF) ... 1 Il 4.4.7. N03-source for denitrification ... ll4 4.4.8. Anammox ... 115
4.4.9. N fixation ... 115
4.5. Discussion ... ll8 4.5.1. Effects of bottom water hypoxia on SWI processes in July 2009 ... 119
4.5.2. Sediment SRP flux, bottom water hypoxia, cyanobacteria, and nutrient limitation ... 121
4.5.3. Sediment NOx fluxes relative toN transformation pathways ... 122 4.5.4. Importance of sediment NH/ flux to the N budget in Missisquoi Bay ... 124
VI
4.5.5. Does DNRA contribute to NH/ regeneration in Missisquoi Bay ... 126 4.5.6. SOD patterns relative toN transformations ... 127 4.5.7. N2 dynamics-denitrification, anammox, and N2 fixation ... l30 4.5.8. Conclusions ... 135 CHAPTER V: SYSTEM NITROGEN TRANSFORMATIONS AND THEIR EFFECTS ON NUTRIENTS AND PHYTOPLANKTON COMMUNITY STRUCTURE IN
MISSISQUOI BAY, LAKE CHAMPLAIN: SYNTHESIS OF RESULTS ... 137 5.1. Review of significant findings ... 137 5.2. Evidence for N limitation in Missisquoi Bay ... 140 5.3. Do nutrient dynamics control phytoplankton community structure? ... l41 5.4. Water column N cycling relationships with phytoplankton and ambient
nutrients ... 145 5.5. Links between SWI nutrient fluxes and phytoplankton community structure ... 147 5.6. Does denitrification affect N concentrations and ratios and contribute toN fixing
cyanobacteria blooms? ... l49 5.7. Preliminary N budget for Missisquoi Bay ... 152 5.8. Conclusion ... 154 REFERENCES ... 156
LIST OF FIGURES
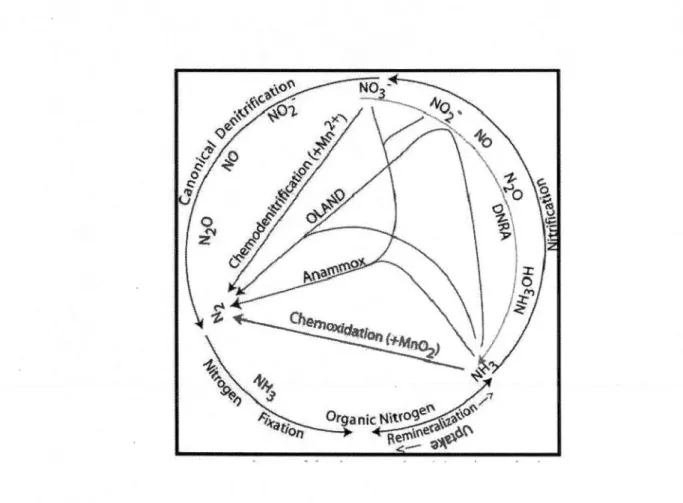
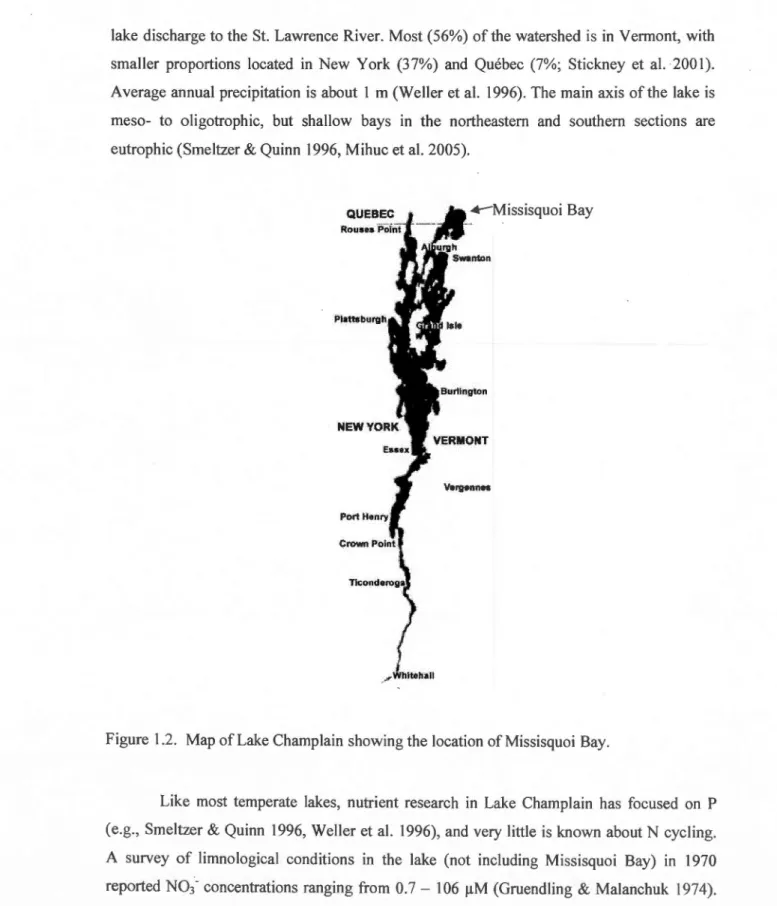
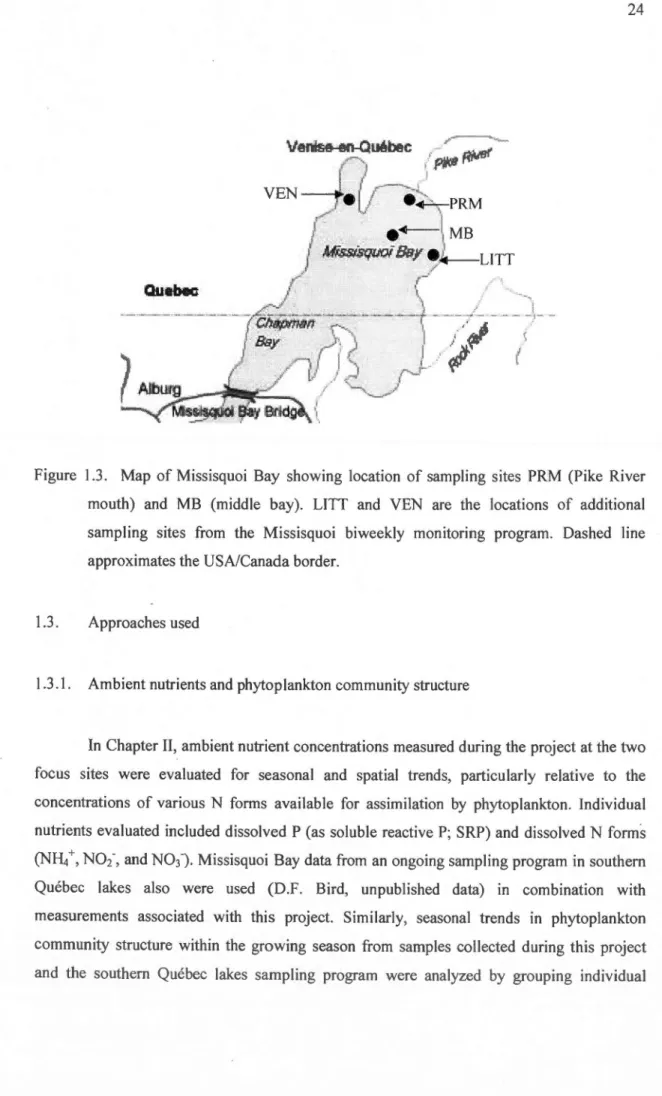
1.1 Conceptual diagram ofthe nitrogen cycle (from Brandes et al. 2007) ... 18 1.2 Map of Lake Champlain showing the location of Missisquoi Bay ... 21 1.3 Map of Missisquoi Bay showing location of sampling sites PRM (Pike River mou th) and MB (middle bay). LITT and VEN are the locations of additional sampling sites from the Missisquoi biweekly monitoring program. Dashed line approximates the USA/Canada border'. ... 24
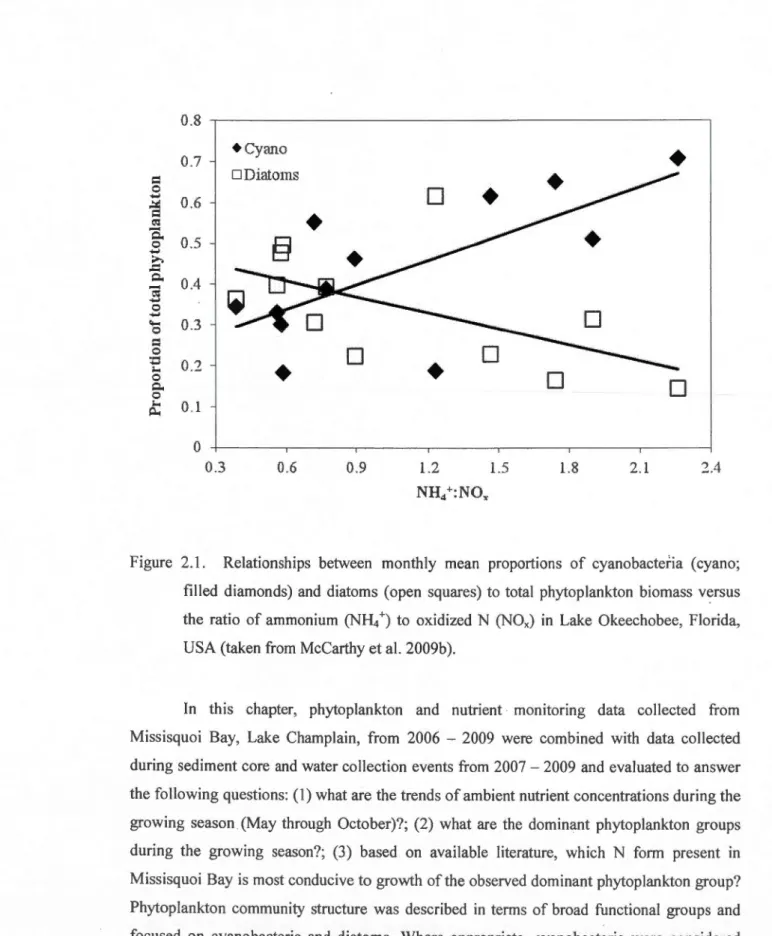
2.1 Relationships between monthly mean proportions of cyanobacteria (cyano; filled
diamonds) and diatoms (open squares) to total phytoplankton biomass versus the ratio of ammonium (NH/ ) to oxidized N (NOx) in Lake Okeechobee, Florida, USA (taken from McCarthy et al. 2009b) ... 39
2.2 Monthly mean phosphorus concentrations in Missisquoi Bay from 2006- 2009. Error
bars are standard error. Note that the number of observations for soluble reactive phosphorus (SRP) is much fewer than for total P (TP) and total dissolved P (TOP). Graph does not include the SRP outlier discussed in the text.. ... .43 2.3 Monthly mean nitrogen concentrations in Missisquoi Bay from 2006 - 2009. Error
bars are standard error. TN = total nitrogen. TON = Total dissolved N, NOx = inorganic oxidized N (N03.
+ N0
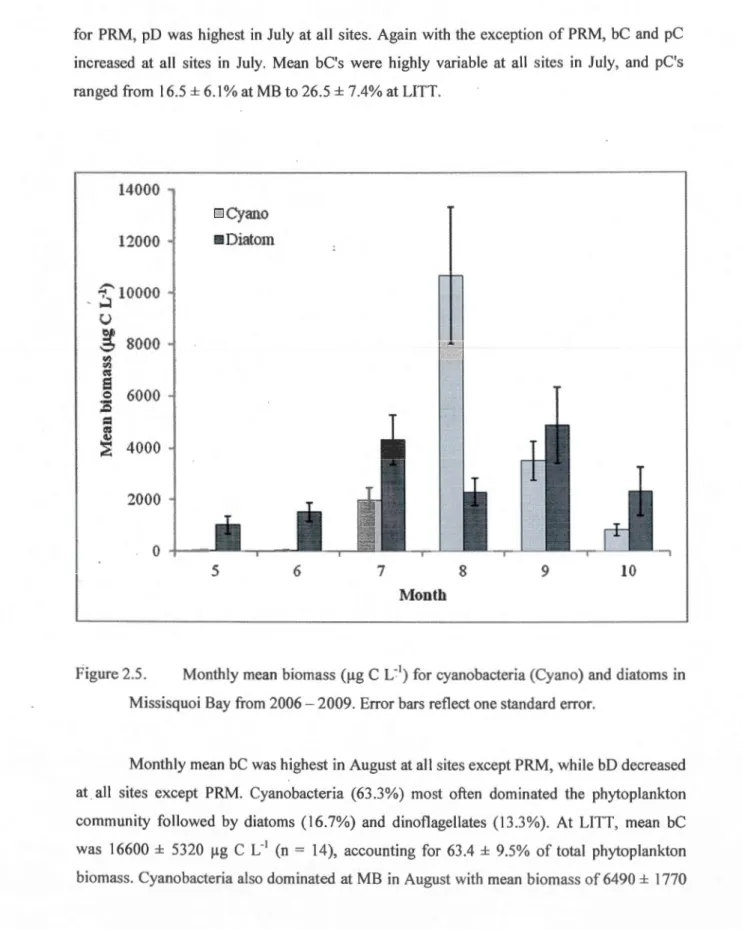
2'). NH4 =ammonium. Graph does not include the TN outlier discussed in the text.. ... .46 2.4 Monthly mean chlorophyll a concentrations in Missisquoi Bay from 2006 - 2009. Error bars reflect one standard error ... 482.5 Monthly mean biomass (!lg C L'1) for cyanobacteria (Cyano) and diatoms in
Missisquoi Bay from 2006- 2009. Error bars reflect one standard error ... 50
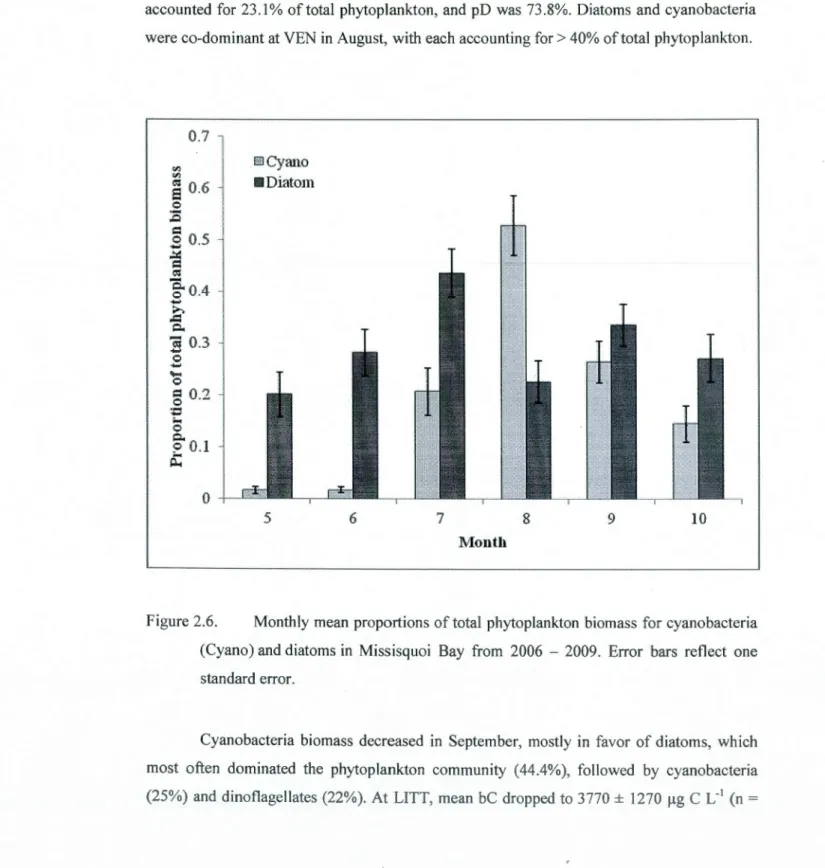
2.6 Monthly mean proportions of total phytoplankton biomass for cyanobacteria (Cyano)
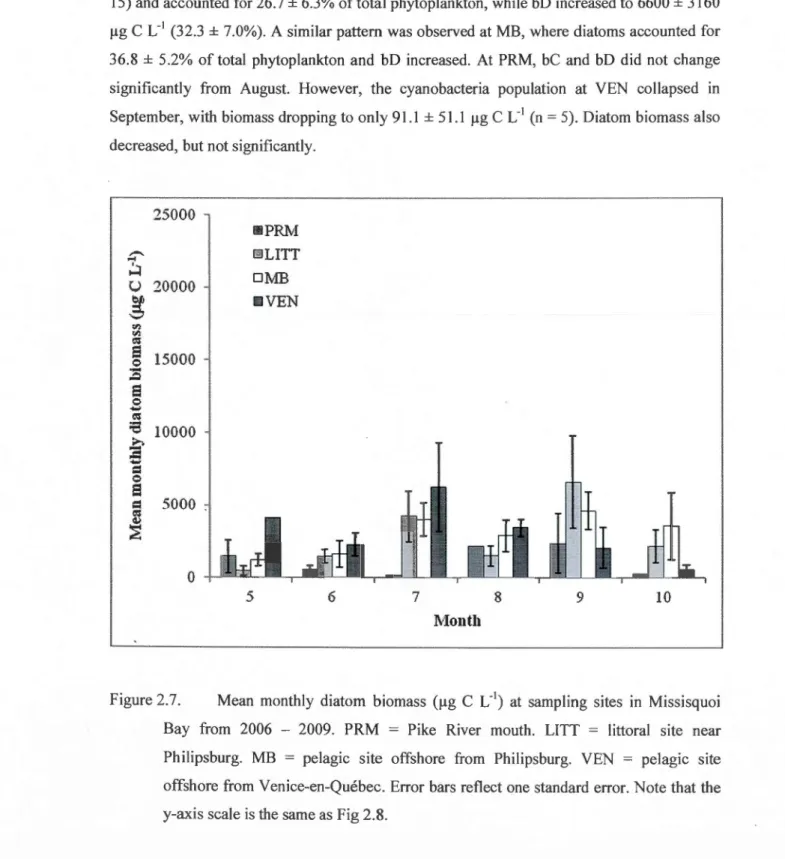
and diatoms in Missisquoi Bay from 2006 - 2009. Error bars reflect one standard error. ... 51 2.7 Mean monthly diatom biomass (!lg C L'1) at sampling sites in Missisquoi Bay from
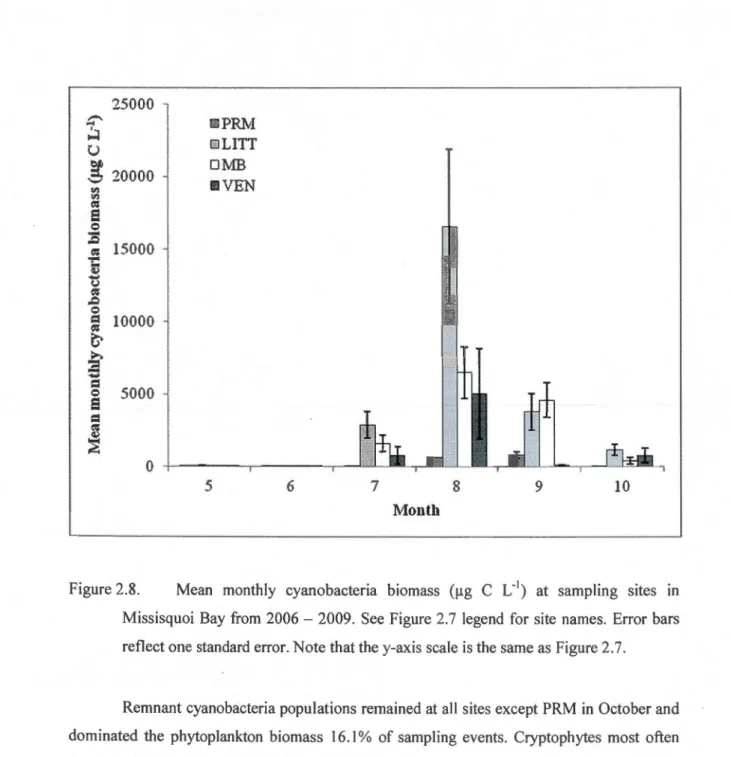
2006-2009. PRM = Pike River mouth. LITT= littoral site near Philipsburg. MB = pelagie site offshore from Philipsburg. VEN= pelagie site offshore from Venice-en-Québec. Error bars reflect one standard error. Note that the y-axis scale is the same as Figure 2.8 ... 52 2.8 Mean monthly cyanobacteria biomass (!lg C L'1) at sampling sites in Missisquoi Bay
from 2006 - 2009. See Figure 2.7 legend for site names. Error bars reflect one standard error. Note that the y-axis scale is the same as Figure 2.7 ... 53
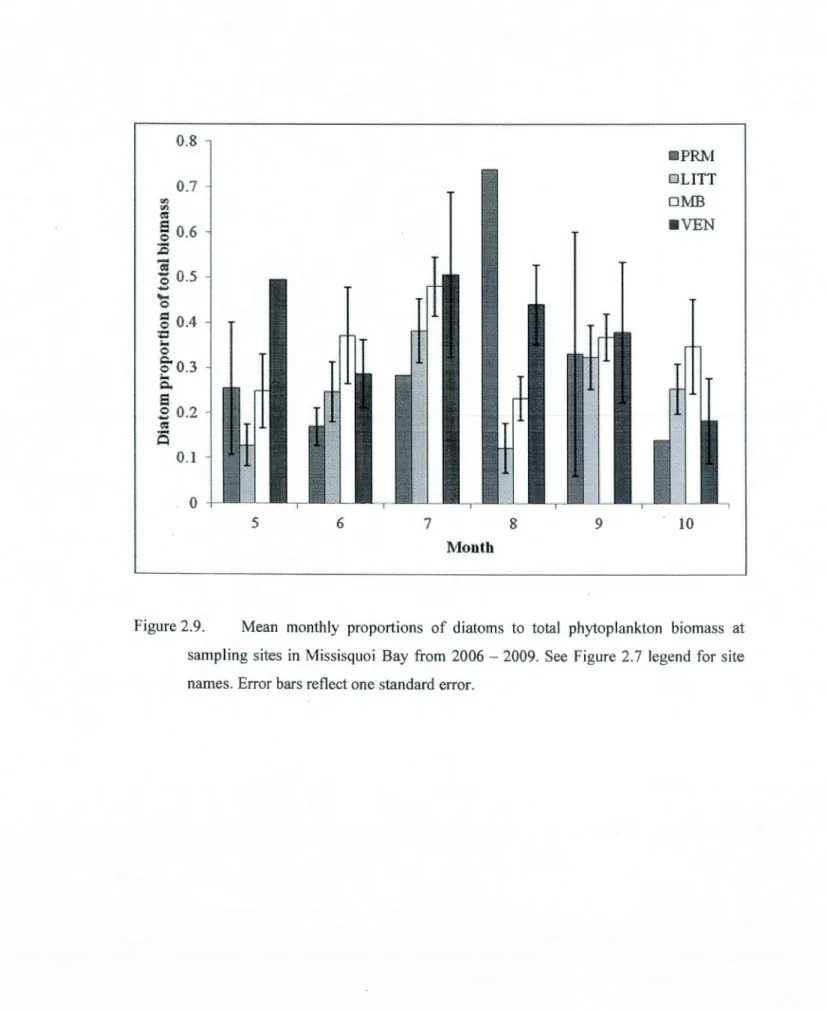
2.9 Mean monthly proportions of diatoms to total phytoplankton biomass at sampling
sites in Missisquoi Bay from 2006- 2009. See Figure 2.7 legend for site names. Error bars reflect one standard error. ... 54 2.10 Mean monthly proportions of cyanobacteria to total phytoplankton biomass at
sampling sites in Missisquoi Bay from 2006 - 2009. See Figure 2.7 legend for site names. Error bars reflect one standard error. Note that the y-axis scale is the same as for Figure 2.9 ... 55 3.1 Potentia1 NH/ uptake rates in light (L) and dark (D) water column incubations at the
Pike River mouth (PRM) in Missisquoi Bay, Lake Champlain. Error bars are one standard error. ... 79
VIII
3.1 Potential NH/ uptake rates in light (L) and dark (0) water column incubations at the Pike River mouth (PRM) in Missisquoi Bay, Lake Champlain. Error bars are one standard error. ... 79 3.2 Potential NH/ uptake rates in light (L) and dark (0) water column incubations in the
central basin (MB) of Missisquoi Bay, Lake Champlain. Error bars are one standard error. Note that the y-axis scale is the same as in Fig. 3.1 ... 80 3.3 NH/ regeneration rates in light (L) and dark (D) water column incubations at the
Pike River mouth (PRM) in Missisquoi Bay, Lake Champlain. Error bars are one standard error. Note th at the y-axis scale is the same as in Fig. 3 .1 ... 81 3.4 NH/ regeneration rates in light (L) and dark (0) water column incubations in the
central basin (MB) in Missisquoi Bay, Lake Champlain. Error bars are one standard error. Note that the y-axis scale is the same as in Fig. 3.1 ... 82 3.5 The ratio of light NH/ uptake (UL) to the mean of light and dark NH/ regeneration (Reg), which were not significantly different from each other, at the Pike River mouth (PRM) and central basin (MB) of Missisquoi Bay, Lake Champlain. Li ne is drawn at one, which reflects balanced uptake and regeneration. No incubation was conducted at MB on June 12, 2007, and regeneration was negative at MB on July 8, 2009 ... 84 3.6 Water column N fixation rates in filtered (0.2 IJ.m syringe filter; Control) and whole water samp1es from the Pike River mouth (PRM) in Missisquoi Bay, Lake Champlain. The rates in whole water incubations are not significantly different from those in the filtered controls, and the mean rate (0.1 0 ± 0.27 IJ.mol N L.1 h-1) is not significantly different from zero ... 85 3.7 Water column N fixation rates in filtered (0.2 IJ.m syringe filter; Control) and
whole water samples from the central basin (MB) in Missisquoi Bay, Lake Champlain. The rates in whole water incubations are not significantly different from tho se in the fil te red controls ... 86 4.0 Schematic diagram of the continuous-flow, intact sediment core incubation system (based on Lavrentyev et al. 2000) ... 1 00 4.1 Soluble reactive phosphorus (SRP) fluxes from sediments in Missisquoi Bay, Lake
Champlain, at the Pike River mouth (PRM) and central basin (MB) in 2007- 2009. Positive bars represent flux out of sediments, and negative bars represent flux from the water column into sediments. Error bars represent one standard error. ... 1 05 4.2 Nitrite (N02-) fluxes from sediments in Missisquoi Bay, Lake Champlain, at the
Pike River mouth (PRM) and central basin (MB) in 2007 - 2009. Positive bars represent flux out of sediments, and negative bars represent flux from the water column into sediments. Error bars represent one standard error. ... l 06 4.3 Nitrate (N03-) fluxes from sediments in Missisquoi Bay, Lake Champlain, at the Pike River mouth (PRM) and central basin (MB) in 2007 - 2009. Positive bars represent flux out of sediments, and negative bars represent flux from the water column into sediments. Error bars represent one standard error. ... l 08 4.4 Ammonium (NH/ ) fluxes from sediments in Missisquoi Bay, Lake Champlain, at the Pike River mouth (PRM) and central basin (MB) in 2007 - 2009. Positive bars represent flux out of sediments, and negative bars represent flux from the water column into sediments. Error bars represent one standard error. ... l 09
4.5 Sediment 02 demand (SOD) in Missisquoi Bay, Lake Champlain, at the Pike River mouth (PRM) and central basin (MB) in 2007 - 2009. Error bars represent one standard error. ... 1 1 1 4.6 Net 28N2 flux in control (Ctl) and potential denitrification (DNF) in
15
N03- enriched (N) cores from the Pike River mouth (PRM) in Missisquoi Bay, Lake Champlain. Positive net 28N2 flux suggests that denitrification exceeds N fixation, while negative flux suggests the opposite. Error bars represent one standard error. Note that the y-axis scale is the same as for Fig. 4.7 ... 112 4.7 Net 28N2 flux in control (Ctl) and potential denitrification (DNF) in
15
N03- enriched (N) cores from the central basin (MB) in Missisquoi Bay, Lake Champlain. Positive net 28N2 flux suggests that denitrification exceeds nitrogen fixation, while negative flux suggests the opposite. Error bars represent one standard error. Note that the y-axis scale is the same as for Fig. 4.6 ... 113 4.8 The ratio of 2
"N2
production (29) in 15NH/ enriched cores (possible anammox) topotential denitrification (DNF) in 15N03- enriched cores from the Pike River mouth (PRM) and central basin (MB) of Missisquoi Bay, Lake Champlain. This ratio estimates the proportion of total N2 production that may be from anammox. Error bars represent one standard error ofthree timepoints and duplicate cores (n = 6) ... 116 4.9 Nitrogen fixation rates calculated from isotope pairing in 15N03-enriched cores from
the Pike River mouth (PRM) and central basin (MB) of Missisquoi Bay, Lake Champlain. Error bars represent one standard error. Calculations did not result in positive values on 12 June 2007 at PRM and 27 Aug 2007 at MB ... 117 4.10 Ratio of N fixation (NF) to potential denitrification (DNF) in 15N03. enriched cores
from the Pike River mouth (PRM) and central basin (MB) in Missisquoi Bay, Lake Champlain. A ratio> 1 implies that sediment NF can offset )osses from microbial N sinks (denitrification and anammox). Isotope pairing calculations did not return positive values for NF on 12 June 2007 at PRM or 27 Aug 2007 at MB ... l 18 4.11 Relationships between sediment oxygen demand (SOD) and net NH4 + flux at the Pike
River mouth (PRM) and the central basin (MB) of Missisquoi Bay, Lake Champlain ... 129 4.12 Relationship between sediment oxygen demand (SOD) and potential denitrification
(DNF) in Missisquoi Bay, Lake Champlain (both sites are included). Note that SOD also was related to net 28N2 flux (not shown) ... I30 5.1 Relationship between monthly mean NH4:NOx and cyanobacteria biomass (bC) in the previous month in Missisquoi Bay, Lake Champlain ... 143 5.2 Relationship between monthly mean NH/ concentration (~-tM) and cyanobacteria
biomass (bC) in the previous month in Missisquoi Bay, Lake Champlain ... 144 5.3 Relationship between monthly mean NH/ concentration (~-tM) and proportion of
cyanobacteria biomass to total phytoplankton biomass (pC) in the previous month in Missisquoi Bay, Lake Champlain ... 145 5.4 Relationship between NH4:N0x and dark NH/ uptake (11mol N L-1 h-1
) at the Pike River mouth (PRM) in Missisquoi Bay, Lake Champlain ... 147 5.5 Relationship between water column N03. concentration (~-tM) and net N03- flux across the sediment-water interface in Missisquoi Bay, Lake Champlain (both sites are included). Note that negative rates indicate flux from the water column into sediments ... 149
x
5.6 Log relationship between sediment-water interface N03- flux and the proportion of cyanobacteria to total phytoplankton biomass (pC) from the previous sampling event in the central basin (MB) ofMissisquoi Bay, Lake Champlain ... l50 5.7 Relationship between dissolved inorganic N (DIN) concentration in the water column
and estimated denitrification (sum of net N2 flux and N2 fixation) in sediments in Missisquoi Bay, Lake Champlain (both sites are included) ... 151
number of measurements. TP = total P. TOP = total dissolved P. SRP = soluble reactive P. NIA = not measured. LITT = littoral site. MB = pelagie site. VEN = Venice-en-Québec site. PRM = Pike River mouth site ... .42 2.2 Summary of nitrogen (N) measurements in Missisquoi Bay in 2006 - 2009 by year
and sampling site. Ali concentrations are in f!mol N L-1• SE = standard error. n = number of measurements. TN =total N. TON = total dissolved N. NOx = dissolved inorganic oxidized N (N03-
+
N02"). NH4 = ammonium (NH/ ). N/A = not measured. LITT = littoral site. MB = pelagie site. VEN = Venice-en-Québec site. PRM = Pike River mou th site ... .45 3.1 Station depth, temperature, and dissolved oxygen (DO) concentrations at the PikeRiver mouth (PRM) and central basin (MB) sites in Missisquoi Bay, Lake Champlain. Temperature and DO are given for the water surface (s) and near-bottom (b). Low water depth (#)and DO(*) are noted. ND= no data ... 74 3.2 Ambient nutrient concentrations (in f!mol L-1) at the Pike River mouth (PRM) and
central basin (MB) sites in Missisquoi Bay, Lake Champlain. SRP = soluble reactive phosphorus. N03 =nitrate. N02 =nitrite. NH4 =ammonium. ND= no data ... 75 3.3 Biomass (b; in flg C L-1) and proportions (p) of total phytoplankton biomass for cyanobacteria (C) and diatoms (0) in Missisquoi Bay, Lake Champlain. The dominant phytoplankton group (Dom) is included. c = cryptophytes. p = dinoflagellates. d = diatoms. b = cyanobacteria. v = chlorophytes. * denotes data obtained within a few days before and/or after N cycling incubations ... 77 3.4 Summary of linear regression statistics for NH/ concentration with phytoplankton parameters at the Pike River mouth (PRM) in Missisquoi Bay, Lake Champlain. pC= proportion of cyanobacteria biomass to total phytoplankton biomass. bC = cyanobacteria biomass. pD = proportion of diatom biomass to total phytoplankton biomass. bD= diatom biomass. Ali relationships have negative slopes ... 88 4.1 Ratio ofN2 production from 15N03- versus 14N03- (15:14) in 15N03- enriched cores from the Pike River mouth (PRM) and central basin (MB) of Missisquoi Bay, Lake Champlain. Values represent the mean of three timepoints and duplicate cores, and SE is the standard error. ND = no data ... 1 14 4.2 Estimated N removal rates (flmol N m-2 h-1) via denitrification and anammox at the Pike River mouth (PRM) and central basin (MB) in Missisquoi Bay, Lake Champlain, determined by the sum of net N2 flux in control cores (28) and isotope pairing calculations of N2 fixation in
15
N03- enriched cores (NF). Isotope pairing calculations did not return a positive value for NF on 12 June 2007 at PRM and 27 Aug 2007 at MB. ND =no data ... 132 5.1 Preliminary N budget for the Pike River mou th (PRM) and central basin (MB) in Missisquoi Bay, Lake Champlain. Loss terms are water column (WC) NH/ uptake and estimated denitrification (DNF = net N2 flux + N2 fixation). At PRM, DNF was adjusted on the assumption that ali of the net DIN flux into the sediments was due to denitrification. This adjustment was not needed at MB because net DIN flux was out
Xli
adjusted on the assumption that ali of the net DIN flux into the sediments was due to denitrification. This adjustment was not needed at MB because net DIN flux was out of the sediments. Source terms were WC NH4 + regeneration for each site and estimated tributary load for the whole lake. Rate are expressed in mol N d-1 •••••••••• 153
RESUMÉ
L'objectif de l'étude était de déterminer la disponibilité de l'azote (N) et les transformations dans la colonne d'eau (WC) et l'interface eau-sédiments (SWI), et d'établir des liens avec les éclosions de cyanobactéries dans la baie Missisquoi du lac Champlain. Ces paramètres ont été évalués à l'embouchure de la rivière aux Brochets et dans le bassin central, afin d'obtenir un gradient environnemental pour étudier l'effet des décharges de nutriments sur le cycle de l'azote et la structure des communautés de phytoplancton (PCS). Les résultats portent à croire qu'en général, les nutriments ne limitent pas la productivité primaire, mais que l'azote peut la limiter à petite échelle. Contrairement à nos hypothèses, le phytoplancton semblait gérer les concentrations en nutriments, et non l'inverse. La PCS n'affectait pas la consommation en NH/ dans la WC. De même, le taux de régénération du NH/ dans la WC n'était pas relié à la PCS, ce qui réfute l'hypothèse que les cyanobactéries inhibent la régénération. Les sédiments agissaient comme un puits de N03-, tel que prédit, mais étaient aussi une source de NH.t +vers la WC, contrairement aux hypothèses. Une biomasse élevée de cyanobactéries était associée avec une relâche subséquente de N03- des sédiments, ce qui pourrait impliquer une stimulation de la nitrification. L'anammox explique de 6 à 10% de la production totale de diazote, mais la dénitrification en était le principal vecteur. Les taux de dénitrification étaient reliés à la concentration instantanée en azote de la WC, mais pas à ses fluctuations. On observe des relations similaires entre les flux de N03- dans les sédiments et la dénitrification avec la biomasse cyanobactérienne antérieure. Cela suggère que des concentrations inférieures en azote dans la WC, à la suite de floraisons de cyanobactéries, ont rendu possibles des taux de dénitrifications inférieurs. Les données ne corroborent pas l'hypothèse selon laquelle la dénitrification mènerait à des conditions propices pour les cyanobactéries fixatrices d'azote. Au contraire, les résultats suggèrent que les conditions propices aux cyanobactéries fixatrices d'azote causent une réduction des taux de dénitrification. Le lac était un puits net d'azote dans un budget préliminaire calculé en utilisant le cycle du NH/ dans la WC et les flux d'azote à I'SWI, comparés aux apports en azote estimés des affluents. Ces calculs révèlent une source d'azote « manquante», qui pourrait être la fixation d'azote dans la WC selon les résultats. Les taux observés de fixation d'azote dans la WC n'étaient pas différents de ceux des contrôles expérimentaux, mais même ces taux négligeables sont d'un ordre de grandeur plus élevé que ceux nécessaires pour combler l'azote« manquant».
Mots-vedettes : cycle de l'azote, cyanobactéries, dénitrification, eutrophisation, budget d'azote
SUMMARY
The study objective was to determine nitrogen (N) availability and transformations in the water column (WC) and at the sediment-water interface (SWI) and examine linkages to cyanobacterial blooms in Missisquoi Bay, Lake Champlain. These parameters were evaluated at the Pike River discharge into Missisquoi Bay and in the central basin to provide environmental gradients to study the effects of nutrient discharges on N cyctlng and phytoplankton community structure (PCS). Results suggested that nutrients generally did not limit primary productivity, but there was evidence that N limited productivity on fine scales. Contrary to hypotheses, phytoplankton appeared to control nutrients from the top down. PCS did not affect WC NH4 + uptake rates, but the proportion of cyanobacteria to total phytoplankton biomass affected the balance between autotrophic and heterotrophic ammonium (NH/ ) uptake. WC NH/ regeneration rates were not related to PCS, refuting the hypothesis that cyanobacteria would inhibit regeneration. Sediments were a N03. sink, as predicted, but also were an NH/ source to the WC, contrary to the hypothesis. High cyanobacteria biomass was related to future increases in sediment N03- release, which may reflect a stimulation of nitrification. Anammox may account for 6 - 10% of total N2 production, but denitrification was the dominant N2 pathway. Denitrification rates were related to WC N concentrations but did not affect future WC N concentrations. Similar relationships between sediment N03- flux and denitrification with previous cyanobacteria biomass suggest that lower WC N concentrations resulting from cyanobacteria blooms led to reduced denitrification. The data do not support the hypothesis that denitrification would lead to conditions suitable for N fixing cyanobacteria. In contrast, the results indicate that conditions suitable for N fixing cyanobacteria caused lower denitrification. The lake was a net N sink in a preliminary N budget prepared using WC NH/ cycling and SWI N fluxes compared to estimated N Joad from tributaries. These calculations indicate a 'missing' N source, which results suggest may be WC N fixation. WC N fixation rates were not different from experimental controls, although the insignificant rates were an order of magnitude higher than those required to account for the missing N source.
Key Words: budget
Algal blooms are affecting lakes throughout the world (e.g., Barmans et al. 2004, Paerl & Fulton 2006), and these blooms have increased public and government attention to these and other eutrophication-related issues. Sorne algal blooms produce toxins, which threaten public health and recreational usage of affected waters. Like other lakes in southern Québec, Missisquoi Bay, Lake Champlain, has exhibited annual summer algal blooms in recent years, and sorne blooms have been toxic, resulting in public health notices being issued (Giani et al. 2005, Rolland et al. 2005). Harmful algal blooms (HABs), and particularly th ose caused by cyanobacteria ( cyanoHABs), generally are associated with anthropogenic eutrophication (Paer! & Fulton 2006). Cyanobacteria are the oldest known oxygenic phototrophs (> 2.5 billion years), and blooms are a well-established indicator of eutrophication in aquatic systems. However, not ali eutrophication is anthropogenic in origin (e.g., James et al. 2003). HABs can be a natural phenomenon as weil, and historical records suggest that HABs have been described for centuries (Anderson et al. 2002). Harmful effects of eutrophication in aquatic systems include HABs (Heisler et al. 2008), oxygen depletion (e.g., Boesch et al. 2009), and altered food webs leading to decreases in exploitable resources (Vitousek et al. 1997). Global climate change is expected to exacerbate cyanoHABs wo rld-wide (e.g., Jeppesen et al. 2005, Paer! & Huisman 2008, 2009).
Toxins associated with HABs have been linked to wildlife death, seafood poisonings, and, in sorne rare cases, human death (Anderson et al. 2002). Toxic cyanoHABs also have inhibited water usage for human consumption and recreation (Paer! & Fulton 2006, Wang & Shi 2008). ln humans, cyanotoxins have been associated with primary liver tumors (Shen et al. 2003), and microcystins are the most common of these hepatotoxins in aquatic systems (Rolland et al. 2005). Microcystins also have been found in health-food industry dietary supplements formulated using cyanobacteria, prompting advisories to be issued by local health departments (Gilroy et al. 2000). These supplements recently were implicated in the
2
death from liver failure of a regular consumer (Dietrich et al. 2007). Microcystins also contaminated the water supply of a hemodialysis center in Brasil, and 50 patients receiving treatment at the center subsequently died of liver failure (Jochimson et al. 1998).
Definitions of eutrophication vary, but a common concept involves the increased productivity of a system due to increased nutrient inputs. Eutrophication has been described as "one of the foremost problems in protecting freshwater and coastal marine systems" (Schindler 2006). Sources of excess nutrients to watersheds and aquatic systems include treated and untreated sewage, agricultural runoff containing fertilizers, urban stormwater runoff, atmospheric deposition (e.g., Hicks 2007, Duce et al. 2008, Galloway et al. 2008, Elser et al. 2009), and groundwater in flow (Anderson et al. 2002, Smolders et al. 201 0).
Phosphorus (P) and nitrogen (N) are the nutrients associated with eutrophication in aquatic systems, and these nutrients are the targets of watershed management strategies to remediate affected systems. There has been intense debate in the recent literature about the necessity to manage N inputs in addition to the well-established strategy of managing P inputs (Schindler 1974, 1977). While sorne authors have supported the P-only nutrient management approach (Schindler et al. 2008, Bryhn & Hakanson 2009, Schelske 2009, Smith & Schindler 2009, Wang & Wang 2009, Welch 2009), many others have challenged the wisdom of failing to consider N in nutrient management strategies aimed at alleviating the harmful effects of eutrophication (Paer! et al. 2004, Jeppesen et al. 2005, Howarth & Paer! 2008, Lewis & Wurtsbaugh 2008, Stemer 2008, Conley et al. 2009, McCarthy et al. 2009b, Paer! 2009, Scott & McCarthy 201 0). The P-only nutrient management approach is based on the assumption that atmospheric N can be fixed to alleviate any N limitation of primary production (e.g., Schindler & Hecky 2009). The P-only approach fails to account for the fact that N fixation is energetically unfavorable compared to ali other N assimilation strategies and, thus, is unlikely to reverse N limitation (e.g., Paer! 1990). This assumption also has been challenged in the very study that led to the theory (Scott & McCarthy 201 0). ln this challenge, the authors contend that N fixation in the study lake has failed to reverse N limitation. lnstead, N limitation has become more severe, phytoplankton biomass has decreased, and total N concentrations have decreased since N fertilization was stopped.
These nutrient limitation paradigms are based on the Redfield ratio, which posits that the nutrient requirements of organisms in nature mirror the ratios of these elements within their biomass and surrounding environment (Redfield 1958). The molar C:N:P ratio in organisms and deep sea waters observed by Redfield was 106:16:1. Carbon control of eutrophication was dismissed due to air/water exchange of carbon dioxide preventing lon g-term carbon deficiency in natural systems (Schindler 1977). In terms of N and P, a molar ratio above 16 retlects excess N compared toP, and, thus, P would limit the productivity of the system. Conversely, a ratio below 16 retlects excess P versus N and, thus, N limitation of primary production. The P-only nutrient management approach argues that controlling N inputs can lead to N fixing cyanobacteria blooms (e.g., Flett et al. 1980). White this is an intuitive conclusion, it fails to consider that many cyanoHABs are caused by non-N-fixing cyanobacteria genera, such as Microcystis, which is often toxic. These genera also are notable for their preference and high competitive abilities for reduced N compounds (Kappers 1980, Blomqvist et al. 1994, Hyenstrand et al. 1998a, 1998b), which are common in anthropogenic runoffand also are produced by organic matter and oxidized N recycling processes.
The Redfield ratio-based nutrient limitation paradigm is not universal (e.g., Elser et al. 1990; Downing & McCauley 1992; Guildford & Hecky 2000; Sagrario et al. 2005; Jeppesen et al. 2007), and recent work stresses evaluation of systems as individual entities rather than potentially representative systems (Moss et al. 1997; Hameed et al. 1999; Kilinc & Moss 2002). N limitation in freshwater sysJems seems to occur more often in eutrophie systems with high P loading (Downing & McCauley 1992). However, P loading reductions atone do not always lead to improved water quality and mitigation of eutrophication (Sagrario et al. 2005). A review of nutrient limitation studies in North American lakes concluded that the rotes of N and P in limiting phytoplankton growth have not been constrained sufficiently and suggested that N has a more important rote as a limiting nutrient than previously recognized (Eiser et al. 1990). This review also concluded that, "Little support can be found in these results for the conventional wisdom that P is the predominant primary lill)iting nutrient in freshwater, with N functioning largely as a secondary limiting factor in special situations." Other studies have shown that N has a greater potential than C02
4
and Si to affect phytoplankton community structure (Huszar & Caraco 1998). A recent review of the P limitation paradigm (Stern er 2008) concluded that:
" ... at time and space scales relevant to population growth, multi-resource control is the rule, not the exception and this view should at !east be part of the paradigm of nutrient limitation of lakes. Primary producers in lakes are not regulated on day-ta-day ti me scales by sole/y or even main/y by P. 1 further be lieve that though there is logical reasoning behind it, the paradigm for phosphorus limitation of who le lakes at multi-annual sc ales needs further examination, particularly in reference to eutrophie and other habitats. Many years after the carbon vs. phosphorus controversy was successfully resolved there still are relevant and interesting unanswered questions about limitingfactors at different scales infreshwaters."
Nutrient recycling and subsequent internalloading from sediments can exacerbate the ecosystem effects of eutrophication (Bai ley & Hami Iton 1997, Hansen et al. 1997, Berelson et al. 1998), even after extemal loading reductions have been implemented (Burger et al. 2007, Jeppesen et al. 2007). Non-N-fixing cyanobacteria are capable of storing excess P during sedimentary phases (Pettersson et al. 1993), and this excess P is used during pelagie growth periods, which results in unbalanced and higher N versus P uptake (e.g., Ahn et al. 2002). Other major environmental issues, such as climate change, habitat fragmentation, and biotic exploitation have led to loss of resilience of lakes to increased nutrient inputs and expedited eutrophication (Gulati & van Donk 2002). The efficient recycling of nutrients, complicating factors leading to loss of resiliency, relative rarity of N fixation in nature, and ability of cyanobacteria to out-compete other genera for reduced N argue for consideration of comprehensive nutrient management plans, which include P input reductions and, at a minimum, an evaluation of the feasibility and potential effects of a combined N and P management approach.
The relationships between anthropogenic eutrophication and cyanoHABs have led to extensive research to further our understanding of the consequences of unmitigated nutrient inputs. In marine systems, these studies often focus on N, because it is generally assumed to be the primary limiting nutrient in these systems (e.g., Howarth & Marino 2006, Howarth
2008). However, eutrophication studies in freshwater systems have focused on P, which has created a dichotomy in research along the freshwater to marine continuum (Elser et al. 1990, Gu et al. 1997). This dichotomy has resulted in significant information gaps with respect toP cycling in marine systems and N cycling in freshwater systems. These information gaps invoke numerous questions regarding the importance ofN in the eutrophication offreshwater systems, and sorne of these questions are the focus of this thesis and are addressed in the following chapters:
Chapter II
Chapter III
Chapter IV
Chapter V
What are the seasonal dynamics of ambient N fonns and phytoplankton community structure in Missisquoi Bay?
What are the seasonal rates of water column N transformations in Missisquoi Bay?
What are the seasonal rates of sediment-water interface N transformations in Missisquoi Bay?
How do relationships between these various processes interact to detennine phytoplankton community structure?
Chapter II involves describing basic characteristics related to the ecology of Missisquoi Bay, such as identifying the dominant phytoplankton groups within the growing season, the seasonal dynamics of in-lakeN availability, and the most conducive N form for growth of the dominant phytoplankton group or groups (e.g., von Rückert & Giani 2004, McCarthy et al. 2009b ). These basic ecological characteristics fonn the basis of the questions and hypotheses addressed in subsequent chapters and use data obtained from biweekly sampling ofwater quality and biological parameters conducted independently of the sampling and experiments described in this thesis.
- - - --
-6
In Chapter III, water column N transformations are evaluated, primarily with respect to the uptake and regeneration of ammonium (NH/; e.g., McCarthy et al. 2009a), which represents the most bioavailable N form for primary producers ( e.g., McCarthy et al. 1977). These transformations were evaluated using isotope dilution techniques and high performance liquid chromatography (HPLC; Gardner et al. 1995a). The potential for N2 fixation by specialized organisms, particularly during times when N may be limiting system productivity, also was evaluated using a novel combination of water column incubations and dissolved gas analyses via membrane inlet mass spectrometry (MIMS; Kana et al. 1994, 1998, An et al. 2001).
Chapter IV focuses on ·sediment-water interface (SWI) N transformations mediated by microbes and affecting N forms available to primary producers. These transformations include dissimilatory nitrate (N03-) reduction to NH/ (DNRA; e.g., An & Gardner 2002, Gardner et al. 2006, Burgin & Hamilton 2007), denitrification (e.g., Seitzinger 1988), anaerobie NH/ oxidation (anammox; e.g., Mulder et al. 1995), and heterotrophic N2 fixation (e.g., Fulweiler et al. 2007). In addition, sediment oxygen (02) demand (SOD) and net nutrient fluxes were evaluated. Nutrient fluxes included soluble reactive P (SRP), N03-, nitrite (N02-), and NH/ . Nitrification was not measured directly but could be inferred in relation to its coupling to denitrification and from SWI nutrient fluxes. Microbial N transformations, SOD, and nutrient fluxes at the SWI were evaluated using continuous-flow incubations of intact sediment cores (e.g., Lavrentyev et al. 2000) combined with colorimetrie nutrient analyses, HPLC, and MIMS.
Chapter V synthesizes the limnological data in Chapter Il and the rate measurements in Chapters III and IV to: (J) infer the nutrient limitation status of primary producers; (2) determine relationships between ambient nutrients and phytoplankton community structure; (3) determine relationships between ambient nutrients, phytoplankton community structure, and water column N transformation rates; and (4) determine relationships between ambient nutrients, phytoplankton community structure, and SWI N transformation rates.
The following sections review the state of knowledge associated with each of these chapters and provide a theoretical basis for the hypotheses, methods, and interpretations. The approaches used to examine the questions and hypotheses will be summarized, and a description ofthe study site and rationale for sampling site selection will be presented.
1.1.1. Seasonal phytoplankton dynamics in lakes --- light, temperature, and N forms
Phytoplankton communities are affected by numerous physical and geochemical properties in aquatic systems. Although phytoplankton often are grouped into taxonomie units based on morphology and functional characteristics ( e.g., Reynolds 1997) based on 1 ight and nutrient acquisition strategies, others have suggested that cell size and shape may be better predictors of phytoplankton response to physico-chemical conditions (Huszar & Caraco 1998). ln the case of diatoms and cyanobacteria, which are often dominant 10 temperate lakes at different times, cell s1ze and shape and light and nutrient acquisition strategies tend to differ significantly. For example, size-fractionated communities often represent diatoms in larger fractions(> 2 !lm) and picocyanobacteria in the small fractions(< 2 f!m), particularly in marine systems (e.g., Hutchins et al. 2003, L'Helguen et al. 2008).
Responses of these broad phytoplankton groups also differ with respect to light fluctuations and intensity. For example, freshwater diatoms dominated the phytoplankton community and grew fastest in culture when light intensities fluctuated, particularly at low average light intensities (Litchman 1998). However, cyanobacteria dominated and grew fastest in culture at constant and high light intensities. Similar results have been reported in natural systems (Zhang & Prepas 1996). Diatoms also may assimilate inorganic N in the dark by using excess carbon fixed during light-replete conditions, when N03- assimilation cannot keep up with carbon fixation (Clark et al. 2002). These morphological characteristics provide diatoms with an advantage during the more physically dynamic conditions found in lakes in spring. These same physical conditions in spring (i.e., turbulent water columns) can neutralize the ability of sorne cyanobacteria to control buoyancy to maximize light acquisition near the water surface (Hunter et al. 2008). Severa! studies also suggest that light availability and competition plays a role in community succession within the cyanobacteria.
- - - --- - - -- - -
-8
For example, when Microcystis is dominant in summer, taxie strains can be out-competed by non-taxie strains for light (Kardinaal et al. 2007), which leads to a succession from taxie to non-taxie strains due to self-shading by the bloom. Also, N-fixing cyanobacteria were more numerous than non-N-fixing cyanobacteria during low light conditions and vice versa in a Brasilian reservoir (Soares et al. 2009), but this finding is opposite most of the literature regarding light and cyanobacteria community structure ( e.g., Havens et al. 2003).
Temperature also affects phytoplankton community dynamics, with diatoms better able to initiate or continue growth at temperatures below 15 OC (Zhang & Prepas 1996, Butterwick et al. 2005) and cyanobacteria dominating at temperatures> 21 OC (McQueen & Lean 1987). Diatoms are known to take up excess N03-and grow faster than other groups at lower temperatures (Lomas & Glibert 1999b ), and it was hypothesized that the non-nutritional N03- uptake could be reduced intracellularly to N02- or NH/ to modulate photosynthetic electron flow during turbulent conditions (Lomas & Glibert 1999a). ln contrast, low temperatures inhibit cyanobacteria growth by inactivation of transporters required for oxidized N to traverse the cell membrane prior to assimilation (Sakamoto & Bryant 1999). At high temperatures, taxie Microcystis aeruginosa strains grew faster than non-taxie strains (Davis et al. 2009), which may give these taxie strains an advantage by reducing grazing pressure (Gabier et al. 2007) and maximizing growth rates in a warming climate (Paerl & Huisman 2008, 2009, Wagner & Adrian 2009).
The N form available to phytoplankton communities plays a maJor role in determining phytoplankton community structure (Giigora et al. 2007, McCarthy et al. 2009b). ln the case of diatoms and cyanobacteria, there is extensive evidence in the literature suggesting that diatoms are more competitive for oxidized N forms (i.e., N03-and N02-) than cyanobacteria (e.g., Presing et al. 1999, Kudela & Dugdale 2000, Hutchins et al. 2003, Ornolfsdottir et al. 2004, van der Grinten et al. 2004, Horgan 2005). Conversely, cyanobacteria are more competitive for reduced N forms (i.e., NH/ and urea) than diatoms ( e.g., Kappers 1980, Blomqvist et al. 1994, Hyenstrand et al. 1998a, Hyenstrand et al. 1998b, Horgan 2005). Analysis of a long-term dataset from Lake Okeechobee (Fiorida), a very large, shallow, eutrophie lake, revealed that the proportion of cyanobacteria to total phytoplankton
was related positively to the ratio ofNH/ to NOx (McCarthy et al. 2009b). At the same time,
diatom proportion was negatively related to NH/ :N03-.
Despite the vast literature on these differences inN assimilation capacity, there have
been very few studies conducted where cyanobacteria and diatoms were in direct competition
for nutrient resources. These few studies support the circumstantial observations described
above. For example, diatoms out-competed cyanobacteria in N-limited biofilms (i.e., lowest
N03- treatment; van der Grinten et al. 2005). In Lake Erken (Sweden), cyanobacteria were
unable to compete with eukaryotic algae (i.e., diatoms) for N03-, white NH/ availability
promoted cyanobacteria dominance over other phytoplankton groups (Blomqvist et al. 1994). Another compelling example ofthis phenomenon was reported for Acton Lake (Ohio), where
diatom-dominated phytoplankton communities used more N03- relative to NH/ , and
cyanobacteria-dominated communities used more NH/ relative to N03- (Horgan 2005). This
pattern also holds for marine phytoplankton. Continuous inputs of N03- caused a
phytoplankton community shift from cyanobacteria to diatoms, and urea availability resulted
in an increase in picocyanobacteria proportions (Hutchins et al. 2003). In the Baltic Sea, the
disappearance of diatoms coincided with undetectable N03-concentrations and lowest N0
3-uptake rates, while cyanobacteria were associated with highest NH/ and urea uptake rates
(Berg et al. 2003). Other than diatoms, none of the other phytoplankton groups evaluated (dinoflagellates, cyanobacteria, cryptophytes) appeared to be using N03-at ali. Most recently,
a mesocosm study found that reduced N additions stimulated non-N-fixing cyanobacteria and
cyanotoxin production (Donald et al. 2011).
With very few exceptions, bioassays conducted to evaluate nutrient limitation in aquatic systems have used N03-as the N source (e.g., Aldridge et al. 1995, Phlips et al. 1997, Piehler et al. 2009). This trend is presumably based on the frequent observation that oxidized N concentrations exceed reduced N concentrations and the subsequent misinterpretation that relative abundance equates to importance in the system. In fact, the opposite is probably true, whereby those substrates present in lowest quantities are the most important (e.g., Glibert et al. 1982). Therefore, the focus of research efforts should be on substrates present in lower concentration, because these substrates are assimilated and recycled the fastest. The result of
10
this misapplication of von Liebig's Law of the Minimum (c.f., de Baar 1994) has likely been a gross under-estimate of potential N limitation in aquatic systems, particularly freshwater systems, where cyanobacteria represent dominant or significant proportions of total phytoplankton. However, using only NH/ as the N source in nutrient limitation bioassays may select against diatoms, so a mixed N03- and NH/ addition (and perhaps organic N forms, such as urea) would be ideal for evaluating nutrient limitation.
These differences in competitive outcomes have a physiological basis and result from a genetic cascade that must be initiated and completed before cyanobacteria can assimilate oxidized N forms. First, iron is a vital component of N03- and N02- reductases in phytoplankton (North et al. 2007), and these enzymes are required to reduce oxidized N to NH/, which can then be assimilated into biomass (Syrett 1981 ). Thus, iron deficiency can inhibit N03- and N02- assimilation in phytoplankton, and approximately five times as much energy is required for oxidized N assimilation versus NH/ (Vallino et al. 1996). This higher energy requirement is primarily due to the need for active transport of oxidized N forms ac ross the ce li membrane and intracellular reduction to NH/ (Lindell & Post 2001 ). In fact, sorne cyanobacteria lack (e.g., Garcia-Femandez et al. 2004) or have lost (e.g., Miller & Castenholz 2001) the ability to assimilate oxidized N altogether.
Nitrogen control in cyanobacteria in regulated by NtcA, a 222-amino acid protein homologous to E. coli CAP (catabolite activator protein) and a transcriptional regulator of genes involved in N metabolism and ce li differentiation (Herrero et al. 2001 ). NtcA is encoded by ntcA, a positive-acting element required for expression of genes regulated by N. Nitrogen status in cyanobacteria is sensed by the cells as changes in the 2-oxoglutarate pool, which reflects the cellular carbon-nitrogen balance, rather than the presence ofNH/ (Herrero et al. 2001). 2-oxoglutarate is involved in cellular N incorporation within the glutamine synthetase (GS)/glutamate synthase (GOGAT) pathway responsible for incorporating NH/ into carbon skeletons (Flores & Herrero 2005). Th us, positive control of ntcA on other genes
first requires cellular recognition of insufficient NH/ assimilation into cell tissue and subsequent increases in ntcA gene transcription above basal levels (Lindell & Post 2001 ). NtcA has been fou nd in ali cyanobacteria genera evaluated to date, and quantification of ntcA
gene expression has been used to evaluate the N status of wild cyanobacteria populations (Lindell & Post 2001, Lindell et al. 2005, Pen no et al. 2006, Junier et al. 2007).
Once the cell senses insufficient NH/ assimilation, a N deficiency response is initiated, which starts with transcription of ntcA above basal levels (Lindell & Post 2001 ). The next step is ntcA-promoted induction of genes encoding high affinity transport mechanisms involving NH/ and methyi-NH/ permeases, which allow passive diffusion across the cell membrane (Muro-Pastor & Florencio 2003). These permeases allow cellular recapture of NH/ released or leaked into the surrounding water. Activation of genes encoding proteins required for assimilation of N02-, N03-, urea, and amino acids follows at higher transcription levels of ntcA (Herrera et al. 2001 ). ln response to the higher energy requirements for assimilation of alternate N sources, cell growth decreases in favor of synthesis of the proteins required for continued assimilation of these non-NH4 + substrates. Ali ofthese cellular responses toN deficiency are ceased ifNH/ becomes available (Lindell & Post 2001 ). Th us, it could be argued th at cyanobacteria assimilating any N form other than NH/ are actually experiencing N limited growth.
The final response toN deprivation depends on the ability of the cyanobacteria to fix atmospheric N2 or not. Once ali externat, readily available N sources are exhausted, N-fixing genera undergo cellular differentiation to produce heterocytes, which are specialized cells that provide the anoxie environment required for nitrogenase-mediated N fixation (Zhang et al. 2006). Heterocyte differentiation is control led by ntcA in cyanobacteria, and resumption of assimilation of other N sources, especially NH/, will hait formation and activity of heterocytes (Valladares et al. 2008). For non-N-fixing cyanobacteria genera, the cell begins to degrade phycobiliproteins, resulting in chlorosis and loss of chlorophyll (Wyman et al. 1985). Chlorosis can sustain minimal cell growth for a short period of time, but cell growth ceases once ali internai and externat N sources are exhausted.
lt is clear from the literature that the N form available to phytoplankton plays a critical role in determining the competitive outcomes and phytoplankton community structure observed in aquatic systems. The purpose of Chapter )[ is to evaluate ambient N availability
12
and phytoplankton community structure relative to literature-predicted outcomes (i.e., what is the preferred N form for the phytoplankton community present at temporally and spatially explicit sampling events?). However, the effects of other factors, such as light, temperature, and micronutrients, also must be considered but are mostly beyond the scope of this project.
1.1.2. Importance ofwater column NH/ uptake and regeneration processes
Primary producers convert atmospheric or dissolved carbon dioxide to organ1c matter. Phytoplankton and bacteria assimilate nutrients as part of this process, and measurements of nutrient uptake are key components of primary productivity models and estimates. The concept of nutrient limitation began with von Liebig's Law of the Minimum (reviewed by de Baar 1994):
"When a given piece of land contains a certain amount of al! the mineral constituents in equal quantity and in an available form, it becomes barr en for any one ki nd of plant when, by a series of crops, only one of these constituents - as for example soluble si !ica- has been so far removed, that the remaining quantity is no longer sufficient for a cr op. "
This concept was extended by Brandt (1899; cited in de Baar 1994), who chose N as the common limiting nutrient for marine algae. This single-limiting nutrient hypothesis was quickly challenged by Nathansohn (1908; cited in de Baar 1994), who suggested that there is a difference between "maximal rate of production" (i.e., production is controlled by a single chemical factor) and "the rate at which production actually proceeds", which could be controlled by "ali possible components". The subsequent interpretations of this debate reflected that phytoplankton production is controlled by severa! nutrients and maintained by the equilibrium between growth and Joss terms (e.g., grazing; de Baar 1994). lt could be argued that the P limitation paradigm for freshwater Iakes (Schindler 1977) follows a Brandtonian view, while the Nathansohnian view would challenge the assomptions made to formulate the paradigm (Lewis & Wurtsbaugh 2008, Scott & McCarthy 201 0).
Primary production in aquatic systems controlled by nutrient availability is referred to as "bottom-up" control, while grazing on primary producers by secondary consumers is ca !led "top-down" control ( e.g., Glibert 1998). As might be argued by Nathansohn, the "rate at which production actually proceeds" depends on the relative balance between these growth and Joss terms. However, these controls are intricately linked, and changes in one factor will cause changes in the other (Giibert 1993).
Sorne studies have documented a graduai shift from P to N limitation along freshwater to estuarine to marine gradients (Doering et al. 1995). While coastal marine systems are usually considered N sinks (via denitrification), recent studies suggest that sediment N fixation also may be an important nutrient source for phytoplankton in these systems (Gardner et al. 2006; Fulweiler et al. 2007). These shifts in nutrient limitation status are not unique to the freshwater to marine gradient, however. Similar shifts are observed within the boundaries of individual freshwater systems as weil. ln Tai hu Lake (China), a very large (~2400 km\ shallow (mean depth = 1.9 rn), and highly eutrophie system, TN:TP ratios > 16 (Redfield ratio) have suggested that the lake is P limited (Yant et al. 1998; Dokulil et al. 2000). However, evaluation of N transformations and microbial food web community structure along a gradient from river discharge to the main lake (a distance of ~20 km) during a summer cyanobacteria bloom revealed numerous characteristics consistent with N limitation in the main lake. These characteristics included low dissolved inorganic N (DIN) concentrations(< 0.5 11M), low molar DIN:PO/ (12), low molar TN:TP (8- 12), measurable SWI N fixation, no significant SWI N2 efflux (i.e., Jack of denitrification), net PO/ flux into sediments, and presence of known N fixers in the water column (McCarthy et al. 2007c). Low NH/ :NOx (0.2) also was observed in the main lake during this sampling event. These observations ali suggested that the main lake became N limited (or at !east co-l imited) Jate in the growing season, leading to an observed shift from non-N-fixing cyanobacteria (e.g.,
Microcystis) toN fixing genera (e.g., Anabaena and Aphanizomenon). Low TN:TP ratios in
·the central basin have been observed in previous studies as weil (Dokulil et al. 2000), and bioassays have confirmed seasonal N limitation (Xu et al. 201 0).
14
Nutrient limitation status in freshwater systems may be related to distance from nutrient inflow sources (McCarthy et al. 2007c; Scott et al. 2008), temporally and spatially explicit events (McCarthy et al. 2007c), and hydrodynamic flow regimes (Eiser 1999; McCarthy et al. 2007b). In the Taihu Lake example, distance from the nutrient source was likely an issue in the shift from apparent P limitation toN limitation. The lake area between the river inflow and the main lake is commonly impacted by severe cyanobacteria blooms, and the area close to the river inflow has very high N removal rates, both from water column phytoplankton uptake and denitrification in the sediments (McCarthy et al. 2007c). These factors, in addition to simple dilution over the ~20 km distance from the river inflow to the main lake, likely led to the observed N deficiency in the central basin of the lake. Distances from nutrient inputs to apparently N limited areas in the same system are not always long, however. In a small, constructed wetland in central Texas (USA), nutrient inputs from the source river were depleted rapidly along the flow path, with the system exhibiting evidence of severe N limitation within only a few hundred meters (Scott et al. 2008). As in Taihu Lake, the Texas wetland adjusted for N deficiency by development ofN fixing communities, mostly as benthic cyanobacterial mats, and other N recycling mechanisms.
In small systems, such as the central Texas constructed wetland, where distances from the nutrient source are not great, system hydrology may play an important role in nutrient dynamics and limitation patterns (e.g., Clausen & Johnson 1990). This point is illustrated in a small, Great Lakes coastal wetland (Old Woman Creek, Lake Erie; OWC). Wave action and along-shore currents in Lake Erie lead to development of a sand barrier, which shuts down water exchange between OWC and Lake Erie, particularly in summer (Tomaszek et al. 1997). This barrier can be breached by storm events leading to high runoff into the wetland and, subsequently, Lake Erie (Kiarer & Millie 1992). Residence time in the wetland is short (i.e., a few hours) when runoff events occur, which provides a nearly direct conduit for nutrient exchange between the mostly agricultural OWC watershed and Lake Erie. However, when conditions stabilize, and the sand barrier is in place, denitrification and nutrient uptake by primary producers leads to severe N depletion in the stagnant water column (McCarthy et al. 2007b). The system responded to this depletion in the same way as
was observed in the Texas wet1and-by deve1opment ofN fixing communities and increased importance ofwater co1umn and sediment nutrient recyc1ing mechanisms.
These examples illustrate why aquatic systems, regardless of salinity, must be evaluated individually to determine whether or not established nutrient limitation paradigms apply (Conley et al. 2009). As shown in these examples, it is premature to assume that P limits primary production because the systems are not saline. Another issue worthy of consideration in these cases is background nutrient concentrations and the possibility that nutrients are replete and do not limit primary production, regardless of availability ratios ( e.g., Heath 1992). ln ali of the examples described above, areas of the system closest to the nutrient source are nutrient replete, especially during runoff events. While nutrient availability ratios may suggest P or N limitation, the capacity of the primary producers using these nutrients may be exceeded, thus leading to potential limitation by other factors, such as light (e.g., Aldridge et al. 1995; Phlips et al. 1997) or micronutrients (North et al. 2007).
As described above, NH/ is the most efficient N source for photoautotrophs. This is also the case for bacterial primary producers, which are much more efficient at assimilating NH/ over other N sources (Vallino et al. 1996, Vrede et al. 1998). Bacterial NH/ uptake can account for up to 60% of total NH/ uptake in aquatic systems (Giibert 1993). Phytoplankton photosynthesis is generally associated with 1 ight energy, but nu trient uptake by phytoplankton in the absence of light can occur in nutrient limited phytoplankton (Cochlan et al. 1991 ). Wh ile this phenomenon complicates differentiation of autotrophic (1 ight-dependent) and heterotrophic (light-independent) nutrient uptake, it is still reasonable in most cases to use lightldark incubations as a proxy for distinguishing phytoplankton versus bacterial uptake. This is particularly the case when longer incubations are used ( e.g., 24 hours), since phytoplankton incubated in the dark for more than a few hours would not be able to sustain dark uptake, whereas bacterial NH/ uptake would not be light-dependent (Giibert 1988). lt should be noted that dissolved organic N (DON) often is a significant N source for primary producers (e.g., Glibert 1993), particularly as urea and amino acids. The role of DON in phytoplankton and bacterial nutrition and community structure is beyond the intended scope of this project, but its potential importance as aN source is acknowledged.
16
Nutrient limited pnmary production often is sustained by nutrient regeneration processes occurring in the water column, such as bacterial remineralization and protist excretion (e.g., Dugdale & Goering 1967; Eppley & Peterson 1979; Glibert et al. 1982; Flint 1984; Fisher et al. 1988; Glibert 1988; Kirchman 2000; Gardner et al. 2004; Raimbault & Garcia 2008). Regeneration processes become more important in systems where inputs of new nutrients are low or episodic and dependent on terrestrial runoff, in which case regeneration can sustain production between episodic discharges (Giibert 1988; Dham et al. 2002). In the Mississippi River plume, high N03-discharges in spring lead to a diatom bloom associated with high N03- uptake rates and low importance of NH/ regeneration (Bode & Dortch 1996). However, in summer, low river inputs of N03- result in low primary . productivity fueled primarily by NH/ regeneration. A similar trend was observed in
Chesapeake Bay, where N demand in spring was higher than regeneration, but N regeneration exceeded N demand by three times in fall (Bronk et al. 1998). These results suggest that autotrophic production dominates when nutrient inputs are high in spring, but heterotrophic regeneration sustains system productivity throughout the summer dry season.
The purpose of Chapter III is to investigate water column NH/ regeneration and uptake and N fixation rates in Missisquoi Bay within the growing season. These rates may be dependent on and play a role in determining phytoplankton community structure, particularly wh en cyanobacteria comprise a large proportion of the total phytoplankton.
1.1.3. Sediment-water interface nutrient fluxes and N transformations
Nutrient regeneration 111 sediments underlying the water column also can be an important nutrient source for primary producers (Flint & Kamykowski 1984; Flint 1985, Tobias et al. 2003). In sorne stratified systems, sedimentation of diatoms may decrease nutrient remineralization rates in the water column (Poister & Armstrong 2004), which may lead to an increasing role for sediment recycling in these cases. Sediments are the primary location for organic matter degradation and remineralization in shallow aquatic systems (Tobias et al. 2003). Sustained extemal nutrient loading into a system results in high water column productivity and, ultimately, high organic matter deposition and degradation rates in
sediments (Beman et al. 2005). Reminera1ized nutrients in the sediments can enter the water column as a result of physical forcing ( e.g., sediment resuspension; Fan et al. 2001 ), chemical remobilization (e.g., anoxia), or diffusion. ln sorne cases, internai nutrient regeneration and release from sediments can exceed externat nutrient inputs and delay system recovery from nutrient input reductions (e.g., Burger et al. 2007). ln systems where diatoms dominate, sediments are expected to play a more important rote in system nutrient recycling (Poister &
Armstrong 2004), white water column recycling may be more important when cyanobacteria are dominant (e.g., McCarthy et al. 2007c; McCarthy et al. 2009a).
In eutrophie aquatic systems, sediment nutrient regeneration is dominated by organic matter remineralization to NH/, or ammonification (Tobias et al. 2003). The fate of this regenerated NH/ plays a critical rote in system nutrient status, phytoplankton and bacterial productivity, phytoplankton community structure, and organic matter processing. Potential fates for regenerated NH/ are summarized in Figure 1.1 (taken from Brandes et al. 2007), although it should be pointed out that release or diffusion into the overlying water column is a potential fate with important consequences for system productivity. The most direct fate involves re-assimilation into biomass. The classical paradigm proceeds to nitrification, which involves NH/ oxidation to N02. (via N20), then N03-. The two steps of nitrification are carried out by different bacteria, since no known organism can perform both reactions (Ward et al. 2007). Nitrate from nitrification then can be denitrified, which is the heterotrophic reduction of N03- to N2 (via N02-, NO, and N20; e.g, Seitzinger 1988, Zumft 1997). Denitrification is a poorly constrained (Galloway et al. 2004) N sink in the global N budget. lt may drive systems toward N limitation and also may be a natural eutrophication defense (Seitzinger 1988; Bartkow & Udy 2004). The importance of this coupling increases when microphytobenthic communities are photosynthesizing at the sediment-water interface ( e.g., Dong et al. 2000; An & Joye 2001 ). DIN sources for denitrification in sediments include remineralization of organic matter and diffusion from the water column (Cornwell et al. 1999). Sediments accumulating easily degraded organic matter tend to have higher denitrification rates, particularly from water column N03- diffusion (Dong et al. 2000; Dahllof & Karle 2005). Both nitrification and denitrification often proceed at rates far below their potential in freshwater wetlands (Bowden 1987).