REAL-TIME INTRAOPERATIVE SPECTROSCOPIC MARGIN DETECTION IN ROBOTIC-ASSISTED RADICAL PROSTATECTOMY ON PROSTATE CANCER PATIENTS
MICHAEL PINTO
INSTITUT DE GÉNIE BIOMÉDICAL ÉCOLE POLYTECHNIQUE DE MONTRÉAL
MÉMOIRE PRÉSENTÉ EN VUE DE L’OBTENTION DU DIPLÔME DE MAÎTRISE ÈS SCIENCES APPLIQUÉES
(GÉNIE BIOMÉDICAL) AOÛT 2018
UNIVERSITÉ DE MONTRÉAL
ÉCOLE POLYTECHNIQUE DE MONTRÉAL
Ce mémoire intitulé :
REAL-TIME INTRAOPERATIVE SPECTROSCOPIC MARGIN DETECTION IN ROBOTIC-ASSISTED RADICAL PROSTATECTOMY ON PROSTATE CANCER PATIENTS
présenté par : PINTO Michael
en vue de l’obtention du diplôme de : Maîtrise ès sciences appliquées a été dûment accepté par le jury d’examen constitué de :
M. STIKOV Nikola, Ph. D., président
M. LESAGE Frédéric, Ph. D., membre et directeur de recherche
Mme TRUDEL Dominique, Ph. D., membre et codirectrice de recherche M. RAISON Maxime, Ph. D., membre
DEDICATION
ACKNOWLEDGEMENTS
As the adage goes: it takes a village to raise a master’s student.
First and foremost, a huge thank you to my parents who’ve been behind me every step of the way - your love, support and devotion to education have brought me where I am today and for that I could not be more grateful.
Thank you to my academic supervisors, Frederic Lesage and Dominique Trudel for constantly pushing me to research further, challenge my ideas and achieve my ambitions. Your passion and dedication to your research are as palpable as they are contagious.
Thank you to Frederic Leblond for bringing forth this project and showing by example what it means to be an innovator. Every meeting, phone call, and e-mail with you tapped into a stream of new ideas in a way that will leave me inspired for years to come.
Thank you to Kevin Zorn for your excitement in collaborating on this project and for taking precious time out of your surgeries to make it a reality.
A big thanks to the industrial partners behind this research and more importantly the people that helped along every step of the way. Thank you to Ian McDowall for your invaluable advice and for the warm welcome at Intuitive headquarters, to Rajeev Yadav for technical guidance and brainstorming sessions and to Chris Kent for trusting me with this research and coaching me along the way. Thank you also to Diane Coté and Christiane Barette at the MEDTEQ institute for your help in making this project a reality.
A heartfelt thank you to Joannie Desroches for introducing me to the world of medical optics. The past few years have been an unforgettable adventure in large part thanks to you.
This section would be incomplete without mentioning Jean-Philippe Tremblay. Thank you for your contagious love of tinkering and thank you for being such a dependable, supportive and amazing friend.
Thanks to all those at Polytechnique and the CHUM who contributed to this project. Mirela Birlea and Claudia Zyed, thank you for recruiting patients and providing invaluable support and thanks to Kelly Aubertin for showing me the ropes.
Finally, a warm thank you to my girlfriend Jackie for being so supportive and helping me keep my head up every step of the way. You made it easy to keep going even when I saw no end in sight.
RÉSUMÉ
Le cancer de la prostate est souvent traité par la résection de la prostate entière, une procédure appelée prostatectomie radicale. Le succès de cette procédure dépend de la capacité du chirurgien a retirer la totalité de la prostate et à assurer qu’il ne reste aucunes cellules cancéreuses à la marge chirurgicale. On retrouve du cancer à la marge dans jusqu’à 20% des procédures et à ce jour, les marges ne sont évaluées par un pathologiste que plusieurs heures après la chirurgie nécessitant des traitements adjuvants quand du cancer est détecté. La capacité de caractériser du tissue de façon intra opératoire et en temps réel est donc un réel besoin clinique qui n’est pas comblé par la technologie actuelle. La spectroscopie Raman est une technologie optique basée sur la diffusion de la lumière par des molécules et liens moléculaires spécifiques. La spécificité moléculaire de la spectroscopie Raman peut être couplée à des techniques d’apprentissage machine pour effectuer de la caractérisation de tissu en fonction de sa composition moléculaire. Ceci pourrait combler le besoin clinique énoncé en permettant aux chirurgiens de détecter et retirer le maximum de tissu prostatique bénin et cancéreux. Dans ce mémoire, nous présentons la conception et le développement d’un système de spectroscopie Raman intégré à une plateforme de chirurgie robotisée couramment utilisée pour effectuer des prostatectomies. L’ingénierie du système et sa validation sur des fantômes sont d’abord présentés. Nous présentons ensuite une preuve de concept effectuée sur 20 prostates humaines ex vivo pour démontrer la capacité du système à distinguer entre du tissu de prostate et du tissu extra-prostatique avec une précision, sensibilité et spécificité tous au-delà de 90%. Finalement, nous présentons l’utilisation du système avec une plateforme de chirurgie robotisée pour effectuer, pour la première fois, des mesures de spectroscopie Raman in vivo sur des prostates humaines pendant la prostatectomie.
ABSTRACT
Prostate cancer is often treated through a radical prostatectomy procedure consisting of the removal of the entirety of the prostate gland. The success of this procedure relies on the surgeon’s ability to resect prostate tissue maximally and ensure no cancer is left behind. Surgical margins are currently assessed by pathologists only hours to days following surgery and positive surgical margins (cancer cells having spread to the boundary of resection) occur in as many as 1 in 5 cases. The ability to characterize tissue intraoperatively, in real time is therefore an important clinical need and is unmet by current technology. Raman spectroscopy (RS) is an optical technology based on the scattering of light by specific molecules/molecular bonds. Combining the molecular specificity of RS with machine learning techniques has shown promise for tissue characterization based on molecular composition. This sort of molecular fingerprinting could benefit prostatectomy procedures by ensuring maximal resection of prostate tissue and cancer. In this thesis, we present the design and development of an RS system integrated to a surgical robotics platform commonly used in RP. Design, engineering, and validation work on phantoms is presented. A proof of concept study was performed to demonstrate the ability of RS to characterize prostate tissue wherein the system was used to obtain data on 20 whole human prostates ex vivo. Preliminary results show successful distinction between prostatic and extra-prostatic tissue with accuracy, sensitivity and specificity over 90%. Also presented is the successful use of the system with a surgical robot to perform in vivo measurements in humans on 5 patients for the first time.
TABLE OF CONTENTS
DEDICATION ... III ACKNOWLEDGEMENTS ... IV RÉSUMÉ ... VI ABSTRACT ...VII TABLE OF CONTENTS ... VIII LIST OF TABLES ... XI LIST OF FIGURES ...XII LIST OF SYMBOLS AND ABBREVIATIONS... XV
CHAPTER 1 INTRODUCTION ... 1
1.1 Prostate Cancer, treatment, and clinical motivation ... 1
1.2 Raman spectroscopy for tissue characterization ... 2
1.3 Research objectives ... 3
CHAPTER 2 BACKGROUND THEORY & LITERATURE REVIEW ... 4
2.1 Raman Scattering & the Raman spectrum ... 4
2.2 Spectral processing and classification ... 7
2.3 Diagnostic applications of Raman Spectroscopy in Oncology ... 8
CHAPTER 3 METHODS & RESULTS COMPLEMENTARY TO THE RESEARCH ARTICLE……...………13
3.1 Objective 1 : Integration of RS to the da Vinci surgical robotics platform ... 13
3.1.1 Raman spectroscopy system ... 13
3.1.2 Clinical integration & workflow ... 22
3.2 Objective 2: Collect ex vivo and in vivo Raman spectra from human prostate and peri
prostatic organs/tissues ... 24
3.2.1 Collect Raman spectra from whole prostates following RP ... 25
3.2.2 In vivo data collection during robotic-assisted radical prostatectomy procedures ... 27
3.2.3 Process automation for cancer detection (automated platform) ... 27
3.3 Objective 3: Classification/tissue characterization based on acquired datasets ... 30
3.3.1 Objective 3.1 : Train algorithms capable of differentiating prostatic from peri-prostatic tissue………...30
CHAPTER 4 ARTICLE 1 : INTEGRATION OF A RAMAN SPECTROSCOPY SYSTEM TO A ROBOTIC-ASSISTED SURGICAL SYSTEM FOR REAL TIME TISSUE CHARACTERIZATION DURING RADICAL PROSTATECTOMY PROCEDURES ... 32
4.1 Abstract ... 32
4.2 Introduction ... 33
4.3 Methods ... 35
4.3.1 Raman Spectroscopy System ... 35
4.3.2 Data collection on ex vivo human prostates ... 40
4.3.3 In vivo data collection during robotic-assisted radical prostatectomy procedures .... 42
4.4 Results ... 43
4.4.1 Integration of the Raman spectroscopy system with the robotic assisted surgical platform ... 43
4.4.2 Ex vivo and in vivo Raman spectroscopy in robotic-assisted radical prostatectomy procedures ... 45
4.5 Discussion ... 50
4.7 Disclosures ... 52
4.8 Acknowledgments ... 53
CHAPTER 5 GENERAL DISCUSSION ... 54
CHAPTER 6 CONCLUSION AND RECOMMENDATIONS ... 58
LIST OF TABLES
Table 3.1 : Acquisition parameters used for the Andor Newton camera ... 15 Table 3.2 : Range of acquisition parameters used throughout the ex vivo and in vivo experiments ... 26 Table 3.5 : Distribution of in vivo Raman spectra acquired in surgical cavity during radical
prostatectomy procedures. ... 27 Table 4.1 : Principal technical specification of the Raman spectroscopy system. ... 35 Table 4.2 : Distribution of ex vivo Raman spectra acquired on whole prostates following radical
prostatectomy procedures. ... 41 Table 4.3 : Distribution of in vivo Raman spectra acquired in surgical cavity during radical
prostatectomy procedures in 4 patients. ... 43 Table 4.4 : Prominent biological tissue Raman bands identified on the ex vivo prostate spectra. . 46
LIST OF FIGURES
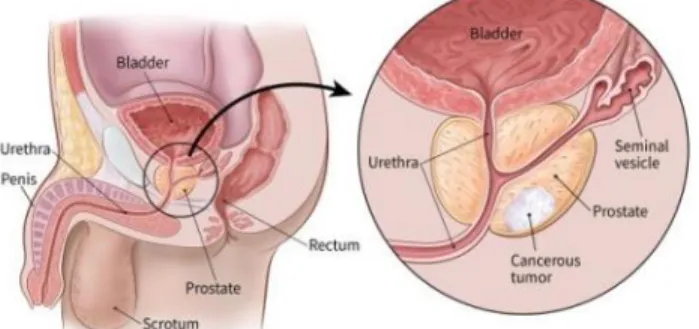
Figure 1.1 : Human reproductive anatomy with closeup view of prostate and prostate cancer. Source : https://www.cancer.org/cancer/prostate-cancer/about/what-is-prostate-cancer.html 1 Figure 2.1 : Visual depiction of possible interactions between vibrational and virtual energy states
following excitation with monochromatic light. Source :
https://commons.wikimedia.org/wiki/File:Raman_energy_levels.svg ... 5 Figure 2.2 : Typical acetaminophen (Tylenol) Raman spectrum in the FP region. Acetaminophen
is commonly used as a reference in literature. Source : https://commons.wikimedia.org/wiki/File:Acetominophen_Raman.jpg ... 6 Figure 2.3 : handheld RS probe developed by Prof. Leblond’s research group at Polytechnique
Montreal in use during glioblastoma resection surgery ... 10 Figure 2.4 (Top) Histopathology images of 3 brain tissue biopsy samples (left: dense cancer tissue,
middle: invasive cancer, right: normal tissue) corresponding to locations where RS measurements were made. (Bottom) Raman spectra of the measurement locations showing spectral differences. (Figure reproduced from Jermyn et al. 2015) ... 11 Figure 2.5 (left) Methodology for spatial correlation of Raman spectroscopy measurements and
tissue for diagnosis. Prostate specimen is divided into four quadrants to demonstrate each stage of the methodology performed on the same prostate slice (figure on from Aubertin et al. In preparation). (right) Average spectra of 149 spectra from cancerous tissue in red and 776 spectra from normal tissue in green (original figure) ... 12 Figure 3.1 : (top) Picture of the assembled RS system with laser, computer running acquisition
software and spectrometer. (bottom) Schematic overview of the Raman spectroscopy system components and the connections between them. Blue arrows represent digital/electrical connections while orange ones represent optical/fibered connections. ... 14 Figure 3.2 : (left) side-by-side and to scale comparison of the probe designed for robotic integration
and the handheld one currently used for surgical interventions by our group and the industrial partner ODS Medical. (right) close-up view of the hexagonal profile machined on the probe
tip to facilitate grasping using standard robotic equipment and a blown-up view of the main optical elements of the probe ... 16 Figure 3.3 (left) Laser & laser controller (right) side view of laser controller with rear connections
to laser unit. ... 17 Figure 3.4 : Screenshot of the acquisition software used to perform all spectral measurements... 18 Figure 3.5 : examples of TCP/IP protocol required to communicate with the RS platform via a
specified IP/Port in Matlab (left) and Python (right) ... 19 Figure 3.6 : software used to compute x-axis to pixel correspondence of the spectrometer. Peaks
from a measured Tylenol spectrum are matched to their corresponding peaks on a reference spectrum one by one. ... 20 Figure 3.7 : calibrated measured spectrum overlayed with reference spectrum showing proper peak
alignment ... 20 Figure 3.8 : 3D rendered representation of integration to the patient. The probe is inserted through
an accessory or camera port and manipulated by a standard da Vinci laparoscopic instrument to reach the target anatomy (red) ... 23 Figure 3.9 : light contribution of the da vinci illuminator on a background measurement when 'on'
and 'of' ... 24 Figure 3.10 : inside the light-tight box used to perform RS acquistions ex vivo at the end of RA-RP ... 25 Figure 3.11 : current process for performing Raman measurements on a prostate slice and obtaining
registration from histopathology. ... 28 Figure 3.12 : (left) conceptual view of automated platform. (center) Complete working version of
automated Raman platform. (right) mask generated from platform camera image for registration with histopathology ... 29
Figure 3.13 : evaluating platform precision : a marker was mounted on the platform instead of the Raman probe. Points were selected on milimetric paper using the platform software and distance between point selected and point inked was measured ... 30 Figure 3.14 ... 31 Figure 4.1 : Visual representation of the Raman spectroscopy system designed and built for
integration in a robotic-assisted surgical system. Depicted is a close-up view of the hexagonal profile machined on the probe tip to facilitate grasping using standard robotic equipment. A blown up view of the main optical elements making up the probe is shown as well as a schematic representation of the coincident excitation and detection light cones. ... 37 Figure 4.2 : Pre-processing steps for a 785 nm fingerprint ex vivo prostate Raman spectrum. (a):
Raw spectrum after averaging and dark noise subtraction, (b): NIST correction curve shown for visualisation of instrument response features. (c): raw spectrum multiplied by the NIST correction curve (blue curve) and polynomial fit computed to estimate the fluorescence background contribution (orange). (d): Subtraction of the fluorescence background curve from the NIST corrected raw spectrum in (c). (e): Savitsky-Golay filtered signal to eliminate high frequency noise. (f) : SNV-normalized spectrum. ... 38 Figure 4.3 : Representation of the Raman spectroscopy probe integrated with the da Vinci robot-assisted surgical system composed of four independently controllable robotic arms (3 visible here, labeled 1, 2 and 3). The arms have interchangeable instruments and the probe was manufactured to be compatible with grasping instruments (such as the Prograsp or needle driving arm manufactured by Intuitive surgical). The grasping arm is shown ceasing the Raman spectroscopy probe for intraoperative measurements, with a magnified view provided as an aid to visualization. ... 39
LIST OF SYMBOLS AND ABBREVIATIONS
CCD Charge coupled deviceFP Fingerprint
H&E Hematoxylin & Eosin HWN High wavenumber
LDA Linear discriminant analysis
LRP Laparoscopic radical prostatectomy MTP Mechanical transfer push-on
ORP Open radical prostatectomy PCA Principal component analysis
RARP Robotic assisted radical prostatectomy
RS Raman spectroscopy
SNV Calmodulin
CHAPTER 1 INTRODUCTION
1.1 Prostate Cancer, treatment, and clinical motivation
Prostate cancer occurs when cells from the prostate gland begin to grow uncontrollably. It is the second most frequently diagnosed cancer globally[1] . In the United States in 2015 there were an estimated 220,800 new prostate cancer cases (26% of all 2015 cases) and 27,540 deaths (9% of all 2015 estimated cancer deaths)[2].
Figure 2.1 : Human reproductive anatomy with closeup view of prostate and prostate cancer.
Source : https://www.cancer.org/cancer/prostate-cancer/about/what-is-prostate-cancer.html Surgical excision of the whole prostate through Radical Prostatectomy (RP) is an important standard of care for prostate cancer and can be performed through open (ORP), laparoscopic (LRP) or robotic assisted (RA-RP) surgical methods. Minimally invasive techniques such as LRP and RA-RP have comparable clinical outcomes to ORP. However, RA-RP leads to shorter catheterization times and hospital stays, less blood loss and reduced complication rates[3]. Moreover, the robots used for RA-RP offer a platform well suited for the integration and control of assistive technologies with minimal perturbation to the surgeon’s workflow.
The clinical objective of the procedure is to remove the entire prostate while sparing nerves and other surrounding tissues. This presents surgeons with several clinical challenges unmet by present technology. Firstly, removing the whole organ is made difficult by the lack of clear histological prostate capsule leading to prostate tissue left behind in as many as 29% of cases[4]. Moreover, positive surgical margins (cancer cells having spread into surrounding marginal tissue) occur in as
many as 1 in 5 cases and strongly correlate with disease recurrence[5]. Positive surgical margins are only discovered following surgery, when pathologists study the excised prostate. Finally, detection of nerves vital to erectile and urinary function could lead to more effective nerve sparing which has important impacts on post-operative erectile function and urinary continence[6]. As such, there is an important clinical need for a real time, in vivo method to characterize tissue during RP to insure more complete resections, detect cancer at the margin and lead to better outcomes with regards to urinary continence and erectile disfunction.
1.2 Raman spectroscopy for tissue characterization
Raman spectroscopy (RS) is an optical technology that has shown promising results for sensitive and specific molecular characterization of tissue[7][8]. RS is based on the detection of inelastically scattered light following tissue excitation with monochromatic light[9]. When light is incident on tissue, the most probable interaction process is elastic scattering (Rayleigh scattering) resulting in light reemission at the same frequency as the excitation. The Raman effect is associated with a small fraction of the reemitted light instead being scattered at a frequency different from that of the incident photons. The resulting spectral shifts are associated with molecular vibrations and provide an avenue for precise and quantitative fingerprinting since each molecular species have their own spectral signature. A more detailed overview of Raman spectroscopy and its clinical applications is presented in section 2 of this thesis.
Previous work performed using RS shows great promise for its use as a diagnostic tool. For example RS has been shown to detect high grade glioblastoma (brain cancer) in vivo during surgery where it successfully differentiated normal brain from cancer tissue in 17 patients with grade 2-4 gliomas with a sensitivity of 93% and a specificity of 91% (as compared to standard H&E analysis)[10]. More specific to prostate cancer, RS has been shown to identify prostate cancer with high accuracy in vitro and ex vivo (see section 2.3 for a detailed review on the subject) though, to our knowledge, no studies have performed in vivo RS characterization of prostate tissue.
1.3 Research objectives
The general objective of this thesis is to demonstrate that a RS can be integrated into the da Vinci surgical platform for RA-RP to collect RS spectra at the surgical margin during RA-RP with the aim of characterizing tissue composition. An emphasis is placed on the engineering and integration work required to integrate RS with RA-RP and preliminary results on both ex vivo and in vivo datasets gathered using this system are presented. The central hypothesis supporting this work is that RS could be used during RA-RP and has potential for prostate tissue characterization/classification. To test this hypothesis, the objectives of this research project are listed below :
Objective 1: Integrate RS into the da Vinci surgical robotics platform
Objective 1.1 : Perform hardware and software engineering necessary for robotic integration of RS to the da Vinci surgical platform
Objective 1.2 : Verify and validate integration using a phantom of known molecular composition and geometry
Objective 2: Collect ex vivo and in vivo Raman spectra from human prostate and peri prostatic organs/tissues
Objective 2.1 : Collect Raman spectra from whole, unprocessed prostates immediately following RP with the objective characterising Raman spectra in different prostatic regions
Objective 2.2 : Collect Raman spectra from prostate and peri-prostatic organs in vivo to assess the feasibility of distinguishing between prostatic and peri-prostatic tissue intra operatively
Objective 2.3 : Automate the process of acquiring Raman spectra from cross sectional prostate slices following RP with the objective of distinguishing between benign and malignant prostatic tissue in a manner that is independent of the heterogeneous molecular background associated with the prostate.
Objective 3: Classify and characterize tissue based on acquired datasets
Objective 3.1 : Train algorithms capable of differentiating prostatic from peri-prostatic tissue Objective 3.2 : Compare ex vivo and in vivo spectra
CHAPTER 2
BACKGROUND THEORY & LITERATURE REVIEW
2.1 Raman Scattering & the Raman spectrum
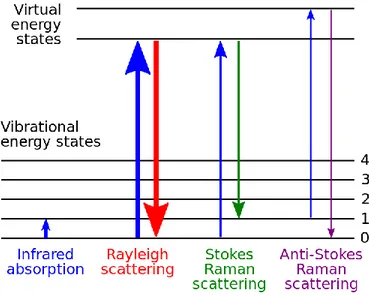
Light (photons) incident on a sample (be it solid, liquid, or gas) will be scattered by atoms or molecules which make up the medium and are of much smaller size than the light source wavelength. The electric field from an incident photon induces oscillating polarizations in the molecular bonds of the medium, bringing the molecules to a virtual energy state higher than its permitted vibrational states. This virtual energy state can then interact with the molecules permitted vibrational states. The first (and most likely) type of interaction is for the molecules to return to their original state (the most probable being the ground state) emitting a photon with the same frequency and wavelength as the light source. This phenomenon is referred to as elastic scattering (also referred to as Rayleigh scattering)[11]. Another form of scattering, inelastic or Raman scattering was first postulated by Smekal in 1923[9] and observed experimentally in 1928[12] by Indian scientist C.V Raman and his student K. S Krishnann. They observed that when a sample is excited with a light source of a given wavelength, a much weaker spectrum composed of peaks of light of wavelengths higher and lower than the excitation wavelength is emitted. These emissions are the result of interactions between a virtual energy state and vibrational energy states different from the one the molecule was in when it encountered the photon. The molecule ends in a vibrational state higher or lower than the one it was in before interaction (either absorbing energy or transferring some in the process) and a photon of either higher or lower wavelength than the incident one is emitted. This process is known as inelastic scattering (also referred to as Raman scattering). A molecule that is left in a higher vibrational state will scatter a photon with lower energy (referred to as Stokes Raman scattering) than the incident one and one in which the molecule is left in a lower vibrational state than it began in will scatter a photon with higher energy (referred to as anti-Stokes Raman scattering) than the incident one. Since molecules are far more probable to be in lower vibrational states when they scatter a photon, Stokes Raman scattering is more intense than its anti Stokes counterpart and will be the focus of this work.
Figure 2.1 : Visual depiction of possible interactions between vibrational and virtual energy states following excitation with monochromatic light. Source :
https://commons.wikimedia.org/wiki/File:Raman_energy_levels.svg
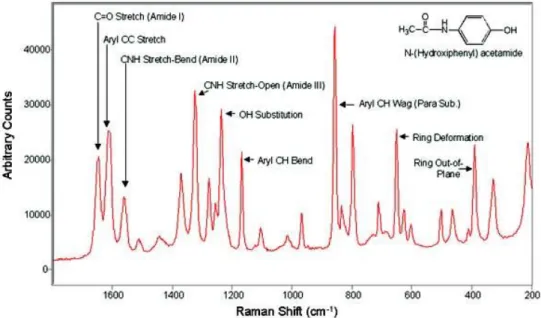
The different molecules and molecular bonds that make up a sample excited by monochromatic light will each have different vibrational/virtual energy states and will therefore result in the emission of photons of distinct wavelengths around the excitation one. Using a spectrometer and specialized equipment to collect this light, it is possible to record the spectrum of light emitted by an excited sample: the Raman spectrum. Since Raman scattering is so deeply related to the molecular make-up of the scattering material, the spectrum of light generated can be used as a sort of molecular fingerprint: this is the basis of Raman spectroscopy. Raman spectra are typically expressed in terms of shifts from the excitation wavelength (Raman shifts) and have units of wavenumbers since the spectrum is independent of excitation wavelength. The spectral range of Raman shifts from 400 – 1800 cm-1 is typically referred to as the “Fingerprint” (FP) region while the range of Raman shifts from 2000-3000 cm-1 is commonly referred to as the “high-wavenumber” (HWN) region. Figure 3 shows the Raman spectrum for a sample of acetaminophen (more commonly known as Tylenol) :
Figure 2.2 : Typical acetaminophen (Tylenol) Raman spectrum in the FP region. Acetaminophen is commonly used as a reference in literature. Source :
https://commons.wikimedia.org/wiki/File:Acetominophen_Raman.jpg
It is worth noting that Raman scattering is a very rare effect (approximately 1 in 106 photons) that
is in direct competition with other interactions between light and samples. Most notably for Raman spectroscopy of biological samples, the Raman spectrum is several orders of magnitude smaller than auto-fluorescence caused by the interaction between fluorophores present in the sample and light[13].
Raman spectroscopy systems share the same core components: a monochromatic excitation source, an optical device which delivers the excitation light to the sample and collects the spectral response, a high throughput spectrometer and a highly sensitive CCD detector to digitize the spectral response[14]. Recent technological advances in each of these components allows the development of systems which are compatible with clinical use. Notably, wavelength stabilized monochromatic lasers, high throughput and resolution spectrometers and highly sensitive CCD detectors have allowed the collection of a Raman spectrum at reasonable time scales (a couple of seconds)[15]. Moreover, advances in fiber optic light delivery/collection and miniaturized optical elements/filters have allowed the development probes which are capable of delivering excitation light and
collecting a spectral signature while filtering out the predominant Rayleigh scattering from excitation. The use of fiber optics and miniature filters has allowed the development of probes which can deliver/collect light several meters from the excitation source/detector making them suitable as handheld probes in a sterile surgical field.
2.2 Spectral processing and classification
Collecting spectra is not enough for effective use of RS as a clinical tool. Spectra need to be analyzed and transformed into easily interpretable and clinically relevant information. Uncovering the subtle molecular differences that mark the difference between, for example, spectra from healthy and diseased tissue, requires a large dataset of properly processed and labeled spectra. The first step to gathering a dataset is to determine appropriate strategy to establish ground truth in labels. There should be an observable molecular difference that exists between classes and a way to ensure it is properly labeled across spectra. For example, analysis of samples interrogated can be performed by a histopathologist to provide ground truth in distinguishing between spectra from benign and malignant tumors, cell lines of known origins can be cultured and measured, spectra can be acquired from specific anatomical structure, etc. It is worth noting that the accuracy of the method chosen in labeling for ground truth poses a limitation on the accuracy of any following classification methods. Once ground truth is established, the use of automated machine learning approaches requires sufficiently large datasets to perform blinded validation and avoid over-fitting of the data (at least 75-100 spectra to test a “good but not perfect” classifier according to a recent study from Cornell university[16]). This is often an important hurdle in clinical applications where obtaining large quantities of spectra can be complicated, lengthy and costly. With a large labeled dataset, it is then important to perform appropriate spectral processing and normalization. Common preprocessing steps of Raman spectra exist for comparison of spectra across datasets (e.g across patients). These include noise reduction using smoothing filters or frequency-based analysis, auto-fluorescence background removal to separate the Raman spectrum from excitation induced tissue auto-fluorescence[13][17], subtraction of an excitation free spectral acquisition to correct for ambient lighting, cosmic ray detection, normalization to compare spectra across datasets[18], and instrument response correction/calibration using a known standard[19] to compare datasets across
systems. Many different techniques exist for each one of these preprocessing steps which depend on specific applications/preferences and exceed the scope of this review. Specific techniques used in this publication are elaborated in chapter 3 of this work.
Finally, processed spectra may then be used for machine learning based approaches. Classifiers are trained on datasets with Raman spectra of known origin and used on unlabeled spectra to assess their performance. Multivariate differences in peak expressions/intensities across different classes of spectra lead to successful classification. A wide variety of techniques may be employed[20][21] which exceed the scope of this literature review though optimal classification is generally achieved by using automated approaches to detecting key features for separation of classes such as support vector machines (SVMs). The following chapter of this review will focus on specific examples while the techniques employed for this project are detailed in chapter 3.
2.3 Diagnostic applications of Raman Spectroscopy in Oncology
RS has been studied for a variety of clinical applications such as in the diagnosis of Alzheimer’s disease[22], nephropathic cystinosis [23], studying calcification in cardiovascular applications[24], [25],[25]. The focus of this review will be on oncological applications where currently available diagnostic tools for tissue characterization fail to address the needs of clinicians. These include H&E/histopathology on biopsy samples, computed tomography, magnetic resonance imaging and positron emission tomography scans and ultrasound. H&E/histopathology is lengthy, labor intensive, costly and can only provide results days following the surgery[26]. The other imaging techniques lack in sensitivity and specificity for cancer cell detection, can be very expensive, oftentimes rely on the use of an exogenous contrast agent, and can not be used in real time. RS is a label-free, minimally invasive and sensitive technique which can be used in real-time and holds great promise for applications in oncology. The following section will review literature in this domain with an emphasis on clinical applications in prostate and in vivo applications in humans. In prostate, RS has been shown to identify cancer with high accuracy. A few studies using Raman microscopy-based systems have successfully characterized prostate cancer tissue. Crow et al. first
suggested the use of RS in prostate in 2002 showing variations in expressions of peaks corresponding to glycogen and nucleic acids (1655 cm-1 and 1240-1265 cm-1) between spectra collected using a Raman microscope on benign prostatic hyperplasia (BPH) and prostatic adenocarcinoma[27]. A year later, this group conducted a study involving 27 patients showing RS could be used in vitro to identify BPH (sensitivity 93%, specificity 92%) , gleason scores (GS) <7 (sensitivity 85%, specificity 96%), =7 (sensitivity 81%, specificity 96%) and >7 (sensitivity 94%, specificity 100%)[28]. This was accomplished using a linear discriminant analysis (LDA) classifier with a leave-one-spectrum-out cross validation approach. Crow et al. again demonstrated the potential of RS in vitro using a Raman microscope to differentiate (classification performed using LDA and leave-one-spectrum-out cross validation) between spectra from two well differentiated and two poorly differentiated cell lines with sensitivity and specificity at 96-100% and 99-100%, respectively[29]. Wang et al. have also demonstrated that a Raman microscope on two cell lines from 50 patients can successfully discriminate between androgen-dependant and castration-resistant prostate cancer using an SVM trained with leave-one-out cross validation with a sensitivity of 88.2% and specificity of 87.9%[30]. Similar Raman microscopy studies have been performed on bladder breast, skin, oral, and a host of other cancerous tissues with equally promising results[31],[32]. These studies all suggest promise for the use of RS as a diagnostic tool though the use of RS through a microscope imposes significant limits on its clinical usefulness and viability. Microscopes require tissue preparation/fixation, have long acquisition times (in the order of 10 seconds to one minute per spectrum) and therefore fail to address the need of real time characterization in the operating room. As such, much work has been done to integrate RS to fiber optic probes. Due to the difficulty of acquiring histopathology ground truth in vivo most studies have been geared towards analyzing tissue ex vivo as a first step towards testing systems and probes compatible for in vivo use[33]. A 2005 study on snap-frozen bladder and prostate samples collected during surgery using a “fiberoptic Raman system suitable for in vivo use” was able to differentiate benign from malignant samples with an accuracy of 84% on bladder samples and 86% in prostate samples[34]. Previous work performed ex vivo thus shows promise for the application of RS to the characterization of prostate tissue.
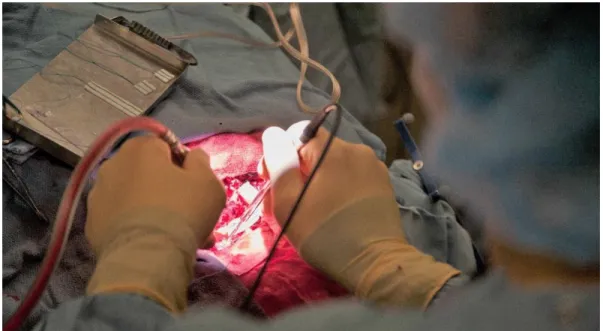
The past decade has been marked with important strides towards clinical translation of RS in vivo. Technological advances in CCD detectors, lasers, and fibered optics have allowed for spectral acquisitions with performance and time scales suitable for in vivo use[15]. Zhao et al conducted a large study on 289 patients where they performed measurements on suspect skin lesions with acquisition times under 1 second. Using partial least squares regression and linear discriminant analysis on the spectra, they achieved 91% sensitivity and 75% specificity for differentiating skin cancers from benign legions and 97% sensitivity/78% specificity in differentiating malignant melanoma from benign pigmented lesions[35]. For more difficult to reach organs, RS has been integrated to a variety of endoscopic systems for investigative work [33]. Draga et al. used an RS probe to obtain Raman spectra from ‘suspicious’ and ‘nonsuspicious’ bladder locations with acquisition times under 5 seconds. They reported a sensitivity of 85% and 79% in distinguishing normal from cancerous bladder locations[36]. In brain cancer, invasive cancer cells frequently remain after surgery, leading to disease recurrence and a negative impact on overall survival[10]. Our research group at Polytechnique Montreal has developed a handheld RS probe for intraoperative collection of Raman spectra[10]. The following figure shows a view of the handheld probe used during open cranium glioblastoma resection.
Figure 2.3 : Handheld RS probe developed by Prof. Leblond’s research group at Polytechnique Montreal in use during glioblastoma resection surgery
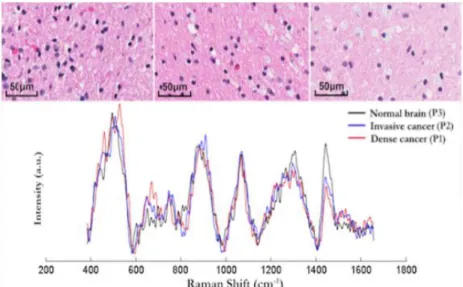
Using this probe, a study was conducted on 17 patients with gliomas of grade 2-4 with acquisition times on the order of 1 second. For each patient, measurements were collected in the surgical cavity by placing the probe in contact with tissue of unknown origin. The surgeon then took a biopsy where the probe left an indentation which underwent histopathological analysis and was classified as being “normal”, “infiltrated” or “cancer”. This allowed the generation of a dataset with 161 spectral measurements with a histopathological oncological assessment as ground truth. Typical spectra for each class as well as a corresponding histopathology slide are presented in the following figure.
Figure 2.4 (Top) Histopathology images of 3 brain tissue biopsy samples (left: dense cancer tissue, middle: invasive cancer, right: normal tissue) corresponding to locations where RS measurements were made. (Bottom) Raman spectra of the measurement locations showing
spectral differences. (Figure reproduced from Jermyn et al. 2015)
Machine learning algorithms (gradient boosted trees) were used with k-fold (10 folds) cross validation on the dataset and yielded a diagnostic accuracy of 92%, with 93% sensitivity and 91% specificity. Using a handheld probe with the same design, Aubertin et al. performed ex vivo research on human prostate. They reported detection of prostate cancer in freshly harvested, unprocessed ex vivo slices of human prostate following radical prostatectomy. Raman spectra were collected all over the surface of the prostate slices immediately following surgery and each point where data was collected was marked with ink. The prostate slices were then sent for
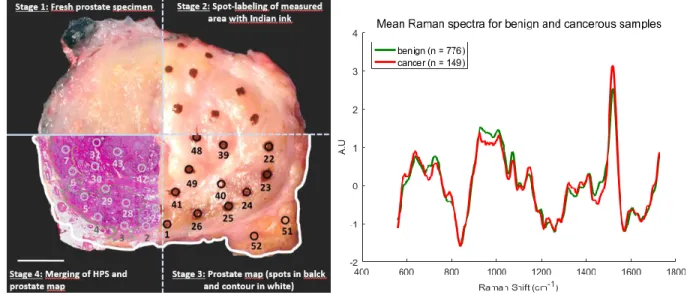
histopathological assessment and each spectrum was matched to a pathologist’s diagnosis. A dataset of 925 spectra (149 cancerous, 776 benign) was obtained from 32 prostates and RS was able to distinguish prostatic from extra prostatic tissue and benign from malignant tissue with sensitivities of 82%, 83%, 86% and 87% respectively[37]. Figure 2.6 summarizes the process of histopathology registration and shows mean spectra collected for benign and cancerous classes.
Figure 2.5 (left) Methodology for spatial correlation of Raman spectroscopy measurements and tissue for diagnosis. Prostate specimen is divided into four quadrants to demonstrate each stage of
the methodology performed on the same prostate slice (figure on from Aubertin et al. In preparation). (right) Average spectra of 149 spectra from cancerous tissue in red and 776 spectra
from normal tissue in green (original figure)
Previous work thus shows successful in vitro and ex vivo prostate tissue characterization which show promise to address unmet clinical needs in RA-RP. RS probes have also successfully been used in vivo on multiple organs with promising results. To our knowledge, this technique has not been applied in vivo on prostate yet.
CHAPTER 3
METHODS & RESULTS COMPLEMENTARY TO THE
RESEARCH ARTICLE
The following chapter describes the scientific approach employed to achieve the objectives set out in this work. A general overview of the methods employed for the realization of the objectives set out in section 1.3 is presented.
3.1 Objective 1 : Integration of RS to the da Vinci surgical robotics
platform
The first objective set out in thesis was the design and development of an RS system, using two excitation wavelengths, adapted for integration to a surgical robotics platform. The system is based on previous systems used by our research team with important modifications outlined in the sections below. First, a general overview of the system is presented followed by each of its components, the work done in assembling them, and the primary hurdles overcome.
3.1.1 Raman spectroscopy system
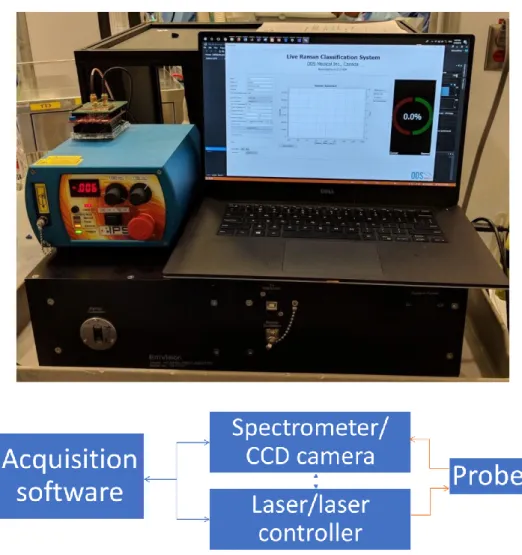
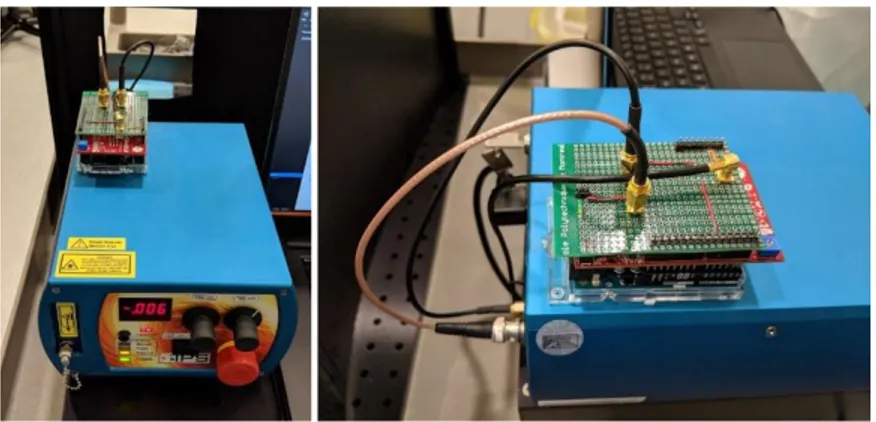
An RS system adapted for robotic integration was designed and assembled. The system is primarily composed of a spectrometer coupled to a highly sensitive CCD camera, a laser excitation source capable of delivering light at two excitation wavelengths and a fiber optic probe responsible for light delivery and collection. A custom acquisition software coordinates all spectral acquisitions, communicates with system components to set parameters and handles data exchange/storage. The following figure shows the assembled RS system as well as a schematic representation of the connections between its components :
Figure 3.1 : (top) Picture of the assembled RS system with laser, computer running acquisition software and spectrometer. (bottom) Schematic overview of the Raman spectroscopy system components and the connections between them. Blue arrows represent digital/electrical connections while orange ones represent optical/fibered connections.
3.1.1.1 Spectrometer & Camera
A custom spectrometer built by EMVision LLC was ordered for this project.. The spectrometer is optimised for collection in the 800-900 nm range where it has a resolution of ~0.15 nm. This corresponds to the FP region (500-2000 cm-1) of a 785 nm excitation and the HWN region
150 um slit where it is then diffracted onto the CCD array of a highly sensitive detector (Andor Newton 920 XT). The camera parameters used for all spectral acquisitions in this project were set based on recommendations from colleagues and the industrial partner ODS Medical and are listed in the table below :
Table 3.1 : Acquisition parameters used for the Andor Newton camera
Parameter Value
Detector temperature -80
Exposure time 75-100 mS
Vertical shift speed 1.8 us
Horizontal shift speed 2.5 MHz
Gain 2x
Image mode Full vertical binning
Acquisition mode Kinetic series
Baseline clamp ‘on’
The spectrometer was manufactured by Emvision LLC and built to spec for this project. It is worth noting that initial tests with the spectrometer showed signs of stray light on spectra. This was solved by inserting dark absorbing material on the inner walls of the spectrometer to block unwanted reflections in the system.
3.1.1.2 Raman probe adapted for robotic use
Current Raman probes for in vivo use have been designed for handheld use and are too large for robotic integration. As such, a Raman probe was designed for this purpose. From an optics standpoint, the probe has a similar design to the one currently used by industrial partner ODS
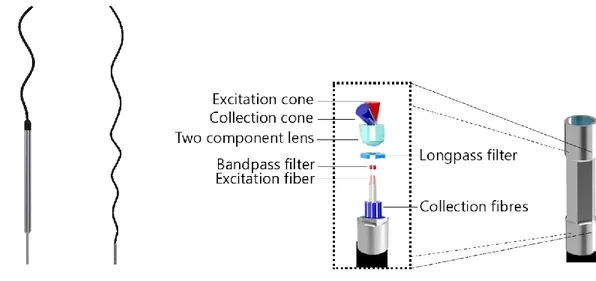
Medical for its ongoing clinical trial in humans. The probe consists of a central excitation optical fiber surrounded by 12 collection optical fibers. A bandpass filter on the excitation lens narrows the excitation spectrum while a notch shaped longpass covering only the collection fibers lets through wavelengths in the range of the Raman spectra being measured while filtering out contributions from dominant Rayleigh scattering. The distal lens at the tip of the probe sends the central excitation straight through while focusing captured light back into the collection fibers. From a mechanical standpoint, the outside of the probe casing was designed to be grasped by robotic instruments. It is a 2.5 mm wide and 6.5 mm long cylinder with its side walls flattened in a hexagonal pattern. The parallel flat faces are picked up by standard robotic graspers manufactured by Intuitive (be it a standard needle driver robotic arm or a Prograsp instrument). The following figure shows a close up view of the probe, a blown up view with all its components and a to scale comparison of the current design with the handheld probe used by ODS Medical and in previous studies.
Figure 3.2 : (left) Side-by-side and to scale comparison of the probe designed for robotic integration and the handheld one currently used for surgical interventions by our group and the industrial partner ODS Medical. (right) close-up view of the hexagonal profile machined on the probe tip to facilitate grasping using standard robotic equipment and a blown-up view of the main optical elements of the probe
The distal end of the probe extends into 1.5 m of optical fibres which connect the excitation fiber to the excitation source with an FC/PC connector and the 12 collection fibers to the spectrometer through an MTP connector. The probe and its coating are sterilisable through standard STERRAD procedures.
3.1.1.3 Laser & laser controller
The laser used for Raman acquisitions is equipped with both a 680 nm and a 785 nm diode coupled to a single FC/PC connector. Synchronising laser excitation and spectral acquisition required the development of a board capable of communicating with the laser (to control power and wavelength selection), the spectral acquisition software (to determine which power and wavelength to deploy) and the camera (to ensure synchronisation). The controller was developed using an Arduino Uno, an Analog Shield (Agilent electronics) and a custom shield to make all necessary electrical connections. It consists essentially of a high precision 10 bit DAC which is used to control laser power and a TTL switch which toggles between wavelengths. Laser activation is controlled by monitoring the “FIRE” pin on the Andor Newton camera. The master software sets the wavelength on the laser controller, which then monitors the fire pin for a rising edge. The laser is turned on immediately (within 1 ms of a rising edge) after camera fire and is turned off immediately on a descending edge (within 1 ms of a descending edge) of the camera fire. For safety, a watchdog timer is implemented on the controller to turn off the laser automatically after 500 ms in the event that the fire pin sequence does not function properly.
Figure 3.3 (left) Laser & laser controller (right) side view of laser controller with rear connections to laser unit.
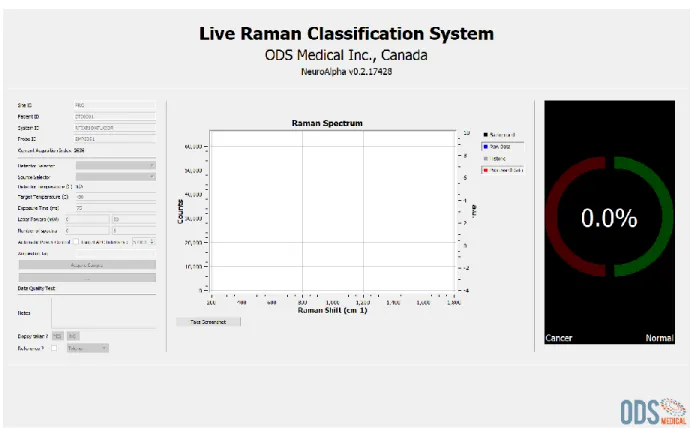
3.1.1.4 Software GUI for data acquisition
Figure 3.4 : Screenshot of the acquisition software used to perform all spectral measurements A software GUI is necessary to orchestrate spectral acquisitions, communicate between different system components and store information related to each measurement. The software used for this project is a modified version of ODS Medical’s software currently used to acquire Raman spectra with one wavelength. The software (written in C++ using Qt) was heavily adapted for this project. First and foremost, the software was modified to accommodate two excitation wavelengths and interface with a new laser controller. Software was written to calibrate power for both wavelengths, set excitation power, exposure time, and number of spectra independently. Acquisition parameters are communicated to an Arduino based laser controller (section 3.1.1.3) which then interfaces with the laser and camera to perform acquisitions. An automatic power control (APC) algorithm was developed to automatically determines optimal laser power for each laser to occupy the most dynamical range of the CCD detector. When enabled, the APC algorithm performs two single acquisitions per wavelength on the sample prior to performing the full one. Since the relationship
between signal intensity and laser power used is linear, the software uses the dynamical range occupied at each of these two powers to do a linear interpolation of optimal power for each wavelength. In addition to incorporating two wavelengths, the software was modified to allow external platforms to easily perform spectral acquisitions. A TCP/IP server was written which allows clients to simply connect to a specified IP and port to communicate. Optional parameters allow to set specific parameters and send information to identify/landmark acquisitions. The following figure illustrates the simplicity of connecting to the platform with two code snippets (one in matlab, one in python) showing all code required to initiate an acquisition.
function response = ODSCommunicate(ip, port,i)
t = tcpip(ip, port, 'Timeout', 3);
fopen(t); fwrite(t,'go'); fwrite(t,num2str(i)); start = clock; Timeout = 2; response = fread(t,1);
while (isempty(response) || response ~=100 ) response = fread(t,1); end response = char(response); end importsocket
# Server adress and communication parameters
TCP_IP = '169.254.113.23' #TCP_IP = '127.0.0.1'
TCP_PORT = 50382 BUFFER_SIZE = 1024
# Info to send to server
MESSAGE = "go"
ID = "123"# a string used to describe the measure (the ID will be saved to file with each acquisition)
# conncetion to the server and data exchange
s = socket.socket(socket.AF_INET, socket.SOCK_STREAM) s.connect((TCP_IP, TCP_PORT))
s.send(MESSAGE) s.send(ID)
#the server will return a 'RCCC' string after a succesful acquisition where : # R is the classifer result (0 - no classification, 1 - class 1 , 2 - class 2 (classifier dependant) )
# CCC is a number between 0 and 100 representing classifier confidence
data = s.recv(BUFFER_SIZE) print(data)
Figure 3.5 : examples of TCP/IP protocol required to communicate with the RS platform via a specified IP/Port in Matlab (left) and Python (right)
3.1.1.5 Raman shift (x axis) and relative intensity (y axis) calibration
X-axis and relative intensity correction are performed using molecular standards (acetaminophen & NIST 2241 respectively). X-axis to pixel correspondence is obtained using a 785 nm fingerprint Raman spectrum of Tylenol. Peaks from the spectrum obtained by the system are compared to reference peak positions (using a purpose built GUI shown in the following figure) and a polynomial fit is used to compute the x-axis to pixel correspondence of the measured spectrum.
Figure 3.6 : software used to compute x-axis to pixel correspondence of the spectrometer. Peaks from a measured Tylenol spectrum are matched to their corresponding peaks on a reference
spectrum one by one.
The following figure shows the measured spectrum plotted against it’s calibrated x-axis with an overlay of the reference spectrum showing proper peak alignment.
Figure 3.7 : calibrated measured spectrum overlayed with reference spectrum showing proper peak alignment
This technique is not suitable for the high-wavenumber (680 nm excitation) spectrum because of a relatively low peak count. As such, x-axis calibration for high-wavenumber spectra is calculated using the precise excitation wavelengths (within 0.15 nm) provided by the laser manufacturer. The calibrated x-axis is converted from wavenumbers to corresponding nm and back using precisely known excitation wavelengths and the following equation.
∆𝑤 = (1 𝜆0− 1 𝜆1) | 𝜆0𝑖𝑠 𝑡ℎ𝑒 𝑒𝑥𝑐𝑖𝑡𝑎𝑡𝑖𝑜𝑛 𝑤𝑎𝑣𝑒𝑙𝑒𝑛𝑔𝑡ℎ (𝑛𝑚) 𝜆1𝑖𝑠 𝑡ℎ𝑒 𝑠𝑝𝑒𝑐𝑡𝑟𝑢𝑚 𝑤𝑎𝑣𝑒𝑙𝑒𝑛𝑔𝑡ℎ (𝑛𝑚 ∆𝑤 𝑖𝑠 𝑡ℎ𝑒 𝑅𝑎𝑚𝑎𝑛 𝑠ℎ𝑖𝑓𝑡 (𝑐𝑚−1)
Relative intensity (y-axis) correction is obtained using a NIST 2241 relative intensity correction fluorescence standard. The standard is provided with a certified polynomial for the theoretical spectrum( 𝐼𝑆𝑅𝑀(∆𝑤) ) of the standard which relates the relative spectral intensity to the Raman shift. Dividing the theoretical curve by a measured spectrum of the standard (𝑆𝑆𝑅𝑀(∆𝑤)) can be
used to determine a spectral intensity-response correction (𝐼𝑐𝑜𝑟𝑟(∆𝑤)) unique to the Raman system[19]. This correction curve can then be used to obtain Raman spectra (𝑆𝑐𝑜𝑟𝑟(∆𝑤)) that are corrected for a number of, but not all, instrument-dependent artifacts[19] through simple element to element multiplication. The following equations summarize the process of relative intensity correction applied to each processed spectrum.
𝐼𝑆𝑅𝑀(∆𝑤) = 𝐴0+ 𝐴1∗ (∆𝑤)1+ ⋯ + 𝐴5 ∗ (∆𝑤)5| 𝐴𝑛 𝑎𝑟𝑒 𝑐𝑒𝑟𝑡𝑖𝑓𝑖𝑒𝑑 𝑝𝑜𝑙𝑦𝑛𝑜𝑚𝑖𝑎𝑙 𝑐𝑜𝑒𝑓𝑓𝑖𝑐𝑖𝑒𝑛𝑡𝑠 ∆𝑤 𝑖𝑠 𝑅𝑎𝑚𝑎𝑛 𝑠ℎ𝑖𝑓𝑡 (𝑐𝑚−1) 𝐼𝑐𝑜𝑟𝑟(∆𝑤) = 𝐼𝑆𝑅𝑀(∆𝑤) 𝑆𝑆𝑅𝑀(∆𝑤) 𝑆𝑐𝑜𝑟𝑟(∆𝑤) = 𝑆𝑐𝑜𝑟𝑟(∆𝑤) ∗ 𝐼𝑐𝑜𝑟𝑟(∆𝑤)
3.1.2 Clinical integration & workflow
The modified probe is designed to be inserted to the patient using a “drop in” approach. The Raman probe is inserted to the patient through a laparoscopic port. This can either be the port used for the camera endoscope or a laparoscopic assistant port. Assistant ports are insertions commonly used in RA-RP surgery which are placed 5-10 cm away from robotic arm ports for surgical assistants to insert classic laparoscopic instruments during the surgery. Trocards span these ports and commonly have diameters between 8-12 mm leaving 5.5 – 10.5 mm of clearance for the probe fiber to move when being manipulated. When the surgeon is ready to use the RS probe, the laparoscopic assistant removes it from its sterile packaging and feeds it through the chosen port. Once the probe is inserted to the patient, the surgeon uses may use his instruments to grasp it and prepare for RS measurements. The following figure shows a CAD rendered view of the proposed approach.
Figure 3.8 : 3D rendered representation of integration to the patient. The probe is inserted through an accessory or camera port and manipulated by a standard da Vinci laparoscopic
instrument to reach the target anatomy (red)
Once the probe is inserted to the patient and picked up by a da Vinci arm, the surgeon and clinical staff coordinate with the RS system operator to perform acquisitions as follows :
1. The surgeon/operator places the probe on the area to be interrogated. 2. The surgeon gives an audible cue to perform the acquisition.
3. The Raman operator performs an acquisition and gives an audible cue when it is done. 4. The surgeon/operator communicates landmarking information to the RS system operator
who logs it in the software with the corresponding measurement.
3.1.3 System validation
System validation was performed using a custom made 3d-printed phantom filled with identical silicone insertions. The RS system coupled to a da Vinci robot manipulated by a trained surgeon was used to perform spectral acquisitions on each of the insertions putting the probe at various angles and spectra were compared for repeatability. More details and results on this process are presented in section 4 of this thesis.
Complementary to the phantom evaluation, light contributions from the da Vinci robot’s LED based endoscopic illuminator were measured using the spectrometer to assess whether they would have an impact on spectral measurements taken in vivo. The following figure shows background spectra (laser powered off) acquired with both the illuminator ‘on’ and ‘off’.
Figure 3.9 : light contribution of the da vinci illuminator on a background measurement when 'on' and 'of'
Both ‘on’ and ‘off’ background spectra show no sharp peaks and very weak intensities when compared to the signal of interest : they occupy roughly 300/62000 CCD counts while the raw Raman/fluorescence signal occupies ~20-60000/60000 CCD counts. Based on these findings the illuminator was kept ‘on’ during in vivo measurements described in section 3.2.2.
3.2 Objective 2: Collect ex vivo and in vivo Raman spectra from
human prostate and peri prostatic organs/tissues
Gathering a large dataset is an essential requirement to assessing the potential of RS to perform prostate tissue characterization. Due to the difficulties associated with gathering in vivo spectra, a larger ex vivo dataset was first acquired to assess classification potential. In vivo data was then acquired on 5 patients as a first step towards gathering a comparable dataset and a proof of concept of the feasibility of performing RS in vivo during RARP.
All components of this study were approved by the institutional ethics Review Board (CHUM Research Center, Montreal, Canada, REB #17.149), and all methods were performed in accordance with the relevant guidelines and regulations.
3.2.1 Collect Raman spectra from whole prostates following RP
RS measurements were performed on the surface of whole, unprocessed, freshly excised human prostates immediately following RP on 20 patients. To perform these measurements, the RS system was placed on a mobile cart which was brought directly to the operating theatre at the end of RA-RP procedures. Measurements were performed in a light-tight box equipped with an articulated arm used to secure the probe during measurements as depicted in the following figure :
Figure 3.10 : inside the light-tight box used to perform RS acquistions ex vivo at the end of RA-RP
For measurements, the prostate was visually segmented into gross anatomical regions and ~5 spectra per prostate were acquired at each of the following:
2. The base region 3. The posterior region 4. The left lateral lobe 5. The right lateral lobes
Spectra were also collected on the following extra-prostatic structures when sufficient tissue was present following RP :
1. The seminal vesicles 2. The vas deferens canals
Each RS acquisition consists of a fingerprint (785 nm excitation) and a high wavenumber (680 nm excitation) taken sequentially with the acquisition parameters listed in table 3.2.
Table 3.2 : Range of acquisition parameters used throughout the ex vivo and in vivo experiments
Spectra were acquired collected across patients and anatomical origin will be compared to assess the feasibility of using RS as a tool to characterize prostate tissue and distinguish prostatic from extra prostatic tissue/organs. Details on the amount of spectra collected from each region and number of patients can be found in chapter 4 of this thesis.
Excitation wavelength (nm) Spectral range (cm-1) Exposure time (mS) Delivered power (mW) # of spectra per
acquisition Camera gain
680 500-2000 100 0-150 10-15 2X
3.2.2 In
vivo
data
collection
during
robotic-assisted
radical
prostatectomy procedures
The system presented above was used during RARP to collect data from 5 human prostates in vivo. Data was collected in the same anatomical regions of the prostate as the ex vivo portion o the sreseach
Table 3.3 : Distribution of in vivo Raman spectra acquired in surgical cavity during radical prostatectomy procedures.
Anatomical region Sub-region N samples
Anterior 7 Apex 1 Base 6 Extra-prostatic 13 Neurovascular Bundle 5 Seminal vesicles Bladder 3 5 Total 20
3.2.3 Process automation for cancer detection (automated platform)
A complementary portion of this work consisted of working on the automation of data acquisition for prostate cancer research developed by Aubertin et al. Aubertin’s method (results available in literature review) consists of acquiring Raman spectra on a cross section of prostate harvested immediately following RP. Roughly 50 spectra are acquired on a ~ 1 cm cross section of prostate and each point interrogated is manually labelled with a dot of ink. The prostate slice is then sent for histo-pathological analysis which provides a diagnosis for each of the labelled spots of ink.
Figure 3.11 : current process for performing Raman measurements on a prostate slice and obtaining registration from histopathology.
Useful machine learning based application of these datasets require large amounts of data. While this process works, it is both lengthy and labor intensive. As such, through supervision of and collaboration with a group of 4th year engineering students at Polytechnique Montreal this process was fully automated.
Automation was achieved by modifying a readily available and open source 3D printer to accommodate a Raman probe. The platform is equipped with a bird’s eye view camera which provides an overhead view of the measuring base. A graphical interface (coded in Matlab) allows the user to select points to be interrogated on the specimen graphically. Once all points are selected, the platform begins acquiring spectra by repeating the following sequence :
1. The probe is placed n cm (user configurable) above the platform. 2. The probe is displaced above the point selected in the XY plane.
3. The probe descends ~0.5 mm at a time until contact with the point selected is achieved. Contact is detected by monitoring a modified digital kitchen scale placed below the sample. 4. The platform communicates with the ODS Raman acquisition software and an acquisition
is performed. An acquisition ID is sent to the ODS software which is logged with the spectral data.
5. The probe is lifted n cm and once again communicates with the ODS software. A low power acquisition is performed to assess whether the probe tip needs to be cleaned.
6. Steps 1-4 are repeated until all points selected by the user have been interrogated
Figure 3.12 : (left) Conceptual view of automated platform. (center) Complete working version of automated Raman platform. (right) mask generated from platform camera image for registration with histopathology
Platform positioning accuracy was validated to be <1 mm by substituting the probe with a marker and selecting points on a sheet of millimetric paper
Figure 3.13 : Evaluating platform precision : a marker was mounted on the platform instead of the Raman probe. Points were selected on milimetric paper using the platform software and distance between point selected and point inked was measured
3.3 Objective 3: Classification/tissue characterization based on
acquired datasets
3.3.1 Objective 3.1 : Train algorithms capable of differentiating prostatic
from peri-prostatic tissue
Spectra originating from the prostate (apex, base, lateral lobes, anterior face) were grouped together and labelled as ‘prostate’ spectra while spectra collected on surrounding anatomy (vas deferens, seminal vesicles) were labelled ‘extra prostatic’ based on clinical utility defined by a urologist and
pathologist collaborating on the project. The Matlab classification toolbox was then used to test a variety of different classifiers and assess their performance on the dataset. Among these were LDAs,, regular SVMs and SVMs with quadratic or cubic kernels. A holdout validation approach was used where 75% of the initial dataset is used as a training set while 25% is set aside to assess performance of the trained classifier. Most classifiers performed reasonably on the dataset though quadratic/cubic SVMs returned the best performance. The following figure illustrates the workflow in assessing classification performance while results are presented in chapter 4 of this thesis.
CHAPTER 4
ARTICLE 1 : INTEGRATION OF A RAMAN
SPECTROSCOPY SYSTEM TO A ROBOTIC-ASSISTED SURGICAL
SYSTEM FOR REAL TIME TISSUE CHARACTERIZATION DURING
RADICAL PROSTATECTOMY PROCEDURES
The work outlined above set the stage for a peer reviewed publication in the Journal of Biomedical Optics which is currently submitted and awaiting peer review. The following chapter presents this article as it was published. The publication is titled “Integration of a Raman spectroscopy system to a robotic-assisted surgical system for real time tissue characterization during radical prostatectomy procedures’ and its authors are the following :
Michael Pintoa,b, Kevin C. Zornb, Jean-Philippe Tremblaya, Joannie Desrochesa,b, Kelly Aubertina,b,
Eric Marpled, Chris Kentc, Frederic Leblond*a,b, Dominique Trudel*b, Frederic Lesage*a,e
aPolytechnique Montreal, CP 6079, Montreal, Canada, H3C3A7
bCentre de Recherche du Centre Hospitalier de l’Université de Montréal, 900 rue Saint-Denis, Montreal, Canada, H2X0A9 cODS Medical, 5155 Avenue Decelles, Montreal, Canada, H3T2B2
dEmVision LLC, 1471 F Road, Loxahatchee, U.S.A, 33470
eCentre de Recherche de l’Institut de Cardiologie de Montréal, 5000 Bélanger Est, Montréal, Canada, H1T 1C8 *these authors contributed equally to this work
4.1 Abstract
Surgical excision of the whole prostate through a radical prostatectomy (RP) procedure is part of the standard of care for prostate cancer. Positive surgical margins (cancer cells having spread into surrounding non-resected tissue) occur in as many as 1 in 5 cases and strongly correlate with disease recurrence and the requirement of adjuvant treatment. Margin assessment is currently only performed by pathologists hours to days following surgery and the integration of a real-time surgical readout would benefit current prostatectomy procedures. Raman spectroscopy (RS) is a promising technology to assess surgical margins: its in vivo use during RP could help insure the extent of resected prostate and cancerous tissue is maximized. In this work, we thus present the design and development of a dual excitation RS system (680 nm and 785 nm excitations) integrated to the robotic da Vinci surgical platform for in vivo use. Following validation in phantoms, spectroscopic data from 20 whole human prostates immediately following RP was obtained using the system. With this dataset, we were able to distinguish prostate from extra prostatic tissue with
an accuracy, sensitivity, and specificity of 91%, 90.5%, and 96% respectively. Finally, the integrated RS system was used to collect preliminary spectroscopic data at the surgical margin in vivo in 4 patients.
Keywords: Raman spectroscopy, prostate cancer, robotic surgery.
4.2 Introduction
Prostate cancer is the second most frequently diagnosed cancer world-wide[1]. In the United States, in 2015, there were an estimated 220,800 new cases and 27,540 deaths, namely approximately 9% of all cancer-related deaths[2]. Surgical excision of the whole prostate through radical prostatectomy is an important part of the standard of care for prostate cancer. Recent large surveys of the SEER and National Cancer databases show an increase in the use of radical prostatectomy to 40-55% of cases while rates of radiotherapy based treatment have decreased for medium and high risk patients over the past decade[38], [39]. Radical prostatectomy procedures can be performed either using open or minimally invasive techniques (classic laparoscopy or robotic-assisted surgical methods). Minimally invasive techniques have comparable clinical outcomes, however robotic-assisted prostatectomy procedures lead to shorter hospital stays, less blood loss and reduced complication rates[3]. Furthermore, robotic surgery provides magnified, stereoscopic, high definition visualization, a wide range of motion (7 degrees of freedom), elimination of tremor, and surgeon comfort at a seated console[40]. Adoption of robotic surgery systems has also been rising over the last decade: a retrospective study of more than 500,000 prostatectomies performed in the U.S. found adoption rates for robotic surgery leaping from 0.7% in 2003 to 42% in 2010[41].
The clinical objective of a radical prostatectomy procedure is the complete removal of the organ while sparing nerves and other surrounding tissues. Removing the entirety of the prostate is made difficult by the lack of a clear histologic capsule which often results, in part due to limitations of current tissue imaging techniques, in prostate tissue being left in the surgical cavity after the procedure in as many as 29% of cases[4]. This is an important clinical problem often leading to biochemical recurrences, namely a rise in the blood level of prostate-specific antigen (PSA) in prostate cancer patients after the surgical treatment, which may misleadingly be interpreted as