UNIVERSITÉ DE MONTRÉAL
AUTOMATED REFUELING SIMULATIONS OF A CANDU FOR THE
EXPLOITATION OF THORIUM FUELS
BRADFORD HOLMES
DÉPARTEMENT DE GÉNIE PHYSIQUE ÉCOLE POLYTECHNIQUE DE MONTRÉAL
MÉMOIRE PRÉSENTÉ EN VUE DE L’OBTENTION DU DIPLÔME DE MAÎTRISE ÈS SCIENCES APPLIQUÉES
(GÉNIE ÉNERGÉTIQUE) DÉCEMBRE 2013
UNIVERSITÉ DE MONTRÉAL
ÉCOLE POLYTECHNIQUE DE MONTRÉAL
Ce mémoire intitulé:
AUTOMATED REFUELING SIMULATIONS OF A CANDU FOR THE
EXPLOITATION OF THORIUM FUELS
présenté par : HOLMES Bradford
en vue de l’obtention du diplôme de : Maîtrise ès sciences appliquées a été dûment accepté par le jury d’examen constitué de :
M. MUREITHI Njuki-William, Ph.D, président
M. KOCLAS Jean, Ph.D, membre et directeur de recherche M. HÉBERT Alain, Doct., membre et codirecteur de recherche M. TEYSSEDOU Alberto, Ph.D, membre
DEDICATION
ACKNOWLEDGMENTS
Firstly, I would like to thank Jean Koclas for accepting me as his student and for providing direction and support throughout the project. I would also like to thank Alain Hebert for his help and advice. Also, I thank the rest of the department for the good advice and help in all aspects of completing this degree.
I would like to thank the students in the lab for the collaboration and support throughout the courses and projects for a mutually beneficial experience.
Lastly, I would like to thank my family and friends for the guidance and advice that is always acknowledged and appreciated.
RÉSUMÉ
Les réacteurs nucléaires CANDU ont la caractéristique unique de pouvoir utiliser et exploiter différentes options ou choix de combustibles afin de produire de la puissance électrique utilitaire. Le Thorium, un isotope fertile naturel, est une option qui doit être explorée. Le thorium est plus abondant que l'Uranium, qui est le combustible type actuellement utilisé. De plus, le Thorium est disponible dans de nombreux pays qui désirent développer l'énergie nucléaire.
Ce document est l'aboutissement d'un projet qui explore, teste et analyse la faisabilité de l'utilisation du thorium dans un réacteur CANDU. Dans le cadre de ce projet, nous avons premièrement développé un ensemble de calculs de réseau bidimensionnels et de calculs de mécanismes de réactivité tridimensionnels en utilisant le code DRAGON4. Cette étape est répétée pour plusieurs concentrations de thorium. Les données générées par ces calculs sont par la suite utilisées pour déterminer un enrichissement opérationnel du thorium. Cette recherche est effectuée par une procédure d'élimination et d'optimisation de certains paramètres clés incluant, mais non limité, au burnup moyen et à l'évolution de la réactivité. À cette fin, le projet a permis de déterminer qu'un enrichissement de 1 % du thorium était viable.
Les calculs de coeur complet ont été réalisés par le code DONJON4. Un programme qui simule les opérations de rechargement dans un réacteur CANDU pour ce type de combustible a été développé et a été exécuté pour une période de simulation d'une centaine de jours. Le programme et la sélection en combustible ont satisfait toutes les conditions fixées sur la totalité de la période de simulation. Le programme nécessitera davantage d'optimisation avant qu'il puisse être largement utilisé.
La sélection de combustible a également été examinée dans le cas où une insertion de réactivité est simulée. Le retrait de la barre de compensation numéron 11 a été analysé et comparé à un cas classique CANDU antérieur afin de s'assurer de l'absence de déviations ou d'évolutions indésirables. Dans ce cas, les résultats de la simulation ont été trouvés acceptables, sans déviations sensibles par rapport au cas classique CANDU.
ABSTRACT
CANDU nuclear reactors are in a unique circumstance where they are able to utilize and exploit a number of different fuel options to provide power as a utility. Thorium, a fertile isotope found naturally, is one option that should be explored. Thorium is more abundant than uranium, which is the typical fuel in the reactor and the availability of thorium makes nuclear energy desirable to more countries.
This document contains the culmination of a project that explores, tests, and analyzes the feasibility of using thorium in a CANDU reactor. The project first develops a set of two-dimensional lattice and three two-dimensional control rod simulations using the DRAGON Version 4 nuclear physics codes. This step is repeated for many concentrations of thorium. The data generated in these steps is then used to determine a functional enrichment of thorium. This is done via a procedural elimination and optimization of certain key parameters including but not limited to average exit burnup and reactivity evolution. For the purposes of this project, an enrichment of 1 % thorium was found viable.
Full core calculations were done using the DONJON 4 code. CANFUEL, a program which simulates the refueling operations of a CANDU reactor for this fuel type was developed and ran for a simulation period of one hundred days. The program and the fuel selection met all selected requirements for the entirety of the simulation period. CANFUEL requires optimization for fuel selection before it can be used extensively.
The fuel selection was further scrutinized when a reactivity insertion event was simulated. The adjuster rod 11 withdrawal from the core was analyzed and compared to classical CANDU results in order to ensure no significant deviations or unwanted evolutions were encountered. For this case, the simulation results were deemed acceptable with no significant deviations from the classical CANDU case.
TABLE OF CONTENTS
DEDICATION ... III ACKNOWLEDGMENTS ... IV RÉSUMÉ ... V ABSTRACT ... VI TABLE OF CONTENTS ...VII LIST OF TABLES ... IX LIST OF FIGURES ... X LIST OF ANNEXES ... XI LIST OF ABREVIATIONS ...XII
Chapter 1 INTRODUCTION ... 1
1.1 Thorium as a Fuel ... 1
1.2 Objective ... 2
1.3 Outline ... 3
Chapter 2 REACTOR PHYSICS CONCEPTS ... 4
2.1 Particle Flux ... 4
2.2 Nuclear Cross Sections ... 6
2.3 Transport Equations ... 6
2.4 Source Density and Transport Correction ... 7
2.5 Boundary Calculations and Leakage ... 8
2.6 Multigroup Discretization ... 9
2.7 Collision Probability Method ... 9
2.8 Burnup ... 10
Chapter 3 MODELING THE CANDU ... 12
3.1 2D Lattice Calculations ... 12
3.2 3D Modeling of a Reactivity Device ... 14
3.3 Full Core Calculations ... 15
3.4 Monte Carlo Validation ... 16
Chapter 4 FUEL SELECTION ... 18
4.1 Decision Criteria ... 18
4.2 Fuel Selection ... 20
Chapter 5 THE AUTOMATED REFUELING PROGRAM ... 24
5.1 Procedural Process ... 24
5.2 Channel Elimination ... 28
5.3 Channel Refinement ... 28
5.4 Channel Selection ... 29
5.5 Selection Check ... 31
5.6 Simulating for 100 Days ... 31
Chapter 6 REACTIVITY INDUCED ACCIDENT ... 36
6.1 Rod 11 Removal ... 36
CONCLUSION ... 41
BIBLIOGRAPHY ... 43
LIST OF TABLES
Table 3.1. K-eff Results from SERPENT and DRAGON Simulations. ... 17
Table 5.1. Channel selection constraints. ... 29
Table 5.2. Simulation results compared to the TA reference. ... 33
LIST OF FIGURES
Figure 3.1 37-Element CANDU Fuel Representation. ... 13
Figure 3.2. Reactivity Device Modeling in DRAGON. ... 14
Figure 3.3 Monte Carlo Convergence on k-eff for Uranium and Thorium Enriched Fuel. ... 17
Figure 4.1 K-eff of Selected Fuel Types with Respect to Burnup. ... 19
Figure 4.2. Average Exit Burnup Compared to Throium Enrichment. ... 20
Figure 4.3. Average Exit Burnup vs Bundle Shift ... 21
Figure 4.4. Reference Isotopic Densities. ... 22
Figure 4.5. 1% Thorium Enriched Isotopic Densities. ... 22
Figure 4.6. Delayed Neutron Fraction Comparison. ... 23
Figure 5.1. Channel Refueling Procedure ... 26
Figure 5.2. Refueling Script Procedure ... 27
Figure 5.3 Eliminated Channels After a Successful Channel Selection. ... 30
Figure 5.4 Maximum channel power results. ... 34
Figure 5.5 Maximum bundle power results. ... 34
Figure 5.6 Maximum, minimum and average zone levels. ... 35
Figure 6.1 Rod 11 Position in the Reactor ... 37
Figure 6.2 Reactor power after a rod removal event. ... 40
LIST OF ANNEXES
ANNEX 1 – CANDU CORE FIGURES ... 45
ANNEX 2 – REFUELING SIMULATION SCRIPT ... 47
ANNEX 3 – CHANNEL SELECTION FOR DAY 53 ... 53
LIST OF ABREVIATIONS
CANDU Canadian Deuterium UraniumtU tonnes uranium
GWe giga-watt electric MWth mega-Watt thermal
MWd/MTHE mega-Watt days per metric tonne heavy element TAV Time-average
INST Instantaneous
LZC Liquid Zone Controller MCA Mechanical Control Rod SOR Shut Off Rod
MC Monte-Carlo
FPD Full Power Day
CPPF Channel Power Peaking Factor HFP Hot Full Power
k-eff k-effective
Chapter 1. INTRODUCTION
1.1 Thorium as a Fuel
The nuclear power industry has been using uranium as the primary source of fuel since reactor technology first created a useful cycle for power production. Uranium-235 (235U), a fissile isotope is fissioned within the core and the energy released by fission is eventually transformed into more useful electricity. However, it has been determined through research and future projections that uranium will be harder to acquire at a low price for fuel in new nuclear reactors [1,2]. To compensate for the unavoidable decline in available natural uranium, thorium has been proposed as an alternative breeder fuel source [3,4]. Globally, there are approximately 435 nuclear reactors in operation with a combined electrical capacity exceeding 370 GWe. Combined, these reactors require about 77 000 tonnes of uranium oxide concentrate, and about 65 500 tonnes of uranium (tU) each year. It is forecasted that each electric gigawatt (GWe) of additional capacity will require an additional 195 tU mined per year, based solely on routine mining operations and disregarding initial fuel loading. Global supplies of uranium are finite and are approaching peak availability rapidly.
Thorium-232 (232Th ) is a naturally-occurring nuclide that is the most abundant of all thorium isotopes. It is of particular interest as a nuclear fuel source due to 232Th being a fertile nuclide, and its relative abundance when compared to naturally-occurring uranium ore. Comparatively, Canada’s estimated stores of uranium total approximately 500 000 metric tonnes [1]. This supply is predicted to place Canada in the forefront of future uranium exploration and production. Thorium’s breeding capacity results from neutron absorption into 232
Th. Thorium decays into protactinium-233 (233Pa) and then into uranium-233 (233U), a fissile long-lived isotope. This process is shown in the radiological decay chain below:
(1.1)
The added neutron economy is considered to be a major asset to thorium as a breeder in our simulations.
As of now, studies that involve thorium are being conducted using the CANFLEX fuel type. This fuel relies on uranium enrichment and an increase in the number of fuel pins and a burnable poison in the center pin. Greater fuel irradiations can be achieved; however, the need for enrichment limits the availability to prospective users of the fuel.
1.2 Objective
The goal of this study was to develop, test, and validate computational schemes using the CLE-2000 scripting language for the purpose of introduction of natural thorium into typical 37-element fuel bundles in a CANDU-6 reactor. Further, the computational schemes are used to determine the reactor kinetics responses of a reactivity insertion, and compare them to the response of the CANDU-6 reactor. These efforts are directed into making the CANDU-6 reactor more appealing to parties which are interested in the use of thorium as a fuel due to its inherent benefits.
To the aid of this report, reactor physics codes DRAGON and DONJON Version 4 will provide the necessary solutions to the neutron transport equations for cells and assemblies, and the solutions to the neutron diffusion equations for finite reactor analysis respectively [5,6]. DRAGON and DONJON were created partly to develop a nuclear analysis capability to support technical requirements of nuclear plant operations at the Gentilly-2 station, owned by Hydro-Québec.
The method by which this was accomplished started with the development of a 2-dimensional cell that calculates isotopic contents and subsequent macroscopic mixture cross-sections based on a multigroup neutron flux normalized to a specific heavy element fission power, and fuel irradiation. DRAGON solves the neutron transport calculation using the collision probability method with reflective boundary conditions. These calculations are verified by existing results available in the literature and Monte Carlo calculations performed with code SERPENT [7].
A 3-dimension cell was required for the calculation of incremental macroscopic cross-sections of the insertion and removal of reactivity devices. These reactivity devices include adjusters and Liquid Zone Controllers (LZC) as well as necessary guide tubes.
Full core calculations are composed of two sets of calculations: Time-averaged (TAV) calculations and Instantaneous (INST) calculations. TAV calculations are required to develop a
reference “average” or equilibrium which can be compared to for instantaneous calculations. This involves a core that has two separate burnup zones which allow some optimization of the average exit burnup of the channels. The INST calculations provide a more realistic view of the reactor. The reactor is continually refueled from a reference state to an equilibrium state, close to that of the TAV model, using an automated refueling program CANFUEL. From this state, reactor kinetics calculations were performed and compared to nominal CANDU-6 responses.
1.3
Outline
Chapter 2 covers the theories and concepts needed to understand the content of the remainder of the report. This should be used a reference and it should be noted that no new material is in this section. Chapter 3 introduces and explains the CANDU-6 reactor and how various models are used to create an accurate representation of the neutron physics of core and cell geometries. In Chapter 4, the fuel selection criteria, studies and final selection is documented. In Chapter 5, the automated refueling program CANFUEL is described in terms of methodologies, restrictions, and results. The reactivity insertion event is studied and compared to nominal CANDU-6 reactor kinetics and implications in Chapter 6. The conclusion ties the report together and makes suggestions on where the project should go next.
Chapter 2. REACTOR PHYSICS CONCEPTS
This chapter is required for a full understanding of the research conducted and presented in this report. It focuses on the methods and equations required to solve the neutron transport and neutron diffusion equations. This can be generalized to reactor physics. Reactor physics in the context of nuclear power generation describes the interaction between neutrons and matter. Neutrons collide with the nucleus of particles present in the reactor to produce a variety of outcomes. These outcomes are based on the energy of the colliding neutron and the characteristics of the nuclide in question. In order to extract power from fission energy, many interactions must take place, specifically fission. The neutron number density can be obtained as the solution to the transport equation. In order to successfully solve the neutron transport equation, several factors are required and will be developed in this section. Source density, transport correction, neutron leakage, multigroup discretization, and material cross-sections are necessary to solve for a static case. Perturbations to the reactor require additional information that can be determined using space-time kinetics. For a more in depth and complete description of these theories, please look to books by Alain Hebert and Daniel Rozon [8,9].
It is not practical to account for all realistic scenarios of the particles or neutrons. Several assumptions can be made without affecting the reliability of the solutions:
Relativistic effects can be ignored
Neutron-neutron interactions can be ignored
Neutrons are neutral particles and neutron mean free paths are straight lines Reactor materials are isotropic in space
Nuclides are in thermal equilibrium within mixture definitions
2.1 Particle Flux
The particle flux within a reactor is the description of the particle density in the context of the transport equation. The description of a single particle is defined by a set of seven quantities:
Three velocity coordinates. These include the velocity module with and the two direction components
The time t.
The particle density is represented as a distribution and can be described further such that is the number of partiles at time t, in the volume element surrounding point r, in the velocity element surrounding , and in the solid angle element surrounding . The particle density is a distribution of all factors except t, in which it is a function of.
The particle density can be made more useful by using it to define the angular flux and the integrated flux respectively, as shown below:
(2.1)
(2.2)
It may be more convenient to describe the flux in terms of particle energy or lethargy by replacing . Taking note that the particle speed is a distribution, the change of variables resolves as;
and (2.3)
where is the mass of the particle and is the maximum energy of the particle.
The angular current, which is described as a distribution of the number of particles per element of time of velocity , and direction , crossing a surface . With this, we also have the integrated current crossing the surface. A positive current is the particle flux heading in positive direction defined by the positive normal to the surface and the negative current is the particle flux heading in the negative direction defined by the negative normal to the surface. Both angular and integrated current are defined below respectively;
(2.5)
2.2 Nuclear Cross Sections
A nuclear cross section is simply the probability of a specified reaction to occur during a neutron nucleus collision. First, we take a parallel beam of mono-energetic neutrons, per unit surface and unit time and target a homogenous material with density particles per cubic centimeter. A reaction will occur at a rate which can be calculated using the microscopic cross-section for the specified reaction shown below:
(2.6)
This cross section is expressed in barns, which is 10-24 cm2. The macroscopic cross-section will take into account the entirety of the target and will then have units of cm-1.
(2.7)
2.3 Transport Equations
The transport equation is a balance of particles within an arbitrary control volume for a time that does not result in significant changes to the cross-sections of the materials. It is described in four terms, namely; the rate change of particles, the number of particles streaming out of the control volume, the number of collisions, and the number of new particles created. This equation is shown below:
(2.8)
During steady state conditions, the equation may be written as;
2.4 Source Density and Transport Correction
The source density accounts for secondary neutrons created by either fission or scattering reactions. Scattering reactions will include collisions that produce a neutron with a different energy than it began with, usually with a lower energy or a higher lethargy and (n,xn) reactions. The steady-state scattering source is described as:
(2.10)
where
= the macroscopic scattering cross-section that accounts for diffusion and (n,xn) reactions.
The fission source term can be assumed to be isotropic in the LAB and is independent of incident neutron direction. The fission neutrons are emitted as a distribution of energy defined as the fission spectrum . The spectrum for all possible neutron emission energies is normalized to 1. Thus, the isotropic fission source can be written as;
(2.11)
where
= total number of fissile isotopes.
= the number of emitted neutrons per fission times the macroscopic fission cross-section for the jth isotope.
While the fission source can be considered isotropic, scattering reactions are not. This can be accounted for with the use of the transport correction on the cross sections in the transport equation. To have an equation that depicts a more realistic outcome, a forward peaking component in the Legendre expansion of the differential scattering cross-section is added. This is shown as:
(2.12)
Where the two cross-sections on the right hand side of the equation are the modified Legendre coefficient and addition coefficient multiplied by the dirac delta term, respectively. The coefficients are calculated to preserve the Legendre moments and will not be covered here. However, the transport-corrected steady-state source density is presented below:
(2.13)
where the P0 transport-corrected component of the differential scattering cross-section is written
below:
(2.14)
2.5 Boundary Calculations and Leakage
To limit the resources required to obtain the desired results, a cell assembly is implemented to contain one “unit cell” of the CANDU reactor. This cell is one lattice pitch in length and width and contains the fuel assembly, tubing, and moderator. To simulate an infinite reactor, certain boundary conditions are applied to the unit cell. The albedo boundary condition relates the incoming flux with a known outgoing flux as such:
with (2.15) where is set to one to indicate a reflective boundary condition which helps to simulate an infinite lattice. The reflective boundary acts as a mirror reflection to neutrons incident on the boundary.
To model a more realistic reactor, one which has a k-eff equal to one, buckling is imposed. For this case, the fundamental mode approximation must be made. This means that the
flux is represented as the macroscopic distribution in space and a periodic fundamental flux which can be written as:
(2.16)
With this, the macroscopic distribution can be considered a property of the complete reactor and a solution to the following Laplace equation:
(2.17)
where the buckling B2 is a real number and is used to adjust the curvature of the distribution in order to achieve a critical reactor.
2.6 Multigroup Discretization
It is necessary, due to resource constraints, to divide the energy domain into subsections known as groups. Within each group, it is assumed that the neutrons found within the boundaries of the group have one speed, instead of a distribution of speeds. That speed corresponds to the average energy of neutrons within that group. There are 8 delayed neutron groups in accordance to the Jef 3.1.1 libraries [10]. A further condensation is required to complete the solution to the diffusion equation during full core calculations. Since we are operating with a CANDU reactor and the moderating ratio is quite large, it is typically accepted that 2 groups are all that is necessary [11]. These two groups are divided into fast and thermal neutrons, the energy of discrimination being 4 eV.
2.7 Collision Probability Method
The collision probability method was used in this report to determine the collision probabilities of the unit cell with a number of regions over an infinite reflective lattice. The collision probability is defined as the probability of a neutron born uniformly and isotropically in a region to undergo its first collision in a region of the unit cell. The collision probability is calculated based on a number of tracks which relies on the azimuthal angles and tracking density specified. This information is then used in conjunction with the macroscopic cross-sections for each region at each energy group to compute the collision probabilities. Thus, the integrated flux can then be calculated.
2.8 Burnup
Fuel burnup is the measure of energy released by fuel per unit mass of uranium during the time spent in the reactor and can be referred to as another measure of fuel irradiation time. However, the burnup of nuclear fuel is proportionally related to the time spent in the reactor. The relation between the burnup and time spent in the reactor is not exactly equivalent due to localized flux variations and therefore it is inappropriate to compare different fuel types with different enrichment levels and to effectively equate burnup to time spent in the reactor.
Fuel burnup is defined as the amount of fission energy produced by the fuel from the time it has entered into the reactor. It is measured as the energy produced per unit mass of original heavy element and has the common unit of megawatt-days per metric tonne heavy element (MWd/MTHE). In the case of thermal reactors, the heavy elements of interest are the fissile isotopes, uranium-235 and plutonium-239. Burnup is therefore a product of the reactor’s thermal power (P, MWth), the time the fuel has been irradiated in the reactor (t, days), the capacity factor of the reactor, and the original unit mass of heavy element (m, MWd/MTHE) related as follows;
(2.18)
This relation is only valid for the measure of burnup for the original heavy element fed into the reactor – it does not account for the production of any fissile isotopes due to fuel irradiation. The resonance absorption of uranium-238 atoms results in a noticeable fission yield of plutonium-239. The production of plutonium-239 adds to the quantity of fissile material and will further enhance the infinite-cell multiplicative factor.
2.9 Monte Carlo Method
The Monte-Carlo method is another approach which can be used to solve the neutron transport equation. The method obtains answers using the simulation of individual particles and recording the average behaviour of the particles in question. If the number of tracked histories is high
enough, it can often be similar to conducting an experiment. The physics of the code includes the following; weight, particle tracks, and neutron interactions. The weight is an individual particle or source contribution to the average. Realistically, this weight would be a unit weight per particle, however it is possible to assign a particle source unit weight for computational efficiency. The collective weight of particles will make up the pulse height.
Particle tracks start when a particle leaves the source and is subsequently tracked. Once the particle interacts with a material, a new track is started. If the interaction would induce additional particles in the material, subsequent tracks are then also initiated. Track lengths tallies are then used to determine important information from the system such as fluence, flux, and energy deposition. If the cell is a fixed homogenous region, the probability of the first collision can be determined by the following equation:
(2.19)
where is the macroscopic total cross section of the medium and is interpreted as the probability per unit length of a collision and is the length.
Neutron interactions occur when a neutron collides with a nucleus. The nuclide is identified and the reaction is treated to determine the resulting outcome of the collision. The results are based on the specified treatment and cross-sections of the material along with the weight, random number, nuclide size, and incident neutron energy.
Chapter 3. MODELING THE CANDU
To model the CANDU reactor and the fuel within, the DRAGON and DONJON Version 4 set of codes were used [5,6]. In the case of the fuel cell, a validation simulation was performed using SERPENT.
DRAGON is an open source software package that contains a collection of modules that can simulate the neutron behavior of a unit cell or a fuel assembly in a nuclear reactor [5]. It includes all of the functions that characterize a lattice cell code, namely: the interpolation of microscopic cross sections supplied by means of standard libraries; resonance self-shielding calculations in multidimensional geometries; multigroup and multidimensional neutron flux calculations.
DONJON is its sister program, designed to for the full reactor core modeling in 3D Cartesian and other geometries [6]. The modeling of the fuel lattice is done through defining the number of channels and bundles for each channel and each channel is recognized by specified names. Using either instantaneous or time-average methods, the interpolation of fuel properties with respect to fuel burnup can be achieved.
Reactivity control mechanisms are modeled using their material properties and position. SERPENT is a Monte-Carlo based program that models the infinite lattice of the fuel cell and is used to validate DRAGON calculations [7].
3.1 2D Lattice Calculations
The 2D lattice cell calculation is used to generate burnup dependent characteristics of the fuel. The cell consists of the fuel bundle, coolant and fuel channel tubing, and the surrounding moderator. The geometry is defined by the 37-element fuel bundle and CANDU reactor design [12]. Using the 281 group DRAGLIB library, JEFF 3.1.1, the material cross-sections are defined by their isotopic makeup and adjusted for temperature [10]. A sample of the geometry is included in the Figure 3.1.
Figure 3.1 37-Element CANDU Fuel Representation.
To obtain an accurate representation of the reactor from this geometry, reflective boundary conditions are applied to the cell with a B1 buckling set to a critical reactor, k-eff= 1. Self-shielding effects are applied to the cell during calculations using the USS: module. This will apply corrections to the microscopic cross-sections based on the self-shielding effect of resonant isotopes. The cell is then burned at a constant power 32 MWd/MTHE until an appropriate burnup is reached.
The 2D cell is the basis for the majority of the calculations required in this study. It is important that all the required data is stored and easily accessible for future use and consultation. This is done through the CPO: module. This is a database that stores homogenized cell data based on burnup or irradiation. The alternative method is to use the COMPO: module which stores all of the nuclear data produced in the lattice code. This is most effective when multiple parameters are being changed and all data needs to be stored. It is useful in this study where multiple initial concentrations of thorium are tried to determine an effective implementation in the CANDU reactor. Further implications could include a change in lattice pitch and fuel geometry such as the CANFLEX fuel design but are not within the scope of this study. Once the data is exported, it is now useful in modeling reactivity devices and a full core.
3.2 3D Modeling of a Reactivity Device
In order to properly model a full core, the inclusion of reactivity devices must be properly accounted for. This is done using DRAGON Version 4, taking advantage of the 3D Cartesian options in the GEO: module. Specifically, Mechanical Control Absorbers (MCAs), Adjuster Rods, and Liquid Zone Controllers (LZC) must be modeled. There are 4 MCAs which are provided as part of the reactor regulating system. They are physically identical to the Shut Off Rods (SORs) and are normally located outside the core. The Adjuster Rods are normally fully inserted in the core and are meant to be a shim for flux flattening. They are housed within a stainless steel tube. The LZCs are a mixture of water and helium and are located within the 14 zones of the core. They are meant to be a fine reactivity control for their respective zones and ensure an even burn of the fuel in that region with respect to the reactor.
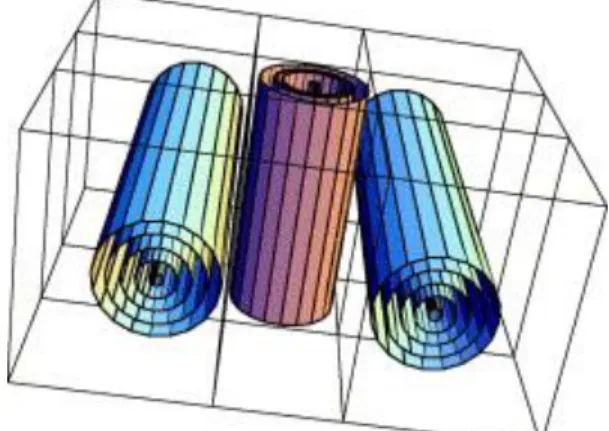
Calculations are preformed using the 3D Cartesian geometry that spans two lattice pitches in width and one in height, as well as one fuel bundle length in depth (57.150 cm x 28.575 cm x 49.520 cm). This model is shown in Figure 3.2.
Figure 3.2. Reactivity Device Modeling in DRAGON.
The fuel in this figure is taken from data obtained within the 2D lattice calculations and is homogenized for computational efficiency. The device is modelled in the center of the two fuel assemblies at various states to obtain differential cross-section data [13,14]. The states include a natural supercell with no device or housing and then progress to include only the housing and finally the housing and a fully inserted device. Two group energy condensations are used in accordance with the literature for a CANDU reactor [11].
After modeling, it is important to determine and store the incremental cross-section information for each device. This involves taking the 3-D geometry with the two fuel bundles and determining the incremental cross-section by simulating with the reactivity device fully inserted and then again with the device absent. The difference between the two results provides the incremental cross-sections which are used in full core calculations. Determining the device worth for LZC is done by creating a full core snapshot of a critical reactor with all controllers at 50% full. Devices are then inserted and then fully removed to determine the effect on reactivity in the core. The global reactivity worth of the devices can be determined from the perturbed reactivities as:
(3.1)
The total reactivity worth of the LZC in a CANDU core with typical fuel is often stated as roughly 7 mk. With the introduction of thorium into the lattice, the reactivity device worth is diminished [15]. For the fuel chosen, the total device worth of the LZC is 6 mk. This is consistent with the results above.
3.3 Full Core Calculations
The CANDU core contains 380 horizontal channels which contain 12 fuel bundles each. The fuel bundles are comprised of a uranium oxide pellets in each fuel pin. The core is divided into 14 zones for fine reactivity control and flux mapping. Within the core are 14 LZCs, 21 adjuster rods, and 4 MCAs which have been modeled and homogenized using the DONJON code. The time-averaged (TA) model and the instantaneous models are used to reference and describe the full core characteristics [16].
The time-averaged model of the CANDU is used to compute the burnup integration limits for each fuel bundle, the axial power-shape over the fuel lattice, the channel refuelling rates and the reactor core-average exit burnup [11]. The calculations are performed using equilibrium core conditions with the LZC set to 50% full. A bidirectional refueling scheme is used on a two-zone average exit burnup layout.
For the purposes of this project, TA calculations are used as reference results set to be nominal operations. Channel and zone powers will be used to compare instantaneous results to in
order to determine LZC levels and required zone reactivity for refuelling. The average exit burnups for the two burnup zones, will be used for determining channels that are required for refuelling in the refueling program. Core maps describing the regional zones and burnup zones are provided in Appendix 1.
There are two types of instantaneous calculations. The first is a random distribution based on burnup of the TA core. This is the starting point for the refueling simulation as well as decent projection of nominal power distribution within the core. This is done by finding the average exit burnup of the zone and then applying a large number of averaged random weightings to each channel to define an instantaneous channel burnup. After this is done for each channel in its respective zone, the instantaneous core calculation can be performed and the axial power shape should be very close to that of the TA calculation. Of course, each calculation is normalized to the total reactor power. Core decay and channel refuelling as well as accident type scenarios can then occur from this state.
3.4 Monte Carlo Validation
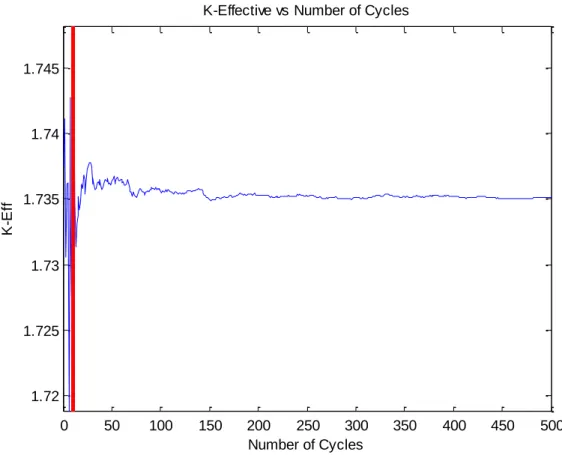
A benchmark simulation must be done in Monte Carlo (MC) in order to validate the results given in DRAGON. For this project, SERPENT was used to obtain these results. The geometry and boundary conditions were made identical to DRAGON calculations for the benchmark simulations. According to best practices, there are three main concerns that must be addressed when performing MC; sufficient initial cycles must be discarded prior to beginning the tallies in order to avoid contamination from initial guesses, a sufficient number of neutrons must be followed in each cycle so that the bias in reaction rate and k-eff are negligible, and the bias in the statistics must be recognized and dealt with [17]. From this, it is recommended that 10 000 or more neutrons per cycle be used in two-dimensional lattice calculations. The validation simulations used 500 cycles and followed 20 000 source neutrons while the first 10 cycles were discarded. The convergence on k-eff with the number of cycles is shown in the figure below.
Figure 3.3 Monte Carlo Convergence on k-eff for Uranium and Thorium Enriched Fuel. Enrichment of both uranium and thorium was considered to test the accuracy and benchmark against DRAGON results and is shown in Figure 3.3. The k-eff with a constant neutron weight was obtained from the MC calculations as 1.73509 ± 0.00042. Comparison to the results obtained using DRAGON, for which the k-eff was 1.72972. This yields an error of 0.3% which is determined to be acceptable. Results from DRAGON were generated using the sub-group approach with the 281-sub-group JEFF 3.1.1 DRAGLIB.
Table 3.1. K-eff Results from SERPENT and DRAGON Simulations.
SERPENT k-eff DRAGON k-eff Error %
1.73509 ± 0.00042 1.72972 0.2 0 50 100 150 200 250 300 350 400 450 500 1.72 1.725 1.73 1.735 1.74 1.745
K-Effective vs Number of Cycles
Number of Cycles
K
-E
Chapter 4. FUEL SELECTION
A new fuel selection was made to include fertile thorium-232. Limited data was produced and analyzed due to time constraints. The majority of the project time was spent developing the CANFUEL program which is described in Chapter 5. However, certain objectives were set out to be met and will be explained in the following sections. A selection was made that best met the majority of decision criteria while still maintaining an operational reactor.
4.1 Decision Criteria
A selection for the fuel was made based on the following decision criteria: Obtain the highest level of thorium concentration in the fuel
Use the 37-element CANDU fuel bundle geometry Fuel mixture is to be homogeneous in all fuel pins Average exit burnup must be as high as possible
Refueling rate must be similar to that of the CANDU reactor due to limits on the number of refuelings per day determined by the refueling machine
Fuel must meet safety standards discussed in Section 5
A closer look at some of the effects of each decision point will help to determine the final selection. Thorium, as discussed in the introduction, is a desirable fuel source that can and should be utilized in reactors in the future. The selection will be the fuel source that meets all of the other requirements and has the highest possible thorium concentration. Since we are limited to the CANLUBE fuel bundle with a homogeneous fuel mixture within each pin, the selection variables are as follows; thorium enrichment and the number of bundles replaced during a refueling operation.
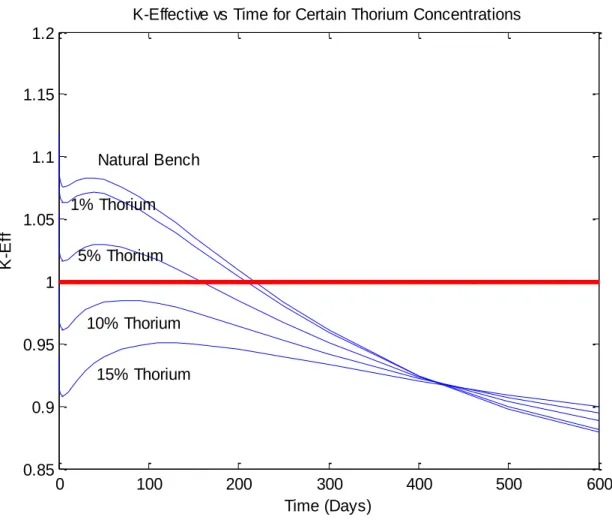
Reactivity insertion due to refueling is the main course of reactivity control in the CANDU reactor. It is very important that there is both a positive reactivity insertion due to refueling and that this insertion is enough to compensate for decay reactivity and required zonal reactivity. The enrichment of CANLUBE fuel with thorium causes the reactivity of insertion due to refueling to be smaller, compared to natural uranium. This difference becomes more
significant with higher enrichments and is not compensated for with the production of uranium-233 until much higher burnups. This relation is shown in Figure 4.1. Any fuel containing 10% or more thorium enrichment will not add reactivity to the core.
Figure 4.1 K-eff of Selected Fuel Types with Respect to Burnup.
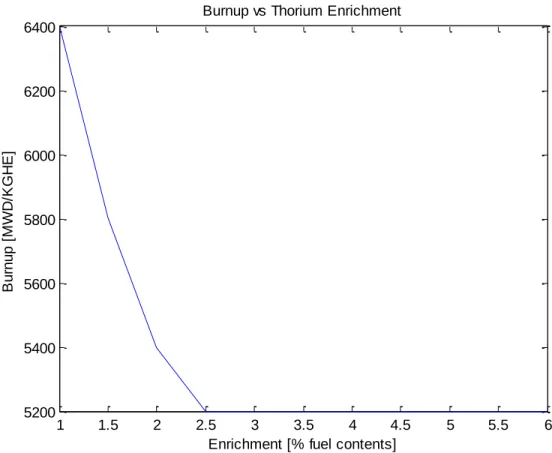
The trend of reduces returns with respect to an increase in thorium concentration is also apparent in the average exit burnup of refueled bundles. A minimum acceptable burnup of 5200 MWD/MTHE was set for the fuel which disregarded any enrichment over 2.5%. All values in Figure 4.2 are for an 8 bundle shift.
0 100 200 300 400 500 600 0.85 0.9 0.95 1 1.05 1.1 1.15 1.2
K-Effective vs Time for Certain Thorium Concentrations
Time (Days) K -E ff Natural Bench 1% Thorium 5% Thorium 10% Thorium 15% Thorium
Figure 4.2. Average Exit Burnup Compared to Throium Enrichment.
In order to reduce fueling costs, exit burnup should be as high as possible. An increased burnup of the fuel indicated a longer residency time which means less fuel is required to refuel the reactor. Lowering the number of bundle shifts will increase the exit burnup of the fuel but increase the refueling rate and put additional strain on the refueling machine. Therefore it is desirable to achieve burnup and refueling rates that are similar to the CANDU but have an increase in thorium enrichment. The refueling rate for a CANDU today is roughly 2.2 refueling procedures of 8 bundles per day.
4.2 Fuel Selection
Based on these criteria, an enrichment of 1% with an 8-bundle shift was chosen. This provided an average refueling rate of 2.27 refueling procedures per day and an average exit burnup of 5992.57 MWd/MTHE. The average exit burnup compared to the bundle shift is shown in Figure 4.3. 1 1.5 2 2.5 3 3.5 4 4.5 5 5.5 6 5200 5400 5600 5800 6000 6200 6400
Burnup vs Thorium Enrichment
Enrichment [% fuel contents]
B u rn u p [ M W D /K G H E ]
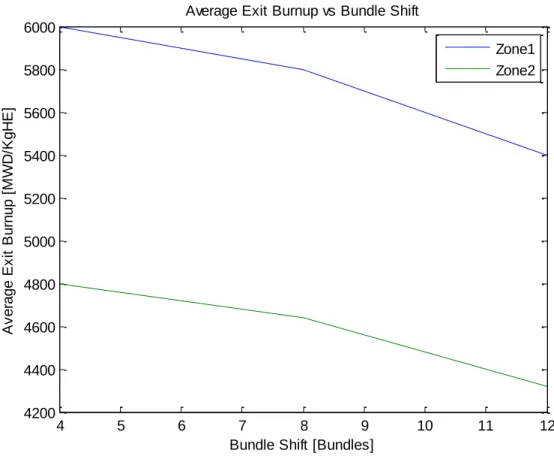
Figure 4.3. Average Exit Burnup vs Bundle Shift
As shown in Figure 4.3, a reduction in the number of bundles per refueling procedure increases the average exit burnup.
It is important to ensure that the betas are similar to that of the CANDU reactor to ensure that shut down procedures are effective for the new fuel type. These values are primarily determined by the isotopes being fissioned. The delayed neutron fraction in each precursor group for each isotope can be determined by the following equation:
(4.1)
Which leads to;
(4.2) 4 5 6 7 8 9 10 11 12 4200 4400 4600 4800 5000 5200 5400 5600 5800 6000
Average Exit Burnup vs Bundle Shift
Bundle Shift [Bundles]
A v e ra g e E x it B u rn u p [ M W D /K g H E ] Zone1 Zone2
The isotopic depletion and betas for the CANDU and a fuel selection of 1% are shown in Figure 4.4 and Figure 4.5.
Figure 4.4. Reference Isotopic Densities.
Figure 4.5. 1% Thorium Enriched Isotopic Densities.
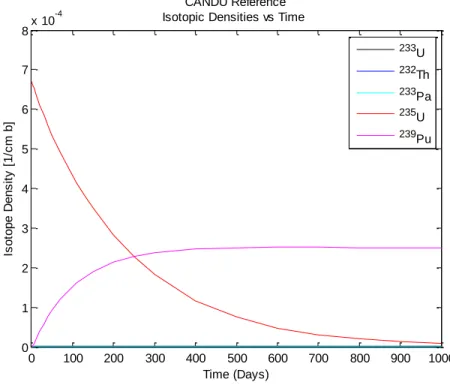
0 100 200 300 400 500 600 700 800 900 1000 0 1 2 3 4 5 6 7 8x 10 -4 CANDU Reference Isotopic Densities vs Time
Time (Days) Is o to p e D e n s it y [ 1 /c m b ] 233U 232Th 233Pa 235U 239Pu 0 100 200 300 400 500 600 0 0.1 0.2 0.3 0.4 0.5 0.6 0.7 0.8 0.9 1x 10 -3 Thorium Enrichment of 1.0 Isotopic Densities vs Time
Time (Days) Is o to p e D e n s it y [ 1 /c m b ] 233 U 232 Th 233Pa 235 U 239Pu
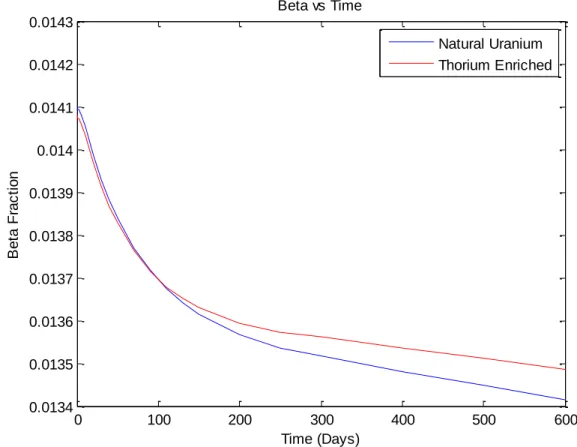
Figure 4.6. Delayed Neutron Fraction Comparison.
There is no significant change in the betas or isotopic depletion of the new fuel compared to the CANDU reactor. In the isotopic depletion graphs, the curves for each element closely resemble each other with the exception of thorium-232 which is not present in the CANDU core. The betas with respect to time also closely resemble one another. This is due to the minor quantities of thorium added to the fuel. The contributing isotopes to the beta fraction are U-233, U-235, and Pu-239. U-233 is only applicable in the case where the fuel is thorium enriched. The production of U-233, in combination with the new production, burnup, and decay of the other relevant isotopes creates a difference in the betas as shown in Figure 4.6.
0 100 200 300 400 500 600 0.0134 0.0135 0.0136 0.0137 0.0138 0.0139 0.014 0.0141 0.0142 0.0143 Beta vs Time Time (Days) B e ta F ra c ti o n Natural Uranium Thorium Enriched
Chapter 5. THE AUTOMATED REFUELING PROGRAM
The automated refueling program was developed in full for this project and is a set of procedures with the purpose of taking instantaneous and time-averaged data and performing channel refuelling as needed on the CANDU reactor. The core starts as an average of several random distributions of time averaged data. From there, the core is decayed and refueled as per scripts that analyze the parameters of the core in reference to the TA case and selected limits. Channels are carefully selected based on a set of predefined and dynamic rules in order to find a successful channel refueling procedure for that day. Once reactivity requirements are met, the core is simulated to decay for a Full Power Day (FPD) for the process to start once again. The exact procedures are outlined in the sections below.
5.1 Procedural Process
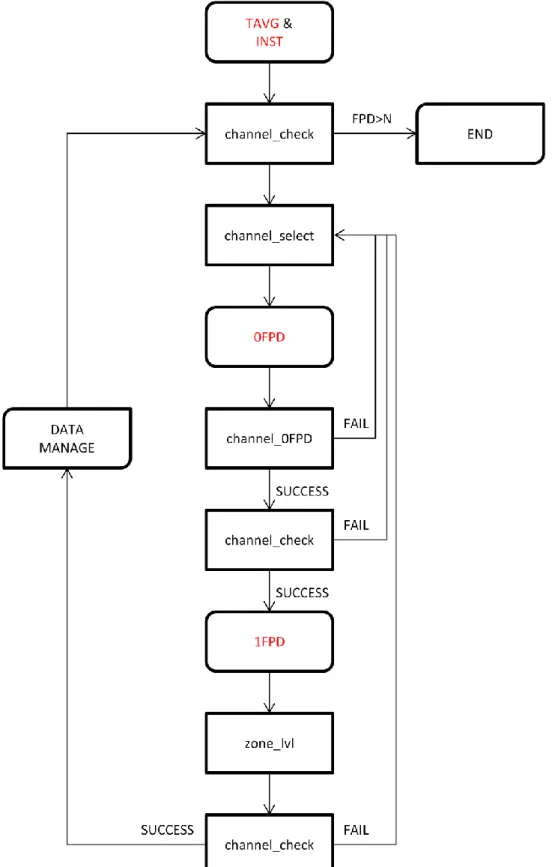
The process in which the procedures are performed is important for ensuring that the channels are refueled when required and the core is allowed to decay when the net core reactivity is positive. The top level procedure, named Master, is written in bash and is a managerial program dictating calls to other scripts and the transfer of data files. DONJON 4 is capable of writing ASCII files containing the data structures needed for analysis. These data structures are imported and analyzed by MATLAB scripts named; channel_select, channel_0FPD, and channel_check. The channel_select script is responsible for selecting the most eligible channel. channel_0FPD analyzes an instantaneous refueling of that channel and determines the reactivity added as well as if there are any rule breaches for the selected channel. The channel_check script analyzes the cumulative refueling procedures and determines when to proceed to the next day, as well as checks the core against the safety and procedural standards. Two DONJON scripts are used to perform instantaneous and one full power day refueling and decay procedures. The instantaneous script, 0FPD, refuels the selected channel after the channel_select script completed. 1FPD, is run once all the channels have been selected for that day. It refuels each channel from the previous day’s decay and then decays for 1 FPD.
The logical process of the channel refueling procedure and the program schematics are shown in Figure 5.1 and Figure 5.2. The first step is to run TA and a set of averaged random instantaneous “age” distributions of that TA model. This snapshot is the day 0 core data from
which CANFUEL will begin. The program then selects the best channels to be refueled and prioritizes them accordingly based on predetermined selection criteria. Then, channels are selected and refueled sequentially until reactivity requirements are met. A failure in this process results in the elimination of those channels from the final selection. Success results in a 1 FPD decay of the core and a progression into the next step where the process starts again. This process is repeated until the required number of days has been completed.
In Figure 5.2, the squared edges represent modules executed in MATLAB; the rounded edges represent modules executed in DONJON; and the combination of rounded and squared edges, along with the data transfer between modules not shown in this figure, is executed in sh.
5.2 Channel Elimination
The channel selection process determines which channel is most eligible for refueling based on a specific set of parameters. Each channel is tested and either eliminated or elected. A total of 100 of the most eligible channels are available as candidates.
The first set of constraints is based upon channel and bundle powers. The limits on channel and bundle power is 7300 kW and 935 kW respectively [11,18]. An initial set point of 6900 kW and 850 kW is used to eliminate channels which contain power levels greater than that specified. Rippled channel power, stated as the Channel Power Peaking Factor (CPPF) as described in equation 5.1, cannot exceed 1.10. Burnup constraints are also important for fuel economy and matching TA exit burnups. Any channel that falls below the TA exit burnup is also eliminated. Bundle and channel power and burnup information are retrieved from DONJON data files generated in the POWER data structure.
(5.1)
Alternative elimination constraints are such that if required zone reactivity becomes positive due to refueling, further refuelling in that zone is prohibited. If the channel has been refueled within the last two days; that channel and the surrounding 8 channels are eliminated from selection. Once these restraints have been applied, the remaining channels are all still eligible for refueling. The goal is to have one hundred of the most eligible channels remaining and so the restraints are either relaxed or tightened depending on how many channels are remaining.
5.3 Channel Refinement
Channels selections are tallied in order to select the most eligible channels. This is done first by eliminating ineligible channels and then refining the constraints mentioned in the previous section as shown in Table 5.1. This process depends on the number of channels selected initially. The parameter refinement is shown in the table below. The constraints are adjusted until 100 of the best channels are selected.
Table 5.1. Channel selection constraints.
Constraints Values Increment
Maximum channel power 6900 kW 1.0%
Maximum bundle power 850 kW 1.0%
Rippled channel power over TA channel power 1.05 1.0%
Channel burnup compared to TA 70% 1.0%
Last refuel date 2 days 0.1 day
5.4
Channel Selection
Channel selection is performed on eligible channels based on three sets of priority. The first priority relies on the required reactivity of the channel. The channels are divided into their respective zones and measured against TA values to determine the required reactivity. This is determined by [19,20]:
(5.2)
where
= the reactivity requirement of zone i
= the core reactivity decay following a FPD decay divided by the number of zones = the reactivity worth of the zone controller
= the current ZCU level
= the TA ZCU level
To determine the LZC fill for each zonal controller the snapshot model is compared to the TA model since this is the reference to which we try to obtain during the simulations. Zones are
initially set to 50% full with accordance to the TA model. From there they are incrementally filled according to the following equations:
(5.3) (5.4) where =
and = the maneuvering constant (120 and 2 respectively) = the average instantaneous flux
N = the number of zones
The zone with the highest reactivity requirement is given first priority. The second priority is given to channels that have been selected the most during the channel refinement selection. If a channel continuously meets the constraints it is more eligible than channels that fail to do so. The final priority is given to channels with the highest burnup. The most eligible channel is then selected. Once a channel is selected and has passed all checks, channels within √10 channels are eliminated as shown in the Figure below, from being selected in the same day. The selection process must continue until the adjusted reactivity requirement is satisfied.
5.5
Selection Check
Once a channel has been selected, 0FPD calculations are performed. The core must be analyzed to determine if further refuelling is necessary. The decision is based on the adjusted reactivity requirement. This is given in the equation below:
(5.5)
where is the reactivity insertion to zone i due to a refueling of channel j. The zone reactivity requirement is a negative quantity while the reactivity insertion upon refueling is positive. If the adjusted zone reactivity requirement becomes positive, the candidates in that zone are eliminated from the final selection. Additional elimination set-points include; the channel must not provide a net positive reactivity to the reactor, the CPPF of the surrounding √10 channels after the prediction equation is applied must not exceed 1.10, and the refueled channel must not push a LZC beyond its limits.
Once the total adjusted required reactivity exceeds the original total required reactivity, the selection process is complete and the core is allowed to decay for 1 FPD. The results are then tested against the maximum allowed safety constraints for the reactor. If all criteria are met, the selection process continues. If one of the restraints is breached, the program steps back a FPD. The previously selected channels for that day are eliminated from re-selection and new channels are selected for that day to try and create a successful day of simulations.
5.6
Simulating for 100 Days
CANFUEL simulated a total of 100 days, over three months worth of reactor operations. While not optimized, the simulation provides a reasonable fuel selection for each day while maintaining the reactor within operational standards as required for a CANDU reactor. The channel and bundle powers were kept under the maximum values, with the largest values for both occurring on day 0, which was the random distribution snapshot. The maximum channel and bundle power for each day, as well as the burnup, refueling rate, and average zone level data are shown in Figure 5.4-5.5 and Table 5.2.
During the first few days of refueling, the program selected and refueled well above the average number of refueling channels. The reason for this is to compensate for the relatively high
average exit burnup of the channels in the core. The average of the average exit burnup for each channel is 4675 and 3721 MWd/t for burn zones one and two respectively. A diagram showing the burnzones is found in Annex 1. The minimum average exit burnup is 3680 and 3677 MWd/t. The average of the average exit burnup corresponds to roughly 70% of the average exit burnup of the TAV case. Subsequently, the program is forced to refuel an average of 10 channels per day during the first few days before it maintains an average refuel rate of 2.54 channels per day, which is much closer to the 2.27 channels per day given in the TA case.
The average zone level during the first 20 days drops to maintain criticality in the core due to the relatively high burnup of the core. After day 20, the average of the zone levels moves towards 0.50 which is to be expected for a reactor in a nominal operating state. Due to the high number of channels being refueled during the first 10 days of operations, 100 eligible channels were required in order to achieve the refueling rate.
While the maximum channel and bundle powers are close to the simulation limits, the average of the maximums for both are 7125 kW and 891 kW respectively. Although it may appear as though there is a pattern with the fluctuations of maximum channel and bundle powers, there is no such pattern. The position of each maximum point is at a different location for each day.
The power could be reduced if the program was optimized and acceptable limits were reset to below the simulation limits. Optimization would include weighting the average exit burnup at a much higher tally weight. This would emphasize channels with high burnup and would add significantly more reactivity to the core per refueling. With this in mind, fewer channels per day would need to be selected to reach the reactivity requirements of that day and higher exit burnups would be achieved throughout the program.
The maximum CPPF of the core is reasonable at 1.07. The average zone level for each day stays around 0.50, which indicates that the number of refuelings adequately introduces enough reactivity into the core without significant compensation from the LZCs.
Channel selection weighs each of the criteria evenly which is not optimized. This leads to a selection of some fuel channels that have a relatively low average exit burnup when compared to the TA state. This also leads to more refueling operations required to compensate for the reactivity because the reactivity insertion due to a higher burnup channel being refueled is larger
than one which has a relatively low average exit burnup as shown in Figure 4.1. For future versions of this code, the average exit burnup of the channel should hold a much higher weighting value during fuel selection.
Table 5.2. Simulation results compared to the TA reference.
Time-Average Simulation
Maximum channel power (kW) 7244 7296
Maximum bundle power (kW) 905 926
Rippled channel power over TA channel power
1.00 1.07
Average Zone Level 0.500 0.482
Refueling Rate (channels per day) 2.27 4.08
Exit Burnup in Zone 1 (MWd/t) 6700 5565
Figure 5.4 Maximum channel power results.
Figure 5.5 Maximum bundle power results.
0 10 20 30 40 50 60 70 80 90 100 6900 6950 7000 7050 7100 7150 7200 7250 7300
Maximum Channel Power [kW]
Full Power Day
C h a n n e l P o w e r [k W ] 0 10 20 30 40 50 60 70 80 90 100 860 870 880 890 900 910 920 930 940
Maximum Bundle Power [kW]
Full Power Day
B u n d le P o w e r [k W ]
Figure 5.6 Maximum, minimum and average zone levels. 0 10 20 30 40 50 60 70 80 90 100 0 0.1 0.2 0.3 0.4 0.5 0.6 0.7 0.8 0.9 1
Zone Level Data
Full Power Day
Z o n e L e v e ls
Chapter 6. REACTIVITY INDUCED ACCIDENT
It is important to determine the response of a reactivity insertion event within the core with a comparison to the nominal case. This event may be brought about by a number of events that are not relevant to this study. For the purposes of this paper, the accident will be simulated at hot full power (HFP) with the rod removal simulated using linear reactivity insertion up to the rod worth over a time-span of 0.1 seconds. The event will be tested in two situations. A critical random snapshot of a typical CANDU core for reference and a critical random snapshot of thorium enriched core.
For the case presented in this Section, the assumption that the rod is removed in 0.1 seconds is to simplify the case into a reactivity insertion exercise. It is important to determine the response in comparison to the nominal CANDU reactor in order to determine the feasibility of the new fuel choice.
6.1 Rod 11 Removal
To evaluate the core response to a rod 11 removal occurring within 0.1 seconds, a full core simulation using DONJON and TRIVAC was required. A 0.1 second removal time was chosen to limit the time effects of reactivity insertion and eliminate that variable from the analysis.
The process for creating the required starting point is described in Chapter 3. . From this point a random distribution of the TA core was set at an operating power of 2.061 MW. Zone levels are set to 50% full and the control rods are fully inserted into the core. Control rods are inserted vertically from the top of the core throughout the reactor. Rod 11 is located at the center of the core as shown in Figure 6.1.
Figure 6.1 Adjuster Rod 11 Position in the Reactor
The initial kinetics parameters are obtained using the INIKIN: module of the TRIVAC computer code. The initial precursor concentrations are obtained as:
where is times the delayed macroscopic fission cross section in energy group for precursor group , for each fissile isotope. The lambdas are given for eight groups in Table 6.1.
Table 6.1. Lambda Values.
Group Lambda (s-1) 1 1.24666998E-02 2 2.82917004E-02 3 4.25244011E-02 4 1.33041993E-01 5 2.92467207E-01 6 6.66487694E-01 7 1.63478100E+00 8 3.55460000E+00
The rod removal started from the initial steady state conditions and was removed over a period of 0.1 seconds. The reactivity insertion due to the removal of rod 11 is 1.24 mk. The sufficiently small time increment allows a linear addition of reactivity into the core as opposed to the typical S-curve reactivity insertion due to rod removal. The KINSOL: module is then utilized to solve the space-time neutron kinetics equations at each step of the transient up to 3 seconds after the accident occurred. The Crank Nicholson temporal scheme was used to obtain the space-time kinetics solutions with a space-time step of 0.05 seconds. 0.05 seconds was chosen to adequately model the reactor power change.
The total reactor power of each simulation is provided in a case where there is no intervention through RRS and the activation of SDS1 or SDS2. The reactor power evolution for
each event is shown in Figure 6.2. The simulation starts with a prompt neutron jump, rapidly increasing the total reactor power. After roughly, 0.6 seconds, the prompt jump is over and the power increases at a smaller rate along the asymptotic period of of the inhour equation. Any fluctuations shown in Figure 6.2 are artifacts caused by the use of the Crank Nicholson finite difference temporal scheme. The power increase for both scenarios is very similar and no significant differences are shown throughout the evolution of the event.
The reactor flux is affected by the rod removal. Specific changes are detailed in Figure 6.3. The channel power increase is more significantly affected by the removal compared in the regions where the rod was. With the reactivity insertion in this area, it should be expected that the flux would increase to reflect that.
The evolution of the reactivity insertion event, while simplified, is a good indicator that the addition of thorium into the reactor has no significant impact on power evolution compared to the CANDU nominal case. Power increases and flux changes in the core show no unexpected variations and are very similar to that of the CANDU nominal case.
Figure 6.2 Reactor power after a rod removal event.
Figure 6.3 Relative % Group 2 Neutron Flux Difference 0.1s After Rod Removal.
0 0.5 1 1.5 2 2.5 3 3.5 2.05 2.1 2.15 2.2 2.25 2.3 2.35 2.4 2.45x 10 6 Reactor Power Time [s] P o w e r [W ]
Thorium enriched fuel Natural uranium 5 10 15 20 A E L P W
Relative % Group 2 Neutron Flux Difference 0.1[s] After Rod Removal
-2 -1 0 1 2 3 4 5
CONCLUSION
A study into the effects of adding thorium into the CANDU core has been explored in this document. Guided by some background in reactor physics, the process of selection, data generation, and simulating refueling procedures has been documented, analyzed, and in some cases, validated. For further study, a simple reactivity insertion event was provided to compare to the nominal CANDU core and the results were discussed.
After introducing the concepts and equations used to model and study nuclear reactor physics, models were set up using the computer codes DRAGON, DONJON, and SERPENT. With these codes, the 2-dimensional lattice cell of a CANDU fuel bundle was created and studied with the inclusion of thorium into the fuel. Reactivity devices were then modeled in a 3-dimensional case in order to find the incremental cross-sections of the devices for the fuel composition within the lattice. These results were used to model the CANDU core in both Time-Average and Instantaneous simulations. 2-dimensional lattice calculations were then validated using Monte-Carlo calculations performed in SERPENT. This data was essential for selecting a fuel composition.
With the constraints determined, several objectives for the new fuel were selected to choose an operational fuel. Such objectives included the quantity of thorium included in the fuel, burnup, reactivity insertion, bundle refueling patterns, isotopic contents, and delayed neutron fraction compared to natural uranium. Finally, a 1% enrichment of thorium in the fuel was decided upon.
With the device and fuel data generated, an automated refueling program was executed to determine the feasibility of the fuel selection. By setting dynamic constraints on the instantaneous snap-shot of the reactor, fuel channels were selected to keep the reactor operating within safety and reactivity objectives. The process involved selecting channels based on the elimination of ineligible channels and selection refinement to determine a small set of ideal candidates. Once the reactivity requirements for the day were satisfied, the core was allowed to decay for a period of one full power day. The new snap-shot was then analyzed to determine the success of the previous channel selection(s), and to determine new selection(s) for the day.
The simulated a period of 100 days of continuous operations. Maximum channel and bundle powers were 7296 kW and 926 kW respectively and were very close to the Time-Average