HAL Id: hal-00905981
https://hal.inria.fr/hal-00905981
Submitted on 19 Dec 2013HAL is a multi-disciplinary open access
archive for the deposit and dissemination of sci-entific research documents, whether they are pub-lished or not. The documents may come from teaching and research institutions in France or abroad, or from public or private research centers.
L’archive ouverte pluridisciplinaire HAL, est destinée au dépôt et à la diffusion de documents scientifiques de niveau recherche, publiés ou non, émanant des établissements d’enseignement et de recherche français ou étrangers, des laboratoires publics ou privés.
Assessing the Ability of a VR-based Assembly Task
Simulation to Evaluate Physical Risk Factors
Charles Pontonnier, Afshin Samani, Marwan Badawi, Pascal Madeleine,
Georges Dumont
To cite this version:
Charles Pontonnier, Afshin Samani, Marwan Badawi, Pascal Madeleine, Georges Dumont. Assessing the Ability of a VR-based Assembly Task Simulation to Evaluate Physical Risk Factors. IEEE Trans-actions on Visualization and Computer Graphics, Institute of Electrical and Electronics Engineers, 2013, �10.1109/TVCG.2013.252�. �hal-00905981�
Assessing the Ability of a VR-based Assembly Task Simulation to
Evaluate Physical Risk Factors
Published in IEEE Transactions on Visualization and Computer Graphics (2013), Author Version
Charles Pontonnier, Afshin Samani, Marwan Badawi, Pascal Madeleine and Georges Dumont
Abstract—Nowadays the process of workstation design tends to include assessment steps in
a Virtual Environment (VE) to evaluate the ergonomic features. These approaches are cost-effective and convenient since working directly on the Digital Mock-Up in a VE is preferable to constructing a real physical mock-up in a Real Environment (RE). This study aimed at understanding the ability of a VR-based assembly tasks simulator to evaluate physical risk factors in ergonomics. Sixteen subjects performed simplified assembly tasks in RE and VE. Motion of the upper body and five muscle electromyographic activities were recorded to compute normalized and averaged objective indicators of discomfort, that is, Rapid Upper Limb Assessment score, Averaged Muscle Activations, and Total Task Time. Rated Perceived Exertion (RPE) and a questionnaire were used as subjective indicators of discomfort. The timing regime and complexity of the assembly tasks were investigated as within-subject factors. The results revealed significant differences between measured indicators in RE and VE. While objective measures indicated lower activity and exposure in VE, the subjects experienced more discomfort than in RE. Fairly good correlation levels were found between RE and VE for six of the objective indicators. This study clearly demonstrates that ergonomic studies of assembly tasks using VR are still challenging. Indeed, objective and subjective measurements of discomfort that are usually used in ergonomics to minimize the risks of Work-Related Musculoskeletal Disorders development exhibit opposite trends in RE and VE. Nevertheless, the high level of correlation found during this study indicates that the VR-based simulator can be used for such assessments.
Index Terms—Fidelity, Ergonomics, Motion Capture, EMG, Assembly Task, User Study
• Charles Pontonnier is with Ecoles Militaires de Saint-Cyr Coëtquidan/IRISA/INRIA, Campus Universitaire de Beaulieu, 263 Avenue du General Leclerc - Bat 12, Rennes Cedex 35042, France. E-mail: [email protected]
• Afshin Samani and Pascal Madeleine are with Laboratory for Ergonomics and Work-related Disorders, Center for Sensory-Motor Interaction (SMI), Department of Health Science and Technology, Aalborg University, Fredrik Bajers Vej 7 D-3, 9220 Aalborg East, Denmark. E-mail: {afsamani,pm}@hst.aau.dk
• Marwan Badawi is with INRIA/IRISA Rennes, Campus Universitaire de Beaulieu, 263 Avenue du General Leclerc - Bat 12, Rennes Cedex 35042, France. E-mail: [email protected]
• Georges Dumont is with ENS Cachan Antenne de Bretagne/ IRISA/INRIA, Campus Universitaire de Beaulieu, 263 Avenue du General Leclerc - Bat 12, Rennes Cedex 35042, France. E-mail: [email protected]
1 INTRODUCTION
The design of workstations nowadays tends to include assessment steps in a Virtual Environment (VE) to evaluate ergonomic features. This approach is more cost-effective and convenient since working directly on the Digital Mock-Up (DMU) in a VE is preferable to constructing a real physical mock-up in a Real Environment (RE). This is substantiated by the fact that a Virtual Reality (VR) set-up can be easily modified, enabling quick adjustments of the workstation design. Indeed, the aim of integrating ergonomics evaluation tools in VE is to facilitate the design process, enhance the design efficiency, and reduce the costs. VR has already been used in ergonomics to assess aspects of manual handling operations [14], [42]– [44]. In such applications, the user is immersed in a VR-based simulator that mimics the real working environment and he or she is asked to perform tasks through interactions in VE corresponding to tasks performed in RE. Interactions are mostly performed with peripherals such as motion-tracking systems or haptic interfaces. In most cases [19], [24] the observed data consist of kinematics data, enabling the computation of metrics related to physical risk factors such as the RULA (Rapid Upper Limb Assessment) score [20].
The importance of assessing physical risk factors is closely related to their primary role in the development of Work-Related Musculoskeletal Disorders (WMSDs) in RE [4], [9]. However, there is a lack of knowledge concerning the interplay between VE and RE in terms of physical risk factors. Furthermore, the use of VE for ergonomic purposes raises two crucial questions: how reliable are the recommendations issued from a VR-based ergonomics study? And how realistic is the simulator? In other words, it raises the question of the fidelity of the simulator. Fidelity can be defined as the objective degree of exactness with which real-world experiences and effects are reproduced by a computing system [11]. It has to be distinguished from the definition of presence [36]. Presence falls within the idea that stimuli and interactions proposed to the user provide an illusory subjective experience. Fidelity can further be expressed in terms of interaction fidelity, simulation fidelity, and display fidelity [21]. This is in agreement with the functional goals pursued by simulation in VE in, for example, ergonomics. As stated in [37], the assumption that subjective experience metrics are sufficient to define the fidelity of a VE can be questioned. Namely, high scores in subjective metrics can be caused by irrelevant aspects of the simulation that are detrimental to the fidelity.
In many application domains, like ergonomics, it seems mandatory to use metrics based on measurements of biomechanical performance as well as presence questionnaires or subjective ratings to define the usability of the simulator. Indeed, a high level of system fidelity should be achieved, to ensure a thorough full design in VE. The main issue remains in defining the system fidelity, especially the interaction fidelity, which will differ from one application to another. Flight simulators, for example, present a fake dashboard to the user that can be considered as providing a very high level of interaction fidelity. In ergonomics, such ad-hoc interfaces are not usable, as designers and industrials tend to minimize the cost of the simulator in virtualizing most of the workstation features. Moreover, researchers tend to define several types of interactions from a generic device, such as a joystick or a haptic arm. Furthermore, the interaction fidelity is guaranteed in ergonomic studies if the worker’s gestures in VE are comparable to movement in RE. Thus, it seems crucial to find objective metrics that enable comparisons between real and virtual situations. At the same time, the feeling of presence has to remain high to keep the subject focused and engaged in the task realization [31].
The current study focuses on designing and conducting an experiment on simulated assembly tasks performed in RE and VE with the ultimate aim of comparing indicators of discomfort. The analysis of these indicators gives useful insights on the system fidelity, and the comparison between the two environments furnishes novel information on the use of VR-based simulators in ergonomics.
2 RELATED WORK
System fidelity and presence level are two crucial points of evaluation for numerous applications involving VR-based simulation.
For example, VR-based simulators have been widely compared with real protocols in exposure therapy [8], [33], showing impressive results, with efficiency at least as high as that of standard methods. Comparisons were also performed with collaborative applications [35], interpersonal interactions applications [30], and presence evaluation applications [40]. In all of these fields, VR-based simulators were evaluated and validated as valuable and faithful tools, notably in describing the performance of the user and comparing it with the performance obtained from a real protocol.
VR-based simulators including physical simulation of contacts have also been evaluated, especially in the field of virtual surgery simulators. The system fidelity is crucial as surgeons have to acquire highly accurate skills that are transferable to the real world from these simulators. For example, [1] showed that novice surgeons learned laparoscopic procedures with an initial VR-based simulation cycle of training faster than they did with a standard learning process. [41] also insisted on the positive influence of VR-based simulations including haptics in the acquisition of psychomotor skills for endoscopic interventions. Indeed, the use of such VR-based simulation is already widely validated and disseminated in the field of surgery.
Nevertheless, there is a lack of studies dealing with the functional assessment of VR-based simulators designed for ergonomic purposes. In [43], the authors proposed comparisons between box-lifting motions in RE and VE, assessing the influence of the environment on the lumbar motion. The authors concluded that the range of motions was similar, unlike the range of velocities and accelerations. The main limitation was due to a technical lag between the HMD display and the recorded motion, which drastically slowed the performance in VE and most likely explained the discrepancies in velocities and accelerations. In [13] the authors analyzed drilling tasks performed in RE and VE. They gathered data for 30 subjects and compared three objective and two subjective indicators. Hu et al. [13] concluded that for four of these indicators, the results were significantly different in RE and VE, even though fairly good correlations between RE and VE metrics existed for two of the indicators. The main drawback identified here was the level of presence reported by the user, which was ”acceptable” on the scale defined in [45].
These previous results demonstrate the importance of a thorough evaluation to ensure that design conclusions based on simulators are reliable. Especially, system fidelity has to be evaluated to warrant the conformity of the tasks realized in the VE with regard to the ones realized in RE. Moreover, the feeling of presence is guaranteed to ensure that the user
3 MATERIALS AND METHODS
In the present study, the authors designed and conducted experiments on simulated assembly tasks in RE and VE, comparing several indicators of discomfort. Especially, the authors aimed at comparing objective and subjective indicators in order to highlight motor control changes in condition due to immersion in a VE, as well as exploring the potential reliability of ergonomic conclusions based on a VR-based simulation. The VR system used here was a high-resolution stereoscopic immersion room including a front-screen and a floor-screen. The interaction was performed with a Flystick2 (ART™1). The motion of the upper body and muscle activity from five muscles along the kinematical chain were recorded to compute normalized and averaged objective indicators (RULA score, Averaged Muscle Activations (AMA), and Total Task Time (TTT)). Rated Perceived Exertion (RPE), using Borg’s CR-10 scale [5], and a modified questionnaire including items from Witmer-Singer’s one [45] were used to assess subjective indicators.
3.1 Subjects
Sixteen male subjects participated in this study after giving their informed consent. They were all novices in Virtual Reality (average experience of 1.4 ± 0.5 on a five-point scale). Mean subject age was 26.5±2.8 yrs, mean height was 178.4±6.5 cm, and mean weight was 70.2±9.2 kg. All subjects but three were right handed, and none of them reported any musculoskeletal disorder within the last six months.
3.2 Task
The chosen task was a simplified assembly task, including several elementary operations and conditions that can be found in a real industrial process: target reaching, object manipulation, piece sorting, standing posture, and repetitive motion. These specific features are well-known to be involved in the appearance of WMSDs [9]. The task was performed in three environments: RE, VE, and VE with force feedback (VEF). VEF was proposed to the subjects in an additional session. The task was somewhat different from the other ones, as haptic device articular limitations required several additional manipulations during the task. Finally, six subjects did not participate in the VEF session due to a technical issue (involving the axis board of the haptic device). Since including the force feedback trials makes a very unbalanced data set, we decided to discard this part. Moreover, a preliminary statistical analysis showed no significant influence of this issue on the current results (the results were not influenced by whether or not the subjects performed the VEF test).
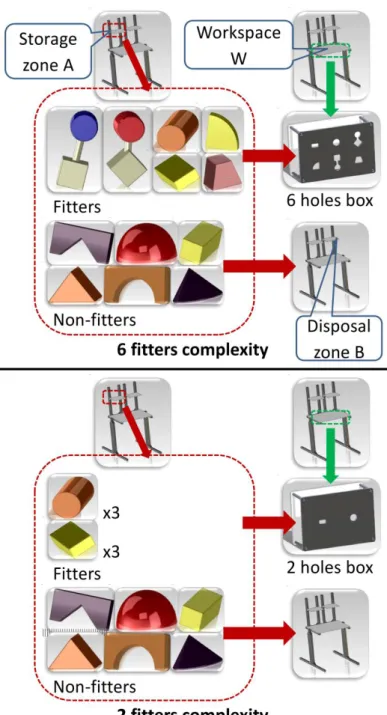
An overview of the experimental setup is shown in Figure 1. The RE consisted of a workspace including a storage and a disposal zone, a holed box, and twelve wooden objects (see Figure 2). The holed box was located on a work surface set at elbow height (recommended for light work [34]) and the storage and disposal zones were located 40 cm above the table surface and 16 cm to the left and right of the center of the holed box, respectively. The holed box had several holes with different cross-sectional contours which could accept some of the objects (”fitters”), while the other objects (”non-fitters”) could not pass through any of the holes.
During the study, the subject stood in front of the table and, after receiving a verbal start signal, grabbed an object from the storage zone with his right hand. The subject had to pass fitters through the appropriate holes in the holed box while non-fitters were placed in the disposal zone. There were six fitters and six non-fitters in each trial. Each piece weighed about 40 grams. The session’s duration was about 15 minutes (half in RE, half in VE).
Fig. 1. Experimentation overview: simplified assembly task performed in real and virtual environments.
Different within-subject factors were investigated in order to understand the influence of the VE on performance. They are described in Table 1. Two cases of complexity of the task were proposed: a case with only two types of fitters (cylinder and parallelepiped) and a case with six types of fitters (see figure 2). The timing regime factor also had two levels: ”as fast as possible”, where the subject did not take any breaks between pieces, and ”time-constrained”, where the subject waited for a sound signal before taking a new piece, which occurred every ten seconds. For each environment, the complexity and timing regime were randomly ordered to prevent cross-over effects. The different environments were randomly balanced to prevent task-learning effects.
The VE was designed to precisely mimic the RE. An overview of the numerical pipeline can be found in [29]. The 3D representations of the workstation and of the holed box were derived from the DMUs used to fabricate the real environment. The virtual table height was also visually adjusted with respect to the subject’s elbow height.
The virtual system used a high resolution stereoscopic immersion room including a wall and a floor (vertical wall: 9.6m×3.1m, 6240×2016 pixels, eight Barco NW12 projectors, BARCO Inc., USA ; floor: 9.6m×2.88m, 3500×1050 pixels, three Barco Galaxy 7 projectors, BARCO Inc., USA). Three dimensional glasses (ActiveEyes-Pro, Volfoni, SAS, France) tracked with a 360 ˚ tracking system equipped with 16 ART infra-red cameras (Advanced Real Time Tracking GmbH, Germany) were used to adapt the simulation to the user point-of-view. Only one object appeared on the storage shelf at a time and the subject had to grab the object using a wireless interaction device (Flystick2, Advanced Real time Tracking GmbH, Germany) co-localized with the VE. The target was set 5 cm above the center of the Flystick in order to be seen by the user. It was a relative offset, where a 90 ˚ roll of the hand would keep the object 5 cm above the hand but rotated 90 ˚. In other words, the position of the object relative to the flystick was not affected by the motion of the user. In the ”as fast as possible” trials, a new object appeared on the storage shelf once the user had finished with the previous one. In the ”time-constrained” trials, the object appeared concomitantly with the auditory start signal.
The distributed middleware architecture of the application was based on the framework described in [10]. The physics of the scene was simulated using the Bullet Physics Library2. Simplified forms of non-convex pieces and holes were designed for the physics simulation in order to facilitate their manipulation, as the Bullet Physics Library does not handle non-convex meshes properly.
Fig. 2. on Top: six holes complexity task description. On Bottom: two holes complexity task description In both cases, twelve pieces were involved, six ”fitters” to place in the holed box and six ”non-fitters” to place in the disposal zone.
The virtual coordinates of the flystick were linked to the physical ones by the mean of a standard proportional derivative control scheme for positions and a suboptimal control scheme with a quadratic cost for rotations, as described in [32]. Performance levels were set at
a relatively low level in order to minimize undesirable collision effects (jumps, vibration, instability,...) on the virtual object. This was necessary as the subject had only visual information to check the position of the object.
Factors Levels Description
Complexity 2 fitters See Figure 2
6 fitters See Figure 2
Timing regime As fast as possible One piece after one
Time-constrained One piece per 10s
Interaction type Real Real task
Virtual Virtual task
Table 1. Within-subject factors.
Even though particular attention was paid to precisely mimicking the real task, several obvious differences existed between RE and VE: grabbing pieces consisted in clicking a trigger in VE, and no haptic feedback indicated collisions with the environment in VE to the user. Indeed, such differences in motor components cannot be afforded, and the current study aimed to evaluate whether or not they influence the results of an ergonomic study.
3.3 Recordings
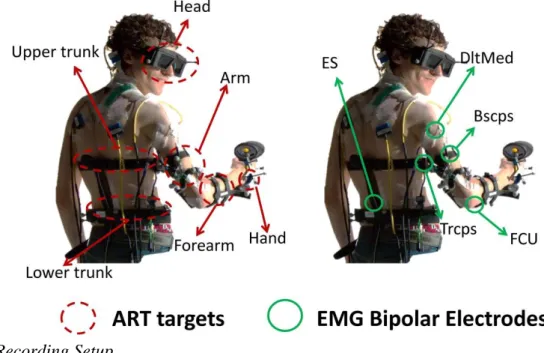
Orientations of the trunk and the upper limb segments were tracked using six dedicated AR-tracking targets, sampled at a 60 Hz frame rate: lower trunk, upper trunk, head (glasses), right arm, forearm, and hand. Targets were placed approximately on each body segment, as only segments’ orientations relative to the room coordinates were tracked. The timing of tasks was also recorded.
Fig. 3. Recording Setup.
Figure 3 gives an overview of the recording setup. Muscle activities were recorded along the kinematical chain. Five bipolar channels were used to collect electromyographic (EMG) signals from the Erector Spinae (ES, back extensor), Deltoideus Medialis (DltMed, shoulder abductor), Biceps Brachii (Bscps, forearm supinator and elbow flexor), Triceps Long Head (Trcps, elbow extensor and shoulder stabilizer), and Flexor carpi ulnaris (FCU, wrist flexor and adductor) with bipolar surface electrodes (Neuroline 720, Ambu, Denmark). Bipolar
surface electrodes were aligned (inter-electrodes distance: 2 cm) on abraded ethanol-cleaned skin along the direction of the muscle fibers. Bipolar electrodes were placed with respect to anatomical landmarks. The EMG signals were amplified 2000 times (64-channel surface EMG amplifier, SEA64EMG-USB, LISiN-OT Bioelectronica, Torino, Italy), band-pass filtered [5-500 Hz], and sampled at 2048 Hz (National Instrument, 12 bits acquisition board, Austin, USA). A reference electrode was placed at C7.
After each trial, subjects were invited to report their Rated Perceived Exertion (RPE), based on the Borg CR-10 scale [5] and indicating the perceived level of discomfort (0 – no discomfort, 10 - highly uncomfortable). At the end of the experimentation, subjects answered a short questionnaire. On a five-point scale, they compared the RE and the VE in terms of task difficulty (Was the type of pieces easy to recognize? Was the assembly task easy to perform?), motion restriction, vision alteration, stress, and fatigue. They also rated the VE on a five-point scale: display fidelity and interaction fidelity.
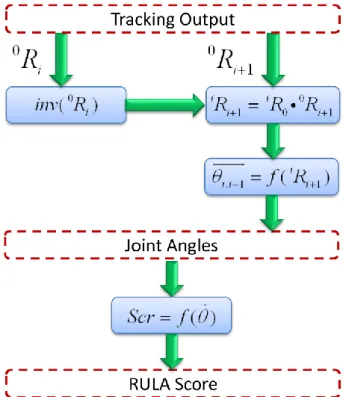
Fig. 4. RULA score computation. iRi1 is the rotation matrix of segment i+1 relative to segment i and i i, 1 is the vector containing functional joint angles of the joint between i and
i+1. 0R matrix is the output of the ART, representing the rotation of the segment i relative to i the reference frame 0.
They were also free to write any comment they had on the experimentation. Additional questions about sensory-feedback and accessibility were included for each interaction type (the results are not discussed in this study, as they were used for an initial evaluation). Table 3 gives an overview of the questions.
3.4 Indicators
The RULA score is an indicator of postural discomfort [20] used in relation to assessment of physical risk factors. The RULA score represents a good indicator of discomfort. A minimal score of 1 indicates a relatively comfortable posture, whereas a maximal score of 7 indicates a highly uncomfortable posture. From kinematics outputs, a processing pipeline described in Figure 4 computed the RULA score at each frame. This requires that joints angles be obtained from the rotation matrix via a standard inverse kinematics algorithm [26]–[28]. As tracking outputs consisted of both positions and orientations of each segment, the method computed the relative rotation matrix between each body segment. A simple identification of the joint coordinates was performed from these matrices. Finally, successive intermediate RULA scores were computed and gathered. To obtain the RULA Grand Score, ”frequency adjustment” was set to 1 since trials included repetitive motions. Given that both the wooden objects and the flystick weigh less than 1 kg, the ”force adjustment” was set to 0. For each trial, the RULA score was averaged.
3.4.2 Averaged Muscle Activations (AMA)
Averaged Muscle Activations (AMAs) are simply an averaged measure of the activity for a considered muscle. AMAs give a fairly good overview of the muscle load during the task and are used to compare similar tasks under different conditions [6]. To compute this indicator, EMG signals were rectified and low pass filtered (8 Hz) using the envelope as final value in agreement with [25]. EMG activation profiles were normalized with activation levels obtained from a reference task, to get comparable results across subjects. Each subject was asked to bend the trunk by approximately 20 ˚ and to extend the arms in a T-pose (90 ˚ shoulder abduction) for 10 seconds to obtain the reference levels. Finally, EMG activations were averaged across time for each trial to obtain AMAs.
3.4.3 Total Task Time (TTT)
For the ”as fast as possible” condition, the elapsed time between the beginning and end of the task was recorded as TTT, as task duration affects the fatigue and discomfort of subjects and vice versa.
3.4.4 Subjective indicators
RPE was directly used as a discomfort indicator for each trial. Comparisons obtained from the questionnaire were used as global indicators for comparing RE and VE, ignoring complexity and timing-regime conditions.
3.5 Statistics
Interaction type (IT, set to either ”real” or ”virtual”), timing regime (TR, set to either ”as fast as possible” or ”time-constrained”) and Complexity (Co, set to either ”two holes” or ”six holes”) were introduced as factors in a full-factorial repeated measure analysis of variance (ANOVA) of the dependent variables, which are the objective and subjective indicators (RULA score, AMAs, and RPE score). A specific ANOVA was calculated for TTT, including only the interaction type and the complexity (as ”time-constrained” trials were all of the same duration). The level of confidence was set to p < 0.05. Only significant results were investigated as the normality test was not passed for all the indicators (e.g. RPE). The normality of the results was qualitatively evaluated in plotting the cumulative distribution of each factor. A post-hoc analysis supporting non-normal data (Tukey’s HSD) highlighted the
significant differences for objective and subjective indicators in RE and VE. The level of confidence was set to p < 0.05. Correlations between indicators obtained from RE and VE trials were investigated using a linear regression method and Pearson’s or Spearman’s correlation methods, depending on the normality of the data. The correlation coefficient ρ was computed for each indicator with a level of confidence set to p < 0.05. Sample sign tests were performed to determine differences between RE and VE for questionnaire results.
4 RESULTS
4.1 ANOVA results
Table 2 shows the results of the full factorial repeated measures ANOVA. For all the indicators except Trcps AMA, a statistically significant influence of the interaction type (IT) was found. For all objective indicators, an influence of the timing regime (TR) was found, whereas Complexity (Co) had only an influence on FCU AMA and RPE scores. Interactions also had an influence on several indicators. ”IT×TR” influenced all the objective indicators, ”IT×Co” influenced RPE, and ”TR×Co” influenced ES AMA. IT and Co also had an influence on TTT.
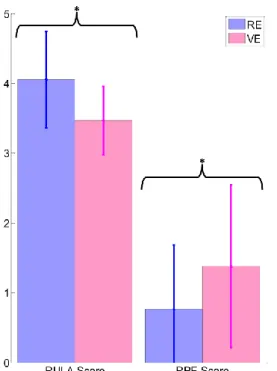
Fig. 5. Average RULA score and RPE scores in RE and VE. The star (*) indicates a significant difference between means.
4.2 Post-hoc tests
Post-hoc tests (Tukey’s HSD) were applied to significant ANOVA results to further investigate their significance.
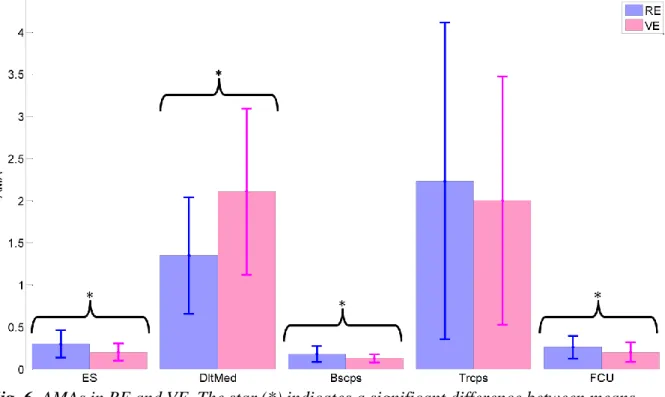
Figure 4 shows the mean RULA and RPE scores in RE and VE. The mean RULA score was higher in RE (4.1 ± 0.7) than in VE (3.5 ± 0.5). The mean RPE score was lower in RE than in VE ((0.77 ± 0.92) vs (1.38±1.17)). Average Muscle Activations (AMAs) in RE and VE are shown in Figure 6. For three of the recorded activations, the AMAs were higher in VE than in RE (Erector Spinae (ES): (0.30 ± 0.11) vs (0.20 ± 0.09), Biceps Brachii (Bscps): (0.18±0.05)
vs (0.13±0.05) and Flexor Carpi Ulnaris (FCU): (0.27 ± 0.13) vs (0.20 ± 0.12)). For Deltoideus Medialis (DltMed), the average activation was lower in RE (1.4±0.5) than in VE (2.1±1.0). Factors Interaction type IT Timing regime (TR) Complexity (Co) IT x TR IT x Co TR x Co Dependent Variables F p F p F p F p F p F p RULA score 34.8 <0.001 109.7 <0.001 NS 10.4 0.006 NS NS ES AMA 53.7 <0.001 89.5 <0.001 NS 51.0 <0.001 NS 4.7 0.047 DltMed AMA 31.7 <0.001 152 <0.001 NS 6.1 0.027 NS NS Bscps AMA 38.3 <0.001 60.9 <0.001 NS 44.7 <0.001 NS NS Trcps AMA NS 43.9 <0.001 NS 17.7 <0.001 NS NS FCU AMA 7.6 0.015 42.6 <0.001 9.2 0.008 8.8 0.009 NS NS RPE 10.0 0.007 NS 5.4 0.035 NS 12.1 0.003 NS TTT 19.5 <0.001 NA 15.1 0.002 NA NS NA
Table 2. Full factorial repeated measures ANOVA results. NS indicates non-significant results. NA indicates non-applicable analysis.
Total task Time (TTT) was significantly higher in VE than in RE for ”as fast as possible” trials (49.6±8.0 s vs 36.5±4.4 s).
Fig. 6. AMAs in RE and VE. The star (*) indicates a significant difference between means. Tests revealed that RULA score was higher in the ”as fast as possible” condition than in the ”time-constrained” condition (4.2 ± 0.4 vs 3.3 ± 0.3) as were the AMAs of Erector Spinae (ES) (0.34 ± 0.13 vs 0.17 ± 0.07), Deltoideus Medialis (DltMed) (2.1 ± 0.8 vs 1.3 ± 0.7), Biceps Brachii (Bscps) (0.19 ± 0.08 vs 0.12 ± 0.04), Triceps (2.8±1.8 vs 1.5±1.1) and Flexor Carpi Ulnaris (FCU) (0.28±0.13 vs 0.18±0.09). For FCU, the average activation was higher in
the ”two holes” complexity condition than in the ”six holes” one (0.24 ± 0.11 vs 0.22 ± 0.10). On the contrary, Rated Perceived Exertion (RPE) was lower in the ”two holes” complexity condition than in the ”six holes” one (0.94±0.71 vs 1.21±0.86). Finally, cycle time was lower in the ”two holes” complexity condition than in the ”six holes” one (37.7 ± 3.4 s vs 48.3±7.6 s).
Interactions also influenced the results. For RULA score, the difference between RE and VE trials was less important under the ”time-constrained” condition than under the ”as fast as possible” condition, as were the AMAs of ES, Bscps, Trcps, and FCU. In contrast, the difference between RE and VE trials was more important in this case for DltMed AMA. In VE, the results indicated a significant increase in the RPE for the ”six holes” trials, whereas in RE the difference between the ”two holes” and ”six holes” trials was less important. Under the ”two holes” condition, ES AMA was less important in ”as fast as possible” trials than in ”time-constrained” trials, whereas the inverse behavior was observed under the ”six holes” condition.
Fig. 7. Linear regression applied to AMAs and RULA score recorded in RE and VE.
4.3 Correlation results
Figure 7 shows the linear regression results between objective indicators of discomfort measured in RE and VE. Fairly good correlations were found for RULA score (ρ = 0.76, p < 0.05), as well as for all of the average activations. ES AMA (ρ = 0.87, p < 0.05), DltMed AMA (ρ = 0.76, p < 0.05), Bscps AMA (ρ = 0.91, p < 0.05), Trcps AMA (ρ = 0.79, p < 0.05), and FCU AMA (ρ = 0.68, p < 0.05) levels obtained in RE and VE are highly correlated under the same task conditions. However, no significant correlation was observed between RPE scores obtained in RE and VE (ρ = 0.23, p=0.15) or between TTT obtained in RE and VE (ρ =0.3, p = 0.1).
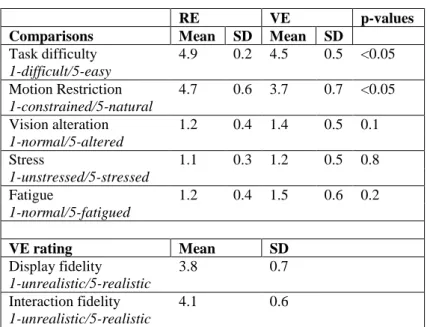
Table 3 reports the results of the questionnaire. Sample sign tests revealed that: • the task was perceived as significantly more difficult to achieve in VE than in RE ; • the motion was perceived as significantly more constrained in VE than in RE; • the vision was not perceived as significantly more altered in VE than in RE; • VE was not perceived as significantly more stressful than RE;
• VE was not perceived as significantly more tiring than RE.
The subjective rating of the VE revealed that subjects found the environment and the interaction relatively faithful to the RE (see Table 3). They mentioned (8 of the 16 subjects) in free comments that manipulation of objects was ”more complicated” in VE than in RE. They also mentioned (9 of the 16 subjects) a sensation of being there (”The 3D model is very convincing”, ”I was not sure whether I was in front of the real or the virtual workstation”, ...).
RE VE p-values
Comparisons Mean SD Mean SD
Task difficulty 4.9 0.2 4.5 0.5 <0.05 1-difficult/5-easy Motion Restriction 4.7 0.6 3.7 0.7 <0.05 1-constrained/5-natural Vision alteration 1.2 0.4 1.4 0.5 0.1 1-normal/5-altered Stress 1.1 0.3 1.2 0.5 0.8 1-unstressed/5-stressed Fatigue 1.2 0.4 1.5 0.6 0.2 1-normal/5-fatigued VE rating Mean SD Display fidelity 3.8 0.7 1-unrealistic/5-realistic Interaction fidelity 4.1 0.6 1-unrealistic/5-realistic
Table 3. Questionnaire results. Each item is evaluated on a five-point scale.
5 DISCUSSION
The present study aimed at evaluating the fidelity of a VR-based simulator in understanding how reliable biomechanical indicators are in assessing physical risk factors of a simulated assembly task performed in VE in relation to the same task performed in RE. The RULA score, five AMAs (ES, DltMed, Bscps, Trcps, and FCU), and TTT were computed as objective indicators, while RPE and questionnaire answers were used as subjective indicators. A statistical analysis was performed to understand the influence of the factors on the different indicators. Mostly, objective indicators showed that ”time-constrained” trials were more comfortable than as fast as possible ones in most cases, whereas complexity did not influence the physical load significantly.
Significant differences were found in RULA score for the different interaction types. The results indicated that VE led to more comfortable postures than RE in most cases. Our opinion is that this is mainly due to the way in which interaction was done in VE. Using a flystick instead of a hand to manipulate the objects led to a smaller range of motions – inducing more comfortable joint angles [18] – because of the 5 cm relative offset introduced to enable the subject to see the manipulated object. This is noteworthy as it is common to rely on RULA results to assess ergonomics of workstations [2], [3], [7]. As a consequence, assessing
postures in VE can easily lead to bias, resulting in erroneous estimations of risks for developing WMSDs. On the other hand, fairly good correlations between RULA scores measured in RE and VE under the same task conditions were found. This indicates that when comparing one environment with the other, the trend followed by the RULA score in the RE will be similar to that in the VE.
TR also had a significant influence on the score, as the ”time-constrained” task enabled the subject to rest while waiting for the next cycle. This confirms that the computed RULA score properly reflected the postural activity during the trial. ”IT×TR” interaction also had an influence on RULA score, as rest time was less comfortable in VE than in RE. In RE, the subject placed his arm on the real work plan, instead of letting it hang alongside the body. This resulted in a closer averaged value of the RULA score in ”time-constrained” trials than in ”as fast as possible” trials.
Significant differences were also found in AMAs for the different interaction types due to the modulation of sensory feedback, in line with [38]. Results indicated that VE led to less muscle activity in most cases, except for Deltoideus Medialis (higher muscle activity) and Triceps Long Head (no reported influence). One can assume that, as cognition was affected by the environment, motor control was also altered [37]. Indeed altered cognition induces an altered motor control to perform a task in an unfamiliar environment [22]. The reported difference was also due to the interaction device, as the co-localization between the VE and the flystick was not perfect (5 cm offset) and as the grabbing was performed via a trigger button in VE. Even if it was necessary to enhance the visualization and the manipulation of the objects, it also modified the way in which the task was performed. On the other hand, fairly good correlation levels were found for the five AMAs measured in RE and VE. This result is in line with the one reported in [13], indicating that despite the reported discrepancies between VE and RE, trends followed by the AMAs are the same in RE and VE in relation with the conditions associated with the tasks.
Co and TR also had a significant impact on muscle activity. For the five indicators, the results indicated that ”time-constrained” trials led to lower muscle activity than ”as fast as possible” trials. In a way similar to the RULA score, ”time-constrained” trials enabled the subject to rest between two objects, leading to lower muscle activity. The influence of complexity on FCU AMA was unexpected, as intuition suggests that increasing complexity will lead to increased muscle activity. The reported results indicated the contrary. One reason could be that with the increase in difficulty, movement velocity decreased when manipulating the objects, leading to lower FCU muscle activity. ”IT×TR” had an influence on all the AMAs, accentuating the difference in level between ”time-constrained” and ”as fast as possible” trials in VE in relation to RE. This indicates that AMAs recorded under the ”time-constrained” condition in VE were closer to the ones in RE in comparison with ”as fast as possible” trials. This result can be explained by the fact that resting times induced in ”time-constrained” trials tended to lower the computed AMA, increase the correlation between cycle patterns, and smooth the difference between RE and VE.
TTT was also significantly higher in VE than in RE. It is in line with the results of [13], and confirms the lack of familiarity of subjects with the VE.
The results obtained for objective indicators of discomfort have to be compared with the results reported for subjective indicators. Indeed, the reliability of subjective ratings of discomfort with regard to objective measurement such as postural rating and load capacity
rating has been widely assessed in the past. In [15], the authors proposed a review of such comparisons and showed a high correlation between RPE based on Borg’s CR-10 scale and objective indicators of discomfort. This means that a high level of subjective discomfort is generally associated with high scores in objective metrics. This consideration has to be challenged with the results of the present study. Reported RPE score was significantly higher in VE than in RE. As the RULA score and three of the five AMAs decreased significantly at the same time, the feeling of discomfort could not come from more awkward postures and is in contradiction with objective measurements. As only five muscles were monitored, the feeling of discomfort could come from an uncovered zone of the body solicited in a compensatory process. On the other hand, the increase of RPE confirms the longer TTT. These clues tend to confirm that cognition alteration tends to bias the physical risk factors evaluation in VE.
Questionnaire results also showed a significant gap between RE and VE since the task seemed more difficult and the motion more constrained in VE. The lack of force feedback and the relative compliance of the control could explain this result. The way in which the control of the virtual object was defined induced a sensible delay, and the user had only visual feedback to complete the assemblies. This is confirmed by the fact that TTT was longer in VE than in RE. On the other hand, the display fidelity and the interaction fidelity seemed reasonably high, and a sensation of presence was reported in several free comments by the users. This means that, despite differences in terms of motor control and cognition, the simulator properly rendered the simulated task from a subjective point of view.
The results of this study confirm that using VR for ergonomic evaluation of assembly tasks is still challenging, as interaction and simulation choices deeply affect sensory feedback, cognition, and motor control. In the present study, the RULA results are in contradiction with the reported RPE, in a way similar to localized fatigue development [17]. Then, such ergonomic assessments can be performed if the offset between RE and VE is defined and taken into account. For example, fairly good correlations for RULA and AMAs were found in the present study. Nevertheless, these correlations will be true for this specific task and environment.
This study has several limitations. First, the conclusions of this study are to be considered with caution when investigating other tasks, as the literature in the domain is limited. Also, indicators reported in this study give a good overview of discomfort, but a thorough analysis of joint motion and muscle activation patterns is necessary to understand differences in terms of motor control and to see how to obtain better simulation fidelity. Furthermore, RULA score was used in this first approach as it was the simplest postural tool to implement and use. In further works, a more complete postural score, such as the Rapid Entire Body Assessment (REBA) [12], could be used.
As the fitters and non-fitters were all different pieces (especially in the ”six holes” complexity condition), tracking of the fingers’ motions should have been relevant, especially showing differences during grabbing and posing sequences. However, the tracking device was not usable for this purpose. The authors will consider using a marker-less tracking device to track the fingers’ motions during the tasks.
The fidelity performance of the VR-based system can also be improved, as the interaction with the VE was performed with a Flystick2 using a compliant control, whereas a haptic device could improve the interaction fidelity by adding touch sensory-feedback. As motor
control strategies are affected by task learning [23], [39], the experience of the user is to be considered. Unfortunately, as it was not technically possible to alternate RE and VE conditions trial by trial, the effect of experience (or learning effect) has not been evaluated during the experimentation. It is likely that some of the observations made in this study are influenced by experience. Even if most of the learning and adaptation effects happen quickly, subjects only experienced four trials in VE, each between one and three minutes long. This exposure time could not be sufficient to have a meaningful effect on the subjects’ expertise in VR. Conducting the same study with experienced users in VR may lead to closer results between RE and VE, as familiarity is a prevalent factor of performance in VR [22]. Nevertheless, in ergonomic studies, users are mostly novices in VR. Moreover, the duration of the sessions was short enough to avoid fatigue effects that could have highly influenced the indicators of discomfort and biased the comparison between the two environments.
The last limitation of the present study concerns population size. The full-factorial repeated measures ANOVA conducted in the study is based on data following a normal distribution. This condition was not completely fulfilled and resulted in type II error. To prevent that limitation, only reported significant differences were discussed. Further experiments need to be applied to a larger population.
6 CONCLUSION
This study aimed at comparing discomfort indicators obtained for a simulated assembly task performed in RE and VE. Sixteen users, all novices in VR, performed the tasks under different conditions (timing regime, complexity). Kinematical data, elapsed time, and five bipolar EMGs were recorded to compute objective indicators of fatigue and discomfort: Rapid Upper Limb Assessment (RULA) score, averaged muscle activations of erector spinae, deltoideus medialis, biceps brachii, triceps long head, and flexor carpi ulnaris, and total task time. In addition, the rated perceived exertion and a questionnaire were used as subjective indicators of fatigue and discomfort.
The results showed a gap between RE and VE for objective indicators, as well as contradictory results with subjective indicators. Subjects experienced more discomfort in VE, despite less constrained postures and lower muscle activities, except for deltoideus medialis (increase) and triceps long head (no reported influence). These results underline the importance of the interaction and simulation choices when designing a VR-based simulator, as they modify sensory feedback, cognition, and motor control. As fairly good correlations were found for RULA score and AMAs recorded in RE and VE, one can think that the gap between RE and VE can be identified and quantified in order to use VR-based simulators for ergonomics.
This is a first step in the design of more functional VE simulators for ergonomic purposes. Even if the indicators used in this study give a good overview of the gap between RE and VE, further work on task cycle resemblance is necessary. The authors are currently addressing these aspects to understand how kinematics and muscle activations differ between RE and VE and how the gap between real and virtual can be either filled or circumvented.
ACKNOWLEDGMENTS
The authors wish to thank Quentin Avril, Stephen Piton, Marc Christie and Bruno Arnaldi for their kind support. This work was supported by the European Project VISIONAIR3 [16] (VISIONAIR is under grant agreement 262044) and the Danish Council for Independent Research — Technology and Production Sciences (FTP). Grant number: 10092821.
REFERENCES
[1] R. Aggarwal, J. Ward, I. Balasundaram, P. Sains, T. Athanasiou, and A. Darzi. Proving the effectiveness of virtual reality simulation for training in laparoscopic surgery. Annals of surgery, 246(5):771–779, 2007.
[2] A. Alzuheri, L. Luong, and K. Xing. Ergonomics design measures in manual assembly work. In Second International Conference on Engineering Systems Management and Its Applications (ICESMA), 2010, pages 1 –6, 2010.
[3] G. Backstrand, D. Hogberg, L. J. D. Vin, K. Case, and P. Piamonte. Ergonomics analysis in a virtual environment. International Journal of Manufacturing Research, 2:198–208, 2007. [4] B. P. Bernard. Musculoskeletal disorders and workplace factors : a critical review of epidemiologic evidence for work-related musculoskeletal disorders of the neck, upper extremity and low back. Cincinnati, OH: US Department of Health and Human Services, 1997.
[5] G. Borg. Psychiohysical scaling with applications in physical work and the perception of exertion. Scandinavian Journal of Work, Environment and Health, 16(1):55–58, 1990.
[6] A. Burden. How should we normalize electromyograms obtained from healthy participants? what we have learned from over 25 years of research. Journal of Electromyography and Kinesiology, 20(6):1023 – 1035, 2010.
[7] J. Du and V. Duffy. A methodology for assessing industrial workstations using optical motion capture integrated with digital human models. Occupational Ergonomics, 7:11–25, 2007.
[8] P. Emmelkamp, M. Bruynzeel, L. Drost, and C. van der Mast. Virtual reality treatment in acrophobia: a comparison with exposure in vivo. CyberPsychology & Behavior, 4(3):335– 339, 2001.
[9] Eurofound. Change over time - first findings from the fifth European working conditions survey. European Foundation for the Improvement of Living and Working Conditions, 2010. [10] C. Fleury, A. Chauffaut, T. Duval, V. Gouranton, and B. Arnaldi. A generic model for embedding users’ physical workspaces into multi-scale collaborative virtual environments. ”ICAT 2010 (20th
International Conference on Artificial Reality and Telexistence)”, 2010. [11] S. J. Gerathewohl. Fidelity of simulation and transfer of training: a review of the problem. Department of Transportation, Federal Aviation Administration, Office of Aviation Medicine, 1969.
[12] S. Hignett and L. MacAtamney. Rapid Entire Body Assessment (REBA). Applied Ergonomics, 31:201–205, 2000.
[13] B. Hu, L. Ma, W. Zhang, G. Salvendy, D. Chablat, and F. Bennis. Predicting real-world ergonomic measurements by simulation in a virtual environment. International Journal of Industrial Ergonomics, 41(1):64 – 71, 2011.
[14] U. Jayaram, S. Jayaram, I. Shaikh, Y. Kim, and C. Palmer. Introducing quantitative analysis methods into virtual environments for realtime and continuous ergonomic evaluations. Computers in Industry, 57(3):283 – 296, 2006.
[15] D. Kee and I. Lee. Relationships between subjective and objective measures in assessing postural stresses. Applied Ergonomics, 43(2):277 – 282, 2012. Special Section on Product Comfort.
[16] A. Kopecki, U. W¨ossner, D. Mavrikios, L. Rentzos, C. Weidig, L. Roucoules, O.-D. Ntofon, M. Reed, G. Dumont, D. B¨undgens, A. Milecki, P. Baranyi, F. Noel, C. Masclet, M. Attene, F. Giannini, and M. Spagnuolo. VISIONAIR: VISION Advanced Infrastructure for Research. SBC Journal on 3D Interactive Systems, 2(2):40–43, Nov. 2011.
[17] P. Madeleine, D. Farina, R. Merletti, and L. Arendt-Nielsen. Normalisation effects of the upper trapezius mechanomyographic and electromyographic activity during test and fatiguing contraction. European Journal of Applied Physiology, 87:327–336, 2002.
[18] P. Madeleine and T. Madsen. Changes in the amount and structure of motor variability during a deboning process are associated with work experience and neck-shoulder discomfort. Applied Ergonomics, 40(5):887 – 894, 2009.
[19] D. Mavrikios, M. Pappas, M. Kotsonis, V. Karabatsou, and G. Chryssolouris. Digital humans for virtual assembly evaluation. In Digital Human Modeling, Lecture Notes in Computer Sciences 4561, pages 939–948. 2007.
[20] L. McAtamney and E. N. Corlett. RULA : A survey method for the investigation of work-related upper limb disorders. Applied ergonomics, 24(2):91–99, 1993.
[21] R. McMahan. Exploring the Effects of Higher-Fidelity Display and Interaction for Virtual Reality Games. PhD thesis, Dept. of Computer Science, Virginia Tech, 2011.
[22] R. McMahan, D. Bowman, D. Zielinski, and R. Brady. Evaluating display fidelity and interaction fidelity in a virtual reality game. IEEE Transactions on Visualization and Computer Graphics, 18(4):626 – 633, april 2012.
[23] R. Osu, D. W. Franklin, H. Kato, H. Gomi, K. Domen, T. Yoshioka, and M. Kawato. Short- and long-term changes in joint co-contraction associated with motor learning as revealed from surface emg. Journal of Neurophysiology, 88(2):991–1004, 2002.
[24] M. Pappas, V. Karabatsou, D. Mavrikios, and G. Chryssolouris. Ergonomic evaluation of virtual assembly tasks. In Digital Enterprise Technology, pages 511–518. 2007.
[25] C. Pontonnier, M. de Zee, A. Samani, G. Dumont, and P. Madeleine. Cutting force and emg recordings for ergonomics assessment of meat cutting tasks : influence of the workbench height and the cutting direction on muscle activation levels. In ASME 2012 11th Biennial Conference On Engineering Systems Design And Analysis (ESDA2012), 2012.
[26] C. Pontonnier and G. Dumont. Inverse Dynamics Method using Optimisation Techniques for the Estimation of Muscle Forces Involved in the Elbow Motion. International Journal on Interactive Design and Manufacturing (IJIDeM), 3:227–235, 2009.
[27] C. Pontonnier and G. Dumont. Motion Analysis of the Arm based on Functional Anatomy. In 3D Physiological Human 2009, Lecture Notes in Computer Sciences 5903, 2009.
[28] C. Pontonnier and G. Dumont. From Motion Capture to Muscle Forces in the Human Elbow Aimed at Improving the Ergonomics of Workstations. Virtual and Physical Prototyping, 5:113–122, 2010.
[29] C. Pontonnier, G. Dumont., A. Samani, P. Madeleine, and M. Badawi. Designing and evaluating a workstation in real and virtual environment: from digital mock-up to realization. In 3rd IEEE International Conference on Cognitive Infocommunications (CogInfoCom 2012), 2012.
[30] A. Raij, K. Johnsen, R. Dickerson, B. Lok, M. Cohen, M. Duerson, R. Pauly, A. Stevens, P. Wagner, and D. Lind. Comparing interpersonal interactions with a virtual human to those with a real human. IEEE Transactions on Visualization and Computer Graphics, 13(3):443– 457, 2007.
[31] F. Rebelo, P. Noriega, E. Duarte, and M. Soares. Using virtual reality to assess user experience. Human Factors: The Journal of the Human Factors and Ergonomics Society, 54(6):964–982, 2012.
[32] M. Rotea, P. Tsiotras, and M. Corless. Suboptimal control of rigid body motion with a quadratic cost. Dynamics and Control, 8(1):55–81, 1998.
[33] B. Rothbaum, L. Hodges, S. Smith, J. Lee, and L. Price. A controlled study of virtual reality exposure therapy for the fear of flying. Journal of consulting and Clinical Psychology, 68(6):1020, 2000.
[34] M. Sanders and E. McCormick. Human factors in engineering and design . McGRAW-HILL book company, 1987.
[35] M. Slater, A. Sadagic, M. Usoh, and R. Schroeder. Small-group behavior in a virtual and real environment: A comparative study. Presence: Teleoperators & Virtual Environments, 9(1):37–51, 2000.
[36] M. Slater and S. Wilbur. A framework for immersive virtual environments (five): Speculations on the role of presence in virtual environments. Presence: Teleoperators and virtual environments, 6(6):603–616, 1997.
[37] T. Stoffregen, B. G. Bardy, L. Smart, and R. Pagulayan. Virtual and adaptive environments : Applications, implications, and Human performance issues, chapter ”On the nature and evaluation of fidelity in virtual environments”, pages 111–128. Mahwah, NJ and Lawrence Erlbaum, 2003.
[38] J. Svendsen, A. Samani, K. Mayntzhusen, and P. Madeleine. Muscle synergies and force variability during precision and tracking tasks. Human Movement Science, 30:1039–1051, 2011.
[39] K. A. Thoroughman and R. Shadmehr. Electromyographic correlates of learning an internal model of reaching movements. The Journal of Neuroscience, 19(19):8573–8588, 1999.
[40] M. Usoh, E. Catena, S. Arman, and M. Slater. Using presence questionnaires in reality. Presence: Teleoperators & Virtual Environments, 9(5):497–503, 2000.
[41] O. Van der Meijden and M. Schijven. The value of haptic feedback in conventional and robot-assisted minimal invasive surgery and virtual reality training: a current review. Surgical endoscopy, 23(6):1180–1190, 2009.
[42] Y. Wang, K. Liao, Y. Guo, Y. Zhang, W. Zhang, and S. Wu. Development and application of integrated human machine interaction simulation system. Journal of System Simulation, 19(11):2492–2495, 2007.
[43] L. E. Whitman, M. Jorgensen, K. Hathiyari, and D. Malzahn. Virtual reality: its usefulness for ergonomic analysis. In Proceedings of the 36th conference on Winter simulation, WSC ’04, pages 1740–1745. Winter Simulation Conference, 2004.
[44] J. R. Wilson. Virtual environments applications and applied ergonomics. Applied Ergonomics, 30(1):3 – 9, 1999.
[45] B. G. Witmer and M. J. Singer. Measuring presence in virtual environments: A presence questionnaire. Presence: Teleoperators and Virtual Environments, 7(3):225–240, 1998.
Charles Pontonnier received his M.Eng. degree in mechanical and
control engineering from INSA de Rennes, France, the M.Sc. degree in automatics and control from INSA de Toulouse, France, and the Ph.D. degree in mechanical engineering from Rennes 1 university, France, in 2003, 2004 and 2010, respectively. He is currently associate professor in mechanics at the military school of Saint-Cyr Coëtquidan in Guer, France. His research mainly focuses on the definition and the evaluation of motion analysis and virtual reality tools for ergonomic applications.
Afshin Samani received his Ph.D. in Biomedical engineering and science
in 2010 from Aalborg University, Denmark. He is currently employed as an assistant professor in sport science and ergonomics at the Department of Health Science and Technology at Aalborg University, Denmark. He is co-director of the laboratory for Ergonomics and Work-related Disorders. His specific research field is focused on methods of quantification of work exposures and risk factors for the development of musculoskeletal disorders and interactions between muscle pain and motor control in computer users.
Marwan Badawi is a network engineer who turned to VR and 3D during
his Ph.D. at IRISA, Rennes, France. Since then he worked on numerous serious games and vehicle simulators and is now in charge of the technical aspect of scientific collaborations within INRIA’s Immersia3 VR room located in Rennes, France, and one of the biggest in the world.
Pascal Madeleine was born in Toulouse, France, in 1969. He received
the M.Sc. degree in Biomedical Engineering from Paul Sabatier University, Toulouse, France and the Ph.D. degree in 1998 from Aalborg University, Denmark. In 2010, he received the Dr.Scient. degree from Aalborg University, Denmark. He is currently employed as a Professor at the Center for Sensory-Motor Interaction (SMI), Department of Health Science and Technology at Aalborg University, Denmark. He is head of the research interest group within Physical Activity and Human Performance and director of the laboratory for Ergonomics andWork-related Disorders. He has published more 110 peer reviewed scientific journal publications and book chapters. His main area of research interests are the development and application of novel methods and technologies in Ergonomics and Sports.
Georges Dumont is a Professor in Mechanical Sciences at Ecole
Normale Supérieure (ENS) de Rennes, France. He received his PhD in computer science from Rennes 1 University in 1990 and his habilitation in mechanical science in 2005. His main research interests include physical simulation, mechanics, biomechanics, haptic rendering, interactive collaboration and virtual reality.