HAL Id: hal-02143212
https://hal.archives-ouvertes.fr/hal-02143212
Submitted on 29 May 2019HAL is a multi-disciplinary open access archive for the deposit and dissemination of sci-entific research documents, whether they are pub-lished or not. The documents may come from teaching and research institutions in France or abroad, or from public or private research centers.
L’archive ouverte pluridisciplinaire HAL, est destinée au dépôt et à la diffusion de documents scientifiques de niveau recherche, publiés ou non, émanant des établissements d’enseignement et de recherche français ou étrangers, des laboratoires publics ou privés.
Influence of pH, malic acid and glucose concentrations
on malic acid consumption by Saccharomyces cerevisiae
F. Delcourt, Patricia Taillandier, F. Vidal, Pierre Strehaiano
To cite this version:
F. Delcourt, Patricia Taillandier, F. Vidal, Pierre Strehaiano. Influence of pH, malic acid and glucose concentrations on malic acid consumption by Saccharomyces cerevisiae. Applied Microbiology and Biotechnology, Springer Verlag, 1995, 43 (2), pp.321-324. �10.1007/BF00172832�. �hal-02143212�
O
pen
A
rchive
T
oulouse
A
rchive
O
uverte
(OATAO)
OATAO is an open access repository that collects the work of some Toulouse researchers and makes it freely available over the web where possible.This is
an author'sversion published in:
https://oatao.univ-toulouse.fr/22860Official URL :
https://doi.org/10.1007/BF00172832To cite this version :
Any correspondence concerning this service should be sent to the repository administrator:
Delcourt, F. and Taillandier, Patricia and Vidal, F. and Strehaiano, Pierre Influence of
pH, malic acid and glucose concentrations on malic acid consumption by Saccharomyces cerevisiae. (1995) Applied Microbiology and Biotechnology, 43 (2). 321-324. ISSN 0175-7598
F. Delcourt · P. Taillandier · F. Vidal · P. Strehaiano
Influence of pH, malic acid and glucose concentrations
on malic acid consomption by
Saccharomyces cerevisiae
Abstract Malic acid consumption by Saccharomyces
cerevisiae was studied in a synthetic medium. The ex
tent of malic acid degradation is affected by its initial concentration, the extent and the rate of deacidification increased with initial malate concentration up to 10 g/1. For malic acid consumption, an optimal pH range of 3-3.5 was found, confirming that non-dissociated or ganic acids enter S. cerevisiae cells by simple diffusion. A full factorial design has been employed to describe a statistical model of the effect of sugar and malic acid on the quantity of malate degraded (g/1) by a given amount of biomass (g/1). The results indicated that the initial malic acid concentration is very important for the ratio of malate consumption to quantity of biomass. The yeast was found to be most efficient at higher lev els of malate.
Introduction
Malic acid is one of the main organic acids in grapes, and generally it is necessary to remove it from wines in order to improve their organic qualities and to ensure their biological stability. The malic acid concentration usually decreases slightly during alcoholic fermenta tion, but the consumption of this organic acid depends on the genus and species of the yeasts used. The yeast
Schizosaccharomyces pombe has been reported to me
tabolize malic acid efficiently (100%) (Ribereau-Gayon and Peynaud 1962; Mayer and Temperli 1963; Taillan dier et al. 1988).The intensity of malic degradation was not affected by the concentration of malic acid in the medium (Taillandier et al. 1988) unlike the situation in other yeast genera such as Saccharomyces.
F. Delcourt P. Taillandier (IBJ) · F. Vidal · P. Strehaiano ENSIGC, Laboratoire Génie Chimique, URA CNRS 192, 18 chemin de la loge, F 31078 Toulouse Cedex, France, Fax: +33-62 25 23 18
F. Delcourt F. Vidal
CRITT BAC, BP 52, 97152 Pointe à Pitre Cedex, France
The ability of Saccharomyces cerevisiae to use malic acid during the fermentation of a synthetic medium si mulating grape must has been known for many years (Vezinhet and Barre 1982), but few studies deal with the kinetic aspects of malate degradation. It should be noted that, with S. cerevisiae, the malic acid is never completely consumed (Usseglio-Tomasset 1989). The extent of malic acid degradation depends on the me dium composition. It is generally admitted that non-dis sociated organic acids enter yeast cells by simple diffu sion (Salmon 1987a). Baranowski and Radier (1984) have discovered a specific proteic uptake system of malic acid in Saccharomyces bailii, but not in S. cerevi
siae. Salmon (1987b) showed that the malic enzyme of
S. cerevisiae catalyses the NAD(P) + dependent-decar
boxylation of L-malate into pyruvate. This enzyme is characterised by its ability to decarboxylate oxaloace tate and its strong dependence on Mn2 + ions (Puck
and Radler 1974; Kuckzynski and Radier, 1982). Malic acid could play a role in supplying the C4 carbon skele ton through malate dehydrogenase and the oxidative reactions of the tricarboxylic acid cycle when the usual pathway for carbon skeleton synthesis is deficient (Sal mon et al. 1987).
The objective of this work was to increase the level of deacidification of an enological strain of S. cerevisiae. On the one hand we tried to elucidate the effect of ini tial malic acid and glucose concentrations on the level of acid utilisation by the yeast. We were also interested in the effect of pH on malic acid metabolism ( deacidifi cation) during alcoholic fermentation. The pH range of enological conditions is 3-4, we therefore studied the effect of pH on deacidification activity in this range.
On the other hand, we studied the linkage between the ratio of malic acid consumption (g/1) to the amount of biomass (g/1) and initial concentrations of glucose and malic acid. Experimental design techniques have been used to measure the effect of each factor and the interactions with a relatively small number of experi ments.
Materials and methods
Microorganism and culture medium
The strain of Saccharomyces cerevisiae 236 employed in this study was supplied by National Institute of Agronomie Research (INRA) of Guadeloupe. The standard culture medium contained KH2PO4 5 g/1, MgSO4 ·7 H2O 0.4 g/1, (NH4)2SO4 2 g/1, yeast ex
tract 2 g/1, glucose 100 g/1, malate 4.5 g/1, pH 3.4. For some experi ments the glucose, the malate and pH were varied as described in Results.
Culture conditions
Batch experiments were performed in 2-1 fermenters (Setric Ge nie Industriel, Toulouse). The volume of the medium in the fer menter was 1.2 1, the initial concentration of biomass was 3 x 10⁶
cells/ml. The inoculum was prepared in 250-ml conical flasks with 150 ml standard culture medium. The temperature was regulated at 30° C, the pH was not regulated. Agitation rate was 150 rpm.
Analytical determinations
Biomass was estimated gravimetrically. The cell dry weight was obtained by filtration of a known sample volume through a cellu lose acetate membrane filter (Sartorius 0.45 µm), washed with distilled water and dried to constant weight. Cell viability was de termined by methylene blue staining.
L Malic acid concentrations were measured using an enzymat ic procedure from Boehringer Mannheim no 648357. Glucose concentrations were estimated by immobilized glucose oxidase (Yellow Springs Instrument) and ethanol concentrations were de termined by gas chromatography (Intersmat, Pavillon sous bois, France) with a Porapak-Q column, using !-propanol (1% v/v) as the internai standard and a flame ionisation detector. The carrier gas was nitrogen (1.8 bars; 30 ml min 1). The temperature of the column was 170° C, that of the detector 250° C and that of the
injector 250 ° C.
Experimental design
A full factorial design of experiments was used (Goupy 1988). A linear model was used to show the influence of two factors, glu cose and malate concentrations, on the ratio of malate consump tion (g/1) to the quantity of biomass (g/1) in the culture. This bio logical characteristic (y) is represented on this mode! by Eq. 1, where y is the estimated response and x1(glucose) and x2 (malic
acid) are the factor levels:
(1)
x1 and x2 are the coded values of each variable, and b0, bi, bii are
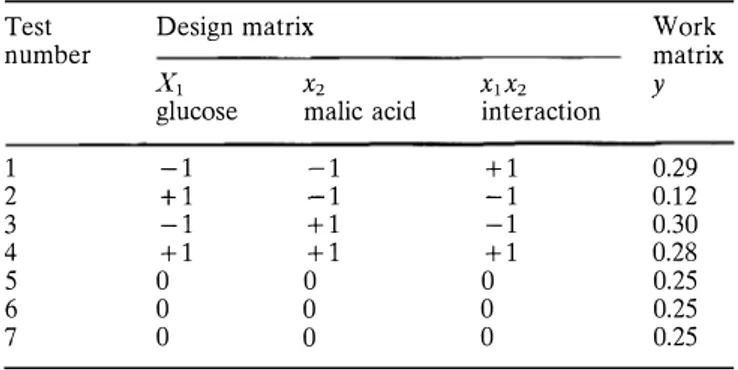
the coefficients of the polynomial estimated by the least-squares method of fitting with a Statitcf multivariable linear regression analysis with constant. The coefficient of multiple correlation (r multiple) indicated the quality of multivariable linear regression. This full factorial design needed seven experiments to be carried out, defined by the coded values of the two parameters (Table 1): three mid points of the coded values (0,0,0) allowing the estima tion of the experimental variance (tests 5 7, Table 1), and four factorial points (tests 1 4, Table 1). The experimental design was a pp lied to the expression of the variable y= ratio of malate con sumption (g/1) to the amount of biomass (g/1).
Table 1 Experimental design defining glucose (x1) and malic acid (x2) initial concentration conditions. Glucose: -1 =50 g/1 and
+ 1 = 100 g/1; malic acid: -1 = 2.5 g/1 and + 1 = 7 g/1
Test Design matrix Work
number matrix
X1 X2 X1X2 y
glucose malic acid interaction
1 -1 -1 +1 0.29 2 +1 -1 -1 0.12 3 -1 +1 -1 0.30 4 +1 +1 +1 0.28 5 0 0 0 0.25 6 0 0 0 0.25 7 0 0 0 0.25 Results
Effect of initial concentration of malic acid
Experiments were conducted in fermenters with stand ard medium except that the malate concentration var ied from 2.5 g/1 to 11 g/1. Figure 1 clearly demonstrates that the concentration of malic acid (2.5-11 g/1) does not affect the specific rate of growth (µ,). For the con centrations studied, malic acid does not restrict the yeast's production of biomass.
The quantity of malate consumed increased with the initial malate concentration up to 9.5 g/1 (Fig. 2). Mal ate was not entirely consumed by the yeasts, but with high initial levels of malate (9.5 g/1), 2.2 g/1 malic acid was degraded and with low levels (2.5 g/1) only 0.8 g/1 was degraded, that is to say about 60% less.
Effect of initial concentration of glucose
The degradation of 4.5 g/1 malic acid was studied for different initial glucose concentrations. The sugar con centration was varied from 50 g/1 to 200 g/1 and, all cases, glucose was exhausted. We noted that both the
0.6 0.4 <> ',.c 1:1 Sil ::L
•
� 0.2ri
•
,
.,
0 4 8 □ 2.5 g/l EB 4.5 g/l a 7 g/l o 9.5 g/l • 11 g/l 12 16 Time (h) 20 24Fig.1 Specific rate of growth [µ=(1/x)(dx/dt)] for different ini tial malic acid concentrations
D (1) 3 E ::,� � .::' 2 0 u� - u o Cl >,U +-:..:; :.;: Cl § E ::, d 0 2.5 4.5 7.0 9.5 11
Initial matie acid concentration (g/l)
Fig. 2 Influence of initial malic acid concentration on the total quantity of malic acid consumed
specific rate of deacidification [ vM, g acid consumed (g
biomasst1] and malic acid consumption (g/1) were
found constant above a sugar concentration of 50 g/1 (Table 2). Below this concentration the initial sugar concentration essentially affects vM and the total quan
tity of consumed malic acid but not the ratio of malic acid consumption to the amount of biomass.
Influence of pH
The initial pH of the medium was varied between 3 and 4. For the different pH values tested the specific dea cidification rates (vM) are shown versus the time for the
three fermentations in Fig. 3. A marked decrease of the maximal value of vM is observed for the higher pH val
ue. Malic acid consumption was respectively 1.2, 1.4 and 0.9 g/1 for the three pH values assayed. Malic acid has pka values of 3.45 and 5.10 for the monoanionic and
dianionic species respectively. These results seem to be consistent with the generally accepted assertion that non-dissociated organic acids enter yeast cells by sim ple diffusion (Salmon 1987a).
Experimental design
The values of y for each experiment are listed in Ta ble 1. The coefficients of the polynomials (b0, bi, bii)
de-Table 2 Influence of the initial glucose concentration on the dea
cidification activity of yeast
Parameter Initial glucose concentration 50 g/1 100 g/1 170 g/1 200 g/1 1-'Ma (g g-1 h-1) 0.2 0.5 0.5 0.5
Malic acid consumption (g/1) 0.6 1.4 1.3 1.3 Ratio of malic acid
consump-tian (g/1)/amount of biomass
(g/1) 0.21 0.23 0.23 0.22
a 1-'M is the specific rate of malate consumption, g acid consumed (g biomass) 1 h-1 = (1/x) (d[malate]/dt) 0.6 0.5 0.4 '.c If]
'01
Dl 0.3 Sil [:J pH 3 :E � 0.2 o pH 4 a pH 3.4 0.1 0 8 12 16 20 24 Time (hlFig. 3 Specific deacidification rate versus time for different initial pH. 1-'M is the specific rate of malate consumption [g acid con sumed (g biomass) 1h-1]
scribing the quantity of malic acid consumed by a given quantity of biomass are listed in Table 3. The coeffi cient of multiple correlation (r multiple) is higher than
90%. Here the simple Eq. 2 is obtained:
y =0.249 (0.0475 ±0.002l)x1 + (0.0425 ±0.0021)x2
+ (0.0375 ± 0.0021) X1X2 (2)
Discussion
For the first series of experiments, when the initial mal ate concentration was below 9.5 g/1, the malate con sumption was greater since its concentration was im portant. Biomass production remained constant ( data not shown) whatever the initial malic acid concentra tion. So, we can conclude that the deacidification activ ity of the yeast increases with the initial level of malic acid up to 9.5 g/1, the critical malate concentration for saturation kinetics.
The formalism of Luedeking and Piret in Fig. 4 for standard medium with 4.5 g/1 malate, shows that, with S. cerevisiae, growth and deacidification activities are strictly linked. This linear correlation means that the cessation of malic acid degradation is simultaneous with the ending of glucose consumption. This model can explain the fact that, with low concentrations of glucose, malic acid was less consumed. Similar observa tions were made by Peynaud et al. (1964).
Table 3 Coefficients for the calculation of y from Eq. 1 Variable
Constant
Population standard deviation r multiple Regression coefficient -0.0475 0.0425 0.0375 0.2486 0.0009 0.99
0.15 0
'..c
0.10'o,
CJl ;:,2 0.05 0 0.1 0.2 0.3 0.4 0.5Fig. 4 Formalism of Luedeking and Piret: 11rvr = f(µ) for standard
culture conditions
According to Eq. 2 obtained from the experimental design, the two factors x1 and x2 have opposite effects
on the ratio malate consumption to quantity of bio mass: glucose concentration has a negative effect whereas malate concentration has a positive effect.This polynomial enables the calculation of the optimal con ditions in order to maximize the activity of deacidifica tion by a given quantity of biomass. As a consequence, it would be better to work with a high level of malic acid and with a low level of sugar. This means that the cells of S. cerevisiae are more efficient at deacidification when there is not tao much, but enough, glucose and a lot of malate up to 7 g/1.
The results presented in this communication show that the yeast S. cerevisiae 236, selected for rum fer mentation in the French West Indies, is quite efficient for malic acid consumption. Because of this it could also be used to make wine from tropical fruits that con tain malic acid but in a lesser quantity than in grape must, about 4 6 g/1.
Acknowledgements We thank A. Parfait and the Centre Région
al d'Innovation et de Transfert de Technologie-Biotechnologie et Agro Industrie de la Caraibe (CRITT BAC) for their financial support based on European program (STRIDE). Thanks are also due to INRA for having put the Saccharomyces cerevisiae 236 at CRITT-BAC's disposai.
References
Baranowski K, Radier F (1984) The glucose-dependent transport of L malate in Zygosaccharomyces bailii. Antonie Van Leeu wenhoek 50: 329 340
Fuck E, Radier F (1974) The decomposition of L malic acid by yeasts of various genera with matie enzyme. Zentralbl für Bakteriol Abt 129: 82 93
Goupy J (1988) La méthode des plans d'expériences. Gauthier Villars
Kuczynski JJ, Radier F (1982) The anaerobic metabolism of mal ate of Saccharomyces bailü and the partial purification and characterisation of matie enzyme. Arch Microbiol 131:266 270
Mayer K, Temperli A (1963) The metabolism of L malate and other compounds by Schizosaccharomyces pombe. Arch Mi crobiol 46: 321 328
Peynaud E, Domercq S, Boidron AM, Lafon Lafourcade S, Guimberfeau G (1964) Arch Microbiol 48:150 165
Ribereau Gayon J, Peynaud E (1962) Application à la vinifica tion de levures métabolisant l'acide malique. C R Séances Acad Agric Fr 48:558 563
Salmon JM (1987a) L Malic acid permeation in resting cells of anaerobically grown Saccharomyces cerevisiae. Biochim Bio phys Acta 901 :30 34
Salmon JM (1987b) Determination of malic enzyme activity on permeabilized cells of Saccharomyces cerevisiae using a dis solved probe. Biotechnol Tech 1: 7 10
Salmon JM, Vezinhet F, Barre P (1987) Anabolic role of L malic acid in Saccharomyces cerevisiae in anaerobiose during alco holic fermentation. FEMS Microbiol Let 42: 213 220 Taillandier P, Riba JP, Strehaiano P (1988) Malate utilization by
Schizosaccharomyces pombe. Biotechnol Lett 10: 469 472
Usseglio Tomasset T (1989) Chimie Oenologique. Technique et Documentation. Lavoisier(ed) pp 122 123
Vezinhet F, Barre P (1982) Action de quelques facteurs du milieu sur le métabolisme de l'acide malique par Saccharomyces et
Schizosaccharomyces au cours de la fermentation alcoolique.