CENTRE D’ETUDES ET DE RECHERCHES SUR LE DEVELOPPEMENT INTERNATIONAL
Document de travail de la série
Etudes et Documents
E 2000.17
Migration, Remittances and Moral Hazard Evidence from the Kayes Area (Western Mali)
Flore GUBERT
Migration, Remittances and Moral Hazard.
Evidence from the Kayes Area (Western Mali)
Flore GUBERT1
Abstract
This article uses recent survey data from the Kayes area (Western Mali) to estimate the effect of migration and remittances on the technical efficiency of agricultural households. A theoretical model is developed, which shows that the more insurance is provided by the migrants, the less incentive their families have to work. A production function using panel data with household-specific fixed effects is estimated to test this hypothesis. The probability of being financially supported by migrants is found to significantly contribute to technical inefficiency. This result should help agricultural policy makers formulate more efficient development strategies in the area.
Résumé
Cet article s'intéresse à la question de l'impact de la migration et des transferts sur le développement rural, dans le cas de la région de Kayes (Mali). L'analyse descriptive des données d'une enquête réalisée dans la zone montre que, malgré le réinvestissement manifeste d'une partie des revenus migratoires dans l'activité agricole, la situation qui prévaut se caractérise par une production stagnante. Partant de ce constat, un modèle théorique est proposé, visant à montrer formellement que la persistance d'une agriculture à faibles rendements résulte du comportement de collecte de rente des familles bénéficiant des transferts, dans un contexte d'asymétrie informationnelle. Ce comportement est appréhendé à travers une analyse de l'efficience technique des exploitations agricoles. Les résultats des estimations vont dans le sens des prédictions du modèle.
Keywords : Migration, risk-coping strategy, moral hazard, technical inefficiency JEL : C23, D24, D82, Q12
1
Université d'Auvergne – CERDI-CNRS, UMR 6587, 65 boulevard François Mitterrand, 63009 Clermont-Ferrand cedex. Email : FGubert@aol.com
This paper is a revised version of the contributed paper at the CSAE conference on “Opportunities in Africa”, Oxford (UK), April 2000, and will be presented at the 8th World Congress of the Econometric Society, Seattle, USA, August 2000.
I am grateful to Jean-Louis Arcand, Jean-Paul Azam, Martine Audibert, Geneviève Boyreau-Debray, Sylvie Lambert, Jean-Yves Lesueur, Patrick Plane, Tina Rambonilaza and anonymous referees for helpful comments and suggestions on earlier drafts, and to the Institut de Recherche pour le Développement (IRD) for financial support. I also thank Boubou Konaté, Moussa Sidibé and Adama Sow for excellent field support.
1- Introduction
The role of migration and remittances in rural development is a very controversial matter. According to Lipton (1980), migration has three damaging effects on the economies of origin. First, migration is overwhelmingly concentrated among young men and deprives those who stay of productive workers and potential innovators. More, and harder, work by women and children is needed to replace absent young men, which pushes down rural output per worker. Second, remittances are unlikely to finance productive and labour-saving investments. Rather, priority goes to everyday needs, which often absorb a large part of a village's remittances. Third, the funds received allow the remaining villagers to achieve a given level of living with less effort and thus encourage them to substitute leisure for effort. Unlike Lipton, Stark (1991) argues that migration, by relaxing the credit and risk constraints faced by agricultural households through remittances, could contribute to technological change and rural development.
As far as migration and remittances are concerned, the Kayes area (Western Mali) is of great interest. Characterised by high emigration rates and stagnant agricultural production, this administrative region of Mali perfectly fits, at first sight, the pessimistic view according to which migration would hamper rural development. A more careful examination of the rural environment shows however that the migrants have been initiating and financing large scale agricultural projects such as village and inter-village cooperatives, irrigation schemes, etc. It is also undeniable that remittances have been promoting technological change at the household level.
This article investigates the claim that the poor performance of agriculture is due to moral hazard effects2. It first attempts to compare the adoption of technology and labour productivity in migrant and non-migrant households on the basis of recent survey data (Section 2). It then develops a theoretical model to show formally that the financial guaranties offered by the implicit insurance contract between the migrant and his family tend to encourage rent-seeking behaviour (Section 3). A production function using panel data with household-specific fixed effects is estimated to test this hypothesis (Section 4). The robustness of the conclusion of technical inefficiency is then studied carefully (Section 5). Section 6 concludes with a summary of the findings of the paper.
2 Moral hazard occurs when an insured takes actions that increase the probability and/or size of his or her losses for which corresponding penalties cannot be levied by insurers.
2- Migration and agriculture: stylised facts
Most of the previous articles devoted to the Kayes area have attributed the persistence of a low-yielding agriculture to the shortage of labour caused by migration and the non-productive use of remittances (Bradley, Raynaut et Torrealba, 1977; Weigel, 1982; Papazian et Aghassian, 1983). This diagnosis is however refuted by a recent four-month field survey we conducted in eight villages of the area3. Our survey data actually suggest a positive correlation between out-migration and its after-effects (remittances) and the number of productive agricultural assets possessed by rural households. They also reveal a large recourse by migrant households to agricultural workers in order to compensate for the potential lack of family labour. Following Meillassoux (1975), we define the household as "a group of individuals who produce in common on at least one field and receive food out of a common store". We set another condition for defining the migrant household: that at least one person who was previously a member of the household has left for more than six months to live or work elsewhere, either in Mali or abroad. Women who out-migrated for marriage and children below 18 years of age at the time of interviews are excluded.
The figures presented in tables 1a and 1b show that the adoption of modern agricultural implements (ox plough, cart) is strongly and positively correlated with out-migration. Generally speaking, the more costly the equipment, the more significant the differences in adoption between migrant and non-migrant households. As correlation is by no means synonymous with causality, what is important to notice here is that the acquisition of productive agricultural assets by migrant households always followed migration.
3 The survey Migration et Transferts, 1997 was conducted by the author between January and April 1997. A sample of 305 farm households was drawn from eight villages located in the Kayes area, on the Senegal River. The objectives of the study were to identify the determinants of out-migration and to assess the economic impact of migration and remittances on rural development.
Table 1a: Percentage of cultivating households owning modern agricultural implements by migration status, 1997
Type of household
All Migrant Non migrant z(*) P>|z| (n=299) (n=221) (n=78)
Donkey plough 19 20 15 -0.89 0.38
Ox plough 51 58 28 -4.66 0.00
Cart 46 53 26 -4.27 0.00
Sowing machine 13 15 9 -1.33 0.19
Sources: Enquête Migration et Transferts, 1997 (*) Mean comparison test
NB: The average prices are 45 000 Fcfa for a donkey plough, 50 000 Fcfa for an ox plough, 135 000 Fcfa for a cart and 75 000 Fcfa for a sowing machine.
Table 1b: Percentage of cultivating households owning more than one agricultural implement by migration status, 1997
Type of household
All Migrant Non migrant z P>|z| (n=299) (n=221) (n=78)
Ox (or donkey) plough + Sowing machine+ Cart 9 10 6 -1.04 0.30
Ox (or donkey) plough + Cart 41 48 23 -3.85 0.00
Ox (or donkey) plough + Sowing machine 12 14 8 -1.37 0.17 Sources: Enquête Migration et Transferts, 1997
The data on average household expenditure on fertiliser, rented equipment and hired labour presented in table 2 show a similar pattern. During the 1996 wet season, migrant households spent 1.75 time as much on agricultural inputs as did non-migrant households. Average expenses on hired labour and rented equipment are, in particular, much higher in the migrant sample, insofar as they balance the lack of able-bodied workers among migrant households.
Table 2: Average household expenditure (*) on agricultural inputs by migration status during the 1996 wet season (Fcfa(**))
Type of household
All Migrant Non migrant t(***) P>|t|
(n=299) (n=221) (n=78)
Fertiliser (****) 193 194 188 -0.12 0.90
Rented equipment 3,785 4,280 2,383 -1.91 0.06
Hired labour 6,248 7,034 4,024 -2.57 0.01
Total 10,227 11,508 6,594 -2.71 0.01
Sources: Enquête Migration et Transferts, 1997
(*) For each household, total expenditures on agricultural inputs were divided by the number of male cultivators working on the farm (in the sahelian context of extensive farming, the number of male cultivators working on the farm is a good proxy for the size of cultivated land).
(**) In 1996, the exchange rate was approximately US$1=Fcfa 600. (***) Mean comparison test
(****) Many cultivating households use both chemical fertilisers and manure. Due to insufficient data, the latter is not considered here.
The variation in the proportion of households owning agricultural productive assets being great among the two sub-samples, the proportion of land cultivated with modern techniques is also significantly higher among migrant households than among non-migrants (table 3).
Table 3: Proportion of plots cultivated with modern techniques by migration status, during the 1996 wet season
Type of household
All Migrant Non migrant t P>|t|
(n=299) (n=221) (n=78) % cultivated plots
with fertiliser(*) 30 31 28 -0.70 0.49
% cultivated plots
with plough 77 80 70 -2.49 0.01
Sources: Enquête Migration et Transferts, 1997 (*)
including manure
We thus find evidence to support the hypothesis that the process of migration, through the inflow of resources and information, has contributed towards promoting the adoption of modern techniques among migrant households. Our sample being restricted to 299 agricultural households, these results should of course be handled with care. However, they tend to show that, through diversification of income sources, migration may have succeeded in partly relaxing the credit and/or risk constraints faced by rural families.
Our survey data on family and hired labour challenge the second usual hypothesis underlying much thinking on the Kayes area, according to which migrant families would be totally deprived of able-bodied workers (table 4).
Table 4 : Percentage distribution of resident household members by sex, age and migration status
Type of household
All Migrant Non migrant t(*) P>|t|
(n=299) (n=221) (n=78)
Males 8.7 (45.3%) 9.8 (45.2%) 5.8 (46.8%) -5.23 0.00
0-14 years old 4.1 (21.4%) 4.7 (21.8%) 2.5 (20.2%) -4.87 0.00 14-65 years old 4.1 (21.4%) 4.5 (20.8%) 3.1 (25.0%) -3.93 0.00 65 years old and over 0.5 (2.5%) 0.6 (2.8%) 0.3 (2.4%) -2.93 0.00 Females 10.5 (54.6%) 11.9 (54.8%) 6.6 (53.2%) -5.99 0.00 0-14 years old 3.9 (20.5 %) 4.4 (20.3%) 2.5 (20.2%) -4.48 0.00 14-65 years old 6.0 (31.2%) 6.8 (31.3 %) 3.7 (29.8%) -6.15 0.00 65 years old and over 0.6 (3.0%) 0.7 (3.2%) 0.4 (3.2%) -2.34 0.02
All 19.2 (100%) 21.7 (100%) 12.4 (100%) -5.87 0.00
% households with 21 25 10 -2.82 0.01
permanent labourers
Sources: Enquête Migration et Transferts, 1997
(*) A χ² test is used for the percentage of households with permanent labourers.
On average, household size is much bigger in the migrant category than in the non-migrant one. With regard to age, the percentage distribution of household members does not significantly differ between the two categories. However, migration flows result in a more pronounced imbalance between males and females.
Losses of male labour are often partly compensated for by employing additional hired labour. 25% of migrant households hired at least one permanent labourer4 during the 1996 wet season, whereas this proportion was only 10% in the non-migrant sample. Agricultural wages are generally paid by the migrants.
Lastly, our data on family labour show that the proportion of children and elderly among cultivating members does not significantly differ between non-migrant and migrant households. This result challenges the idea according to which migration would require more work by members usually exempt from cultivating.
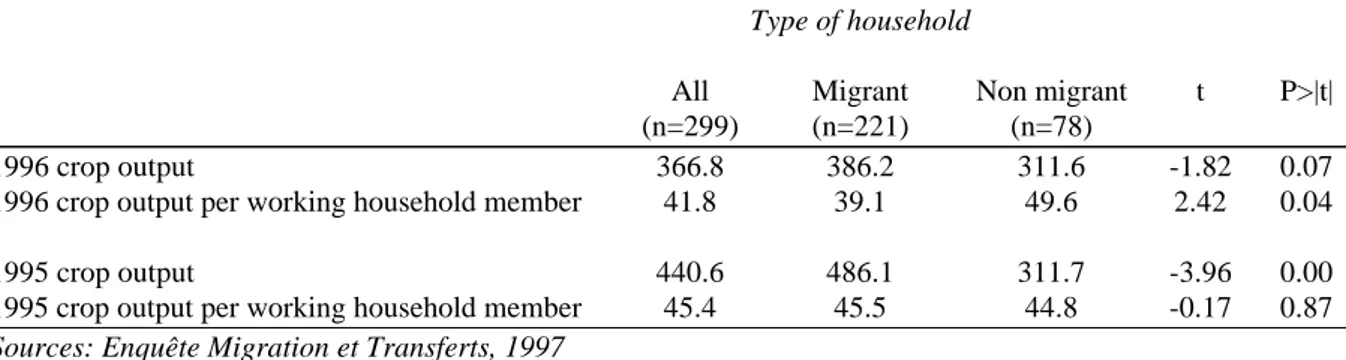
What about output levels ? The data given in table 5 show that despite a better endowment in physical assets, out-migrant households paradoxically do not achieve higher yields (in terms
4 The permanent labourer is usually employed for a crop season or a year. His remuneration consists of a fixed wage and of fringe benefits such as free board and lodging.
of the value of output per working household member5) than non-migrant households. During the 1996 wet season, mean yields were even significantly higher in the non-migrant category.
Table 5: Mean crop output by migration status, during the 1995 and 1996 wet seasons (×1,000 Fcfa) Type of household
All Migrant Non migrant t P>|t| (n=299) (n=221) (n=78)
1996 crop output 366.8 386.2 311.6 -1.82 0.07
1996 crop output per working household member 41.8 39.1 49.6 2.42 0.04
1995 crop output 440.6 486.1 311.7 -3.96 0.00
1995 crop output per working household member 45.4 45.5 44.8 -0.17 0.87 Sources: Enquête Migration et Transferts, 1997
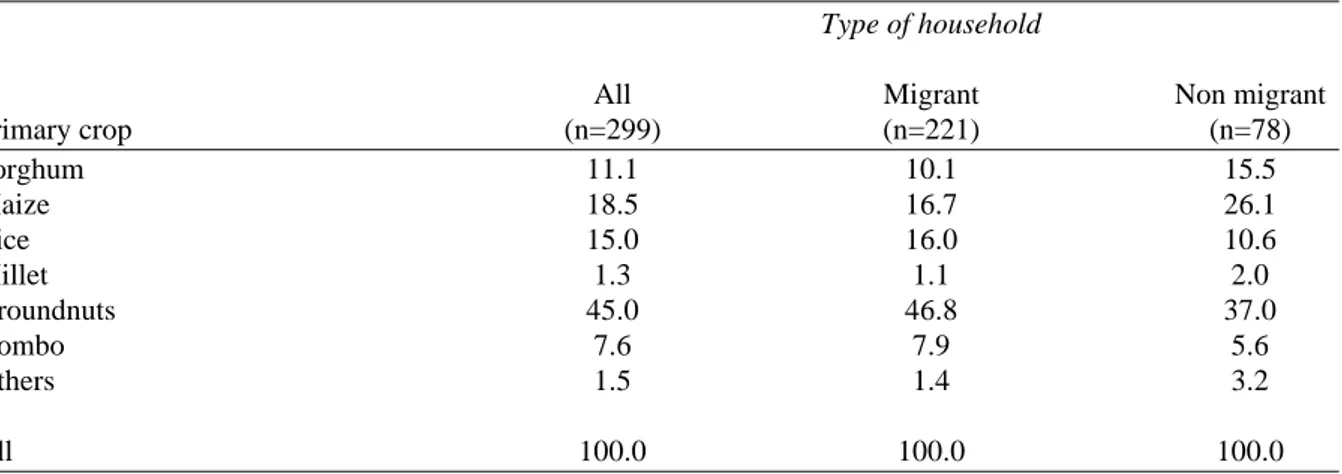
Even if our survey data lead to the same conclusion as that drawn up by previous studies (i.e. the persistence of a low-yielding agriculture among migrant households), they tend to show that this outcome is not due to a lack of workforce, nor to a non-productive use of remittances. Following Udry (1996), we can enumerate many possible sources of variation in mean yields between migrant and non migrant households. First, land quality may vary systematically across plots controlled by migrant and non migrant households. If this were proved correct, it could well explain migration itself. Second, crop or activity choice may be systematically different by migration status. Indeed, as rural families choose to participate in migration, they may alter their activity and crop-production mixes. Table 6 presents summary statistics concerning the different crops grown by migrant and non migrant households on their respective plots. Third, owing to conceivable imperfections in labour and land markets, there may be variation across households in the shadow prices of factors of production and therefore yield variation. Two additional sources of variation in yields may be mentioned: migrant households may suffer output losses arising from a misuse of newly adopted techniques. Lastly, migration may deprive households of their most skilled and motivated members.
5 Here again the number of household members working on the farm is a proxy for the size of cultivated land, in a context of extensive farming.
Table 6: Percentage distribution of plots by primary crop and migration status, 1996
Type of household
All Migrant Non migrant
Primary crop (n=299) (n=221) (n=78) Sorghum 11.1 10.1 15.5 Maize 18.5 16.7 26.1 Rice 15.0 16.0 10.6 Millet 1.3 1.1 2.0 Groundnuts 45.0 46.8 37.0 Gombo 7.6 7.9 5.6 Others 1.5 1.4 3.2 All 100.0 100.0 100.0
Sources: Enquête Migration et Transferts, 1997
Despite the plausibility of all those explanations, direct field observation induces us to favour an entirely different interpretation. Our theoretical hypothesis is that stagnation of agriculture is best understood rather as being the outcome of the disincentive effect of remittances on the productive behaviour of agricultural households. The financial support provided by the migrants makes less essential the balance between production and cereal needs and could give rise to rent-seeking behaviour. Such an opportunism could result in technical inefficiency, where technical inefficiency is defined as the inability of an agricultural household to obtain maximal output from a given set of inputs6.
3- A theoretical model of rent-seeking
In the absence of well-functioning credit and insurance markets, which characterises most rural areas of developing countries, the migration of a family member and its financial after-effects meet two purposes: first, migration may contribute to ease the liquidity and risk constraints faced by rural households and facilitate technological change through remittances (Collier et Lal, 1984 ; Stark, 1991). Second, migration can be viewed as part of a diversification strategy that seeks to protect the household from production or, more generally, income risks. This strategy implies that remittances from migrant workers respond to shocks affecting the recipient families (Stark, 1991). Moral hazard is likely to appear as shocks, be
6 As noted by Mochebelele and Winter-Nelson (2000), technical efficiency is a measure of management error, rather than income or gross output. Lower inefficiency does not correspond to greater yields or greater income. By applying fewer inputs in a consistent and timely manner, a "low-input" farmer could achieve a better technical efficiency score than a farmer employing more inputs and achieving a higher yield.
they climatic or idiosyncratic, are not directly observable by the migrants. This outcome can be analysed in a consistent theoretical framework.
First, assume that, given the production technology and the state of nature, the agricultural household can produce either Yh with probability p(le) or Yl with probability 1-p(le), where l is the amount of labour input and e is the average level of effort applied to these units of labour (le is labour in efficiency units). By assumption, p'>0 and p''<0.
Expected output level is thus given by:
[
1 p(le)]
Y Y ) le ( p ) Y ( E = h+ − l (1)Net income from farm production is:
x
Y −
=
Π (2)
where x is the amount of material inputs other than labour. Output and input prices have been normalised to one, since we are going to use only cross-sectional data in the empirical implementation.
Let v(le) be the disutility of labour for the household, with v(0)=0, v'>0 and v''>0.
Expected utility when the household works le in efficiency units is, assuming risk neutrality:
) le ( v ) C ( E EU = − (3)
where C stands for the agricultural household's level of consumption.
Expected utility is maximised subject to the following cash-income and time constraints:
Y R C =Π + + (4) l 1− = leisure (5)
R denotes remittances from internal and international migrants, Y is exogenous income (e.g.
pension, rental income), and 1 is the total (normalised) time endowment.
We further assume that output levels are such that:
< + ≥ + > C Y C Y l h l h
Y
Y
Π Π ,where Πh (Πl) is net income from farm production when output level is Yh (Yl), and
C can be interpreted as the level of consumption such that basic needs are satisfied7.
Lastly, let remittances be part of a contractual arrangement between the migrants and their families and let this informal arrangement rest on a sense of distributive justice. Concerns for justice imply that the migrants have the duty of satisfying the basic needs of their families
whenever they cannot do it themselves (i.e. whenever C falls below C ). In particular, a clause
in the contract binds the migrants to send funds (or consumer goods) each time their families cannot establish entitlement over an adequate amount of food through purchase or through food production8. Such a transfer of general purchasing power from the migrants to their families may be viewed as an informal tax aimed at re-allocating incomes between the modern capitalist sector, located either in Mali or abroad, and the subsistence farming sector. This family solidarity serves as a substitute for the welfare state of industrialised societies and, by guaranteeing subsistence, provides what may be called a poverty insurance.
The implementation of distributive justice as described above is not Pareto efficient, however, if we assume that the household's effort level is unobservable by the migrant. Imperfect monitoring of effort implies that the migrant cannot ascertain whether low yields in his family's fields are due to his relatives' idleness or to unfavourable weather conditions (or any other unfavourable state of nature). It may thus induce the household to shirk and to rely on the migrant for her subsistence.
7 Quoting Kolm (1996), we define basic needs as "physiological needs for the adequate and normal functioning of mind and body, and the requirements of social existence in norm-determined form of consumption and in means of social relations".
8 Sen's notion of entitlement can be defined as the range of different goods that an economic agent can acquire. The latter depends on what he owns, what exchange possibilities are offered to him, what is given to him free, and what is taken from him (Sen, 1981)
Following Fafchamps (1992), an effective way to prevent the occurrence of moral hazard is to use punishment strategies. The migrant may, for example, threaten his family to break the contractual arrangement by suspending remittances. Since the loss of the migrant's financial support is very costly in intertemporal utility terms, the family has a strong incentive not to shirk. This implies, however, that the migrant is able to check his family's work performance. A comparison of family output with that of others can serve as an indicator of effort. Such a scheme is often referred to as "yardstick competition" in industrial or labour economics (Shleifer, 1985 ; Lazear et Rosen, 1981). Though compensation schemes based on relative performance may provide an efficient mechanism for monitoring productivity, collusive manipulation by participating firms or workers is often an important limitation of yardstick competition (Shleifer, 1985). In the particular case of the Kayes area, some scope for collusion is undeniably present. Agricultural households may for example collude in order to send false signals to the migrants. Acts of collusion, such as the announcement of fictitious natural disasters, were actually observed in the area. Moreover, peer pressure could make family output an unreliable signal, for "zealous" families (i.e. those which do not take advantage of their informational rent) could well be constrained by others to reduce their labour effort9. Ex-ante financial support is, according to Fafchamps (op.cit.), another way to prevent opportunistic behaviour. In the case of the Kayes area, survey data suggest that even if the bulk of remittances occurs after the harvest has been realised, some liquid assets are supplied by the migrants prior to the crop season so that their families may have access to key factors of production.
So far, our theoretical discussion has not taken into account the presence of another informational asymmetry which would this time be beneficial to the migrant. Indeed, the migrant freely decides whether he sends funds or not. If he decides not to, his family cannot ascertain whether this decision is due to temporary money troubles or to his intentional derogation of the contract. Various elements, among which directly moral motivations or migrants' concern about other persons' opinions of them, induce us to believe that the migrants do not take advantage of this informational asymmetry and that the implicit agreement to assist others is enforced by social pressure. Yet, the possible occurrence of money troubles is introduced in the model since it alters the reliability of the poverty insurance mechanism.
Let Ψ the probability that the family be financially supported by the migrant be:
9 The role of peer monitoring have been largely developed in the economic literature (see Stiglitz, 1990; Arnott and Stiglitz, 1991; Kandel and Lazear, 1992; Barron and Gjerde, 1997).
= N N h m Ψ (6)
Ψ is assumed to be positively correlated with the number of family out-migrants (Nm) divided
by the number of family members residing in the country of origin (N). The higher the ratio, the smaller the number of individuals being financially supported by each migrant and the more reliable the insurance mechanism.
Ex-post financial support implies that families suffering a shortfall in income receive an
amount of remittances R in such a way that R≥C−Π −Y with probability Ψ and
Y C
R< −Π − with probability (1-Ψ). We can simplify the model by assuming that the migrants send either an amount strictly equals to the consumption deficit (R=C−Π −Y ) with probability Ψ or no remittances at all (R=0) with probability (1-Ψ), whenever Y =Yl. Under these assumptions, the expected value of remittances is given by:
[
1 p(le)]
(C Y) )R (
E =Ψ − −Πl− (7)
The optimisation problem facing each household is to choose a level of labour effort that maximises expected utility, where expected utility is given by:
) le ( v Y ) R ( E ) ( E EU = Π + + − (8)
[
( ) ( Y C)]
v(le) ) le ( p C ) Y ( ) 1 ( EU = − l+ + + h− l + l+ − − ⇔ Ψ Π Ψ Π Π Ψ ΠThe first-order condition is:
) C Y ( ) ( ) le ( ' p ) le ( ' v l l h− + + − = Π Π Ψ Π (9)
From equation (9), the effect of increasing Ψ on optimal le can be derived from differentiating the first-order condition. The resulting expression can be written as:
[
]
) ( ) ( d dle ² ) le ( ' p ) le ( p ) le ( ' v ) le ( ' p ). le ( v + + = ′′ − ′′ ∆Π ) ( ) ( ) ( ) ( C d Y d d d ) C Y ( l l − + + − − + + − + + Π Ψ Ψ Π Ψ Ψ (10) where ∆Π =Πh−Πl.The results of the comparative static experiments on the level of effort derived from the model may be summarised as follows:
) C , Y , , , ( * le * le = +∆Π −Ψ +Πl + − , (11)
Our model predicts an inverse relationship between the reliability of the insurance mechanism and labour in efficiency units in a context of informational asymmetry. Labour effort also
decreases with the level of guaranteed consumption, while it increases with risk (∆Π), exogenous income and land quality (Πl).
Since we do not have reliable data on labour effort, equation (11) cannot be directly tested. However, if the problem of moral hazard is pertinent per se, one should observe an inverse relationship between the reliability of the insurance mechanism and the households' technical efficiency. This outcome can be analysed formally.
Technical efficiency is defined in the literature by the following ratio:
output imum max output realised TE=
Maximum output in our model is given by Yh, which corresponds to a level of effort le , such
Y Y ) Y Y )( le ( p Y ) Y ( E TE h l l h h + − = = (12) It follows that: 0 Y ) Y Y )( le ( ' p ) le ( ' TE h l h− > = (13)
The main prediction of our model thus becomes: the more reliable the income-smoothing mechanism, the higher the incentive to shirk, the lower the technical efficiency.
In the following section, we attempt to substantiate this hypothesis through the estimation of a production function with household-specific effects using panel data.
4- Empirical implementation
Our first objective in this section is to construct a relevant indicator of each household's unobserved technical efficiency with which to test the hypothesis formulated above. As part of this effort, we estimate a production function with household-specific effects using our survey data. Though interviews were realised on a unique round basis, each household in our sample simultaneously cultivates multiple plots (8 is the average number of plots per household in 1996) and many different crops. Detailed agronomic information on each cultivated plot provides an unusual opportunity to estimate a production function using plot-level data.
We then use the measure of unobservable household-specific technical efficiency to explicitly test the main prediction of our theoretical model.
4-1-The econometric model
Let the production technology on each plot be described by the function :
) , , G , W , X ( g ih i ih µh θih , (14.a)
where i index plots of land and h index households (i=1,…,P, h=1,…,H); Xih is a vector of
characteristics of the individual who controls the plot; µh is a measure of unobservable (by the migrant) household characteristics and θih is a disturbance term that summarises the effects of unobserved plot quality variables and plot-specific production shocks.
Let g(Xih,Wi,Gih,µh,θih)=g(Xih,Wi,Gih).exp(µh+θih)
Once logarithms are taken on both sides, the production function is given by:
θ µh ih ih i ih ih lng(X ,W ,G ) Y ln = + + (14.b)
µh may be treated either as a fixed effect or as a random effect (Greene, 1997, p.615). The fixed effects approach takes µh to be a household constant term in the regression model. The appropriate estimator in that case is usually referred to as the "within-groups" or "fixed
effects" estimator. By contrast, the random effects approach specifies that µh is a household specific disturbance, similar to θih. The model may then be estimated by generalised least squares which yield unbiased and consistent coefficient estimates. Although it is possible to argue for one or the other model, the main problem with the random effects approach is that
unobserved heterogeneity, embodied in the error component µh, may be correlated with observed inputs. In the presence of such correlation, least squares and generalised least squares yield biased and inconsistent estimates of the parameters. The traditional technique to overcome this problem is to use a fixed effects procedure, i.e. to purge the household-specific
effect µh by transforming the data into deviations from household means (Hausman and Taylor, 1981). In that case, a sufficient condition for the OLS estimates from the transformed variables to be unbiased and consistent is that the elements X and W are uncorrelated with the
classical disturbance term θ.
A test for orthogonality of the random effects and the regressors has been proposed by Hausman (1978). It is based on the idea that under the hypothesis of no correlation, the fixed and random effects estimates should not differ systematically. In our case, use of a random effects approach was statistically rejected in favour of a fixed effects approach10 (Chi248=592.3).
10 Following Hausman and Taylor (1981), another possible approach is to find instruments for those columns of X and W which are potentially correlated with µh. The authors suggest in particular to use the columns of X and W
that are uncorrelated with µh as instruments. Since the non-correlation assumptions cannot be tested in all
Still, two potential limitations may arouse scepticism with regard to the use of a fixed effects procedure. First, transforming the data into deviations from household means sweeps out all plot-invariant variables from the regression. Since our model does not include such variables, however, the estimation procedure based on within-groups estimators seems to be relevant. Second, inputs may be correlated with the disturbance term θih. An instrumental variable procedure could overcome this problem, but no exogenously determined instruments are available.
Once equation (13.b) is estimated, the hypothesis that we want to test is whether the reliability
of the insurance mechanism, denoted by Ψ in our theoretical model, is negatively correlated with the household's unobserved level of productivity, measured by µh. In order to do this, we will regress the household-specific fixed effects on a vector of observable household
characteristics including our proxy for Ψ.
4-2- The data
The data used for this study are drawn from the farm household survey we conducted in the Kayes area. On the whole, 305 households in eight villages have been concerned with this survey which includes three types of data:
- General information about each member of the families at the time of interviews: sex, age, education, main and secondary activities, place of residence, migratory experience, etc. - Information on each cultivated plot. Data include size of plot, location of plot, type of crop,
production levels, amounts of male and female labour inputs and amounts of other inputs such as hired labour, fertiliser and equipment. Data allow to identify the individuals who control each plot. Information on farm operations, inputs and outputs on each of the households' plots concerns the 1996 wet season
- Detailed information on wealth, income and expenses for each active member of the families in 1996.
The farming system is characteristic of rain-fed agriculture in sahelian Africa. Active members of a household (both male and female) work on common plots, the output from which is used for the basic consumption needs of the household. In addition, each member of the household cultivates one (or more) individual plot and has an entire control over the output from his fields. Crop choice is different by gender: plots controlled by men are
generally devoted to cereals (sorghum and maize) while plots controlled by women are devoted to groundnuts. After eliminating observations with missing data, the sample consists of 291 farm households with usable data on a total of 2,248 cultivated plots.
4-3- The model specification
The last important issue to be addressed involves the specification of the functional form for
) G , W , X (
g ih i ih . Cases of zero-values of some input variables in our data set make the
Cobb-Douglas specification inappropriate. One option to solve the problem is to confine the analysis to only those farmers who have positive values of the key inputs. However, this method is not satisfactory, since it may result in seriously biased estimators. Another option is offered by Battese (1997), who shows that the "zero-observation" problem in the estimation of Cobb-Douglas production function may be solved by the use of dummy variables such that efficient estimators are obtained using the full data set. The functional form that is implemented is thus given by: θ µ α α α γ x ih w i g ih h ih ih D ln[ (X ,D)] lnW lnG Y ln = + max + + + + (15) where D=1 if Xih=0 and D=0 if Xih>0
The following variables are introduced in the regression:
- Physical inputs (Xih): number of male cultivators aged 14-65, number of female cultivators aged 14-65, hired labour costs (including seasonal workers' wages), use of fertiliser (dummy variable with value 1 if fertiliser was used on the plot, 0 otherwise), use of equipment (dummies); number of ploughing tools ;
- Observable plot characteristics (Wi): type of crop (dummies), location of plot (distance from village), type of plot (dummy variable with value 1 if common and 0 if individual), type of crop interacted with type of plot, type of crop interacted with village dummies (which capture climatic and environmental effects). Due to unreliable data, we do not have any precise information on plot areas. However, in a context of extensive farming, there is a very strong correlation between labour input and plot area, so that labour input combined with agricultural implements may be used as a proxy for the surface of a plot.
- Observable characteristic of the individual who controls the plot (Gih) : age (sex is not introduced here since it is strongly correlated with the type of the plot).
Summary statistics for variables are presented in Table 7.
Table 7: Summary statistics for variables
Variable Obs Sample Sample standard Min Max
mean deviation
1996 production (kg) 2,464 256 527 0.75 10,500
Male labour (1 if no male labour) (%) 2,474 36.3 48.1 0 1
Number of male cultivators 2,474 2.4 2.7 0 15
Female labour (1 if no female labour) (%) 2,474 18.8 39.1 0 1
Number of female cultivators 2,474 1.4 1.4 0 15
Hired labour (1 if no hired labour) (%) 2,501 15.2 35.9 0 1 Hired labour costs (local currency) 2,501 3,100 17,111 0 360,000
Fertiliser (dummy) (%) 2,503 18.8 39.1 0 1
Ox or donkey plough (dummy) (%) 2,503 55.8 49.7 0 1
Number of ploughing tools 2,503 1.1 0.3 0 5
Sowing machine (dummy) (%) 2,503 5.8 23.4 0 1
Type of plot (1: common 0: individual) (%) 2,503 22.6 41.8 0 1 Plot location (distance from village, km) 2,316 1.90 1.75 0.1 15 Plot planted in sorghum (dummy) (%) 2,503 13.1 33.8 0 1 Type of plot × Plot planted in sorghum (%) 2,503 11.4 31.7 0 1 Plot planted in maize (dummy) (%) 2,503 19.9 39.9 0 1 Type of plot × Plot planted in maize (%) 2,503 10.4 30.5 0 1
Plot planted in rice (dummy) (%) 2,503 7.0 25.6 0 1
Type of plot × Plot planted in rice (%) 2,503 0.2 4.0 0 1 Plot planted in groundnut (dummy) (%) 2,503 51.5 50.0 0 1 Type of plot × Plot planted in groundnut (%) 2,503 0.2 4.9 0 1
Age of the plot manager (years) 2,463 39 15 11 82
Data reveal that 22.6% of the plots are common ones and that crop choice is quite different by type of plot, which reflects the gender division of labour mentioned in the preceding section.
4-4- Estimation and results
Table 8 reports the results of estimating equation (14). Only the coefficients on physical
inputs, location of plot, type of plot and type of plot × type of crop are reported, but village indicators interacted with type of crop were also included in the regression11. Even if the analysis of technical efficiency is concerned primarily with the error terms rather than the parameter estimates, some results command attention. First, all input coefficients have positive and highly significant coefficients. The estimated coefficient for the dummy variable for no plough use is significantly negative implying that the intercept of the production
function is lower for farmers who do not use ploughing implements. Conversely, the estimated coefficient for the dummy variable for no labour use is significantly positive implying that the intercept of the production function is higher for farmers who do not hire labour. The reason for this result may be as follows. Binswanger and Rosenzweig (1986) have shown that whenever a worker is not the sole residual claimant of farm profits there is an incentive problem relative to work effort. This implies that hired labour is more costly than family labour because it either requires supervisory inputs by family members or it leads to less effort without supervision. Second, plots' distance from village appears to be positively related to production levels up to a certain point (around 6.5 kilometres). More distant plots, however, are associated with lower production levels. Such a pattern may be due to high fixed travel costs to providing labour on distant plots. Lastly, common plots, generally controlled by household heads, have significantly higher output than individual plots controlled by women. This result may be due to systematic differences in the size or quality of land farmed by men and women, or to differences in labour intensity as women often combine cultivation activities with care for their children (Udry, 1996).
11 Interaction effects were also included to test the hypothesis of an identical technology across plots controlled by migrant and non-migrant households. Results indicated that the hypothesis cannot be rejected
Table 8: Cobb Douglas production function: regression results
Dependent variable: Log (plot production, kg)
Variables Parameters Coef. t P>|t|
Intercept α0 2.57 7.12 0.00 ***
Physical inputs (Xih)
Male labour dummy αx1 0.03 0.48 0.63
Log(number of male cultivators) αx2 0.18 3.50 0.00 ***
Female labour dummy αx3 - 0.12 - 0.18 0.18
Log(number of female cultivators) αx4 0.14 2.81 0.00 ***
Hired labour dummy αx5 0.61 2.07 0.04 **
Log(hired labour costs) αx6 0.10 2.90 0.00 ***
Fertiliser dummy αx7 0.13 2.14 0.03 **
Ox or donkey plough dummy αx8 - 0.13 - 2.47 0.01 **
Log(number of ploughing tools) αx9 0.38 3.41 0.00 ***
Sowing machine αx10 0.42 3.68 0.00 ***
Observable plot characteristics (Wi)
Distance from village αw1 0.13 3.97 0.00 ***
Distance² αw2 - 0.01 - 2.74 0.01 ***
Type of plot (1: common 0: individual) αw3 0.91 3.41 0.00 ***
Sorghum dummy αw4 0.12 0.39 0.69
Type of plot × Sorghum dummy αw5 1.16 3.99 0.00 ***
Maize dummy αw6 0.57 2.00 0.05 **
Type of plot × Maize dummy αw7 0.34 1.20 0.23
Rice dummy αw8 - 0.82 - 2.72 0.01 ***
Type of plot × Rice dummy αw9 - 0.67 - 1.15 0.25
Groundnut dummy αw10 0.52 2.04 0.04 **
Type of plot × Groundnut dummy αw11 - 1.10 - 2.54 0.01 **
Type of crop × Village dummies (28 dummies) (not reported here) Observable characteristic of the plot manager (Gih)
Age αg 0.01 7.86 0.00 *** Specification test χ248=592.28 Number of observations 2,248 R²-within 0.61 F(46, 2067) 62.99 Prob>F 0.00
Note.- All the dummies relative to labour or ox plough take the value one when no labour or no ox plough was used on the plot (zero otherwise). Thus we expect negative signs. The omitted crop category is "all others" (millet, earth peas, gombo and fonio). *: significant at 10% level, **: significant at 5% level, ***: significant at 1% level.
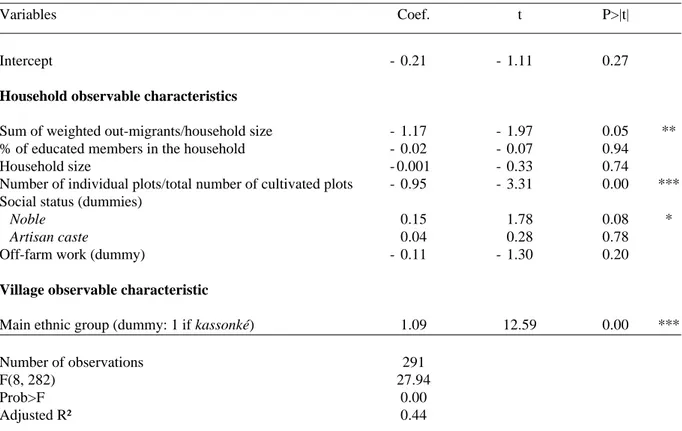
Now that equation (14) has been estimated, the hypothesis that we want to test is whether the reliability of the insurance mechanism is negatively correlated with our measure of unobservable household-specific productivity level. We thus regress the household-specific fixed effect predicted from equation (14) on a vector of observable household characteristics. The latter includes the size of the household, the percentage of educated members within the household, a dummy variable indicating whether the household had any off-farm wages or rents during 1996, dummy variables related to the household's social status12, the number of individual plots divided by the total number of cultivated plots among the household, and the number of out-migrants divided by the number of residents members in the household. In order to get a dependable indicator of the reliability of the poverty insurance mechanism, each migrant was first weighted by his estimated propensity to remit (see appendix for details). A dummy variable indicating whether the main ethnic group of the village is kassonké is also included.
The results from estimation of the OLS equation are presented in table 9.
12 As one might expect, the survey we carried out included no direct question on social status. However, households' last name is a very reliable indicator of social status. Consider, for instance, the Diabira and Sarambounou families in the village of Gakoura, the Konaté family in the village of Fanguiné, the Sissoko family in both the villages of Moussawaguia and Djimékon and the Kouma family in the village of Kérouané, all belong to the upper social strata (i.e. all have a long period of residence in the village or can trace their ancestry back to the founders of the village).
Table 9: OLS regression results
Dependent variable: Predicted household-specific fixed effects (µˆh)
Variables Coef. t P>|t|
Intercept - 0.21 - 1.11 0.27
Household observable characteristics
Sum of weighted out-migrants/household size - 1.17 - 1.97 0.05 ** % of educated members in the household - 0.02 - 0.07 0.94
Household size - 0.001 - 0.33 0.74
Number of individual plots/total number of cultivated plots - 0.95 - 3.31 0.00 *** Social status (dummies)
Noble 0.15 1.78 0.08 *
Artisan caste 0.04 0.28 0.78
Off-farm work (dummy) - 0.11 - 1.30 0.20
Village observable characteristic
Main ethnic group (dummy: 1 if kassonké) 1.09 12.59 0.00 ***
Number of observations 291
F(8, 282) 27.94
Prob>F 0.00
Adjusted R² 0.44
Note.- t-ratios and test statistics are based on heteroscedastic-consistent estimates of the variance-covariance matrix. The omitted social category is "all others" (former slaves, shepherds). *: significant at 10% level, **: significant at 5% level, ***: significant at 1% level.
Estimates indicate that the null hypothesis of moral hazard, corresponding to a statistically negative coefficient associated with our measure of insurance reliability, is strongly supported by the data. The implicit insurance contractual arrangement between the migrants and their family could thus partly explain the poor performance of agriculture among migrant households.
This result is reproduced in figure 1 using predicted technical efficiencies, where predicted technical efficiencies are given by (Chaffai, 1997):
) ˆ ˆ exp( EFFIh= µh−µ , whereµˆ maxµˆh h = with 0≤EFFI ≤1.
The average technical efficiency of households very involved in remunerative migration (the best insured) appears to be much lower than that of less involved households.
Households' technical efficiency appears to be influenced by other variables. The negative sign associated with the proportion of individual plots reflects the rise in labour costs with operational farm scale (Binswanger and Rosenzweig, 1986): the greater the family size, the greater the incentive problem for each individual family worker, as shares in profits are diluted. The positive sign associated with social status may reflect the fact that members who can trace their ancestry back to the founders of the village (Popkin talks about "insiders", see Popkin, 1979) are entitled to plots of greater size and/or higher fertility. Lastly, households' efficiency appears to be higher in kassonké villages. The explanation may be as follows: the involvement of kassonké villages in migration is more recent and far less intense than in neighbouring villages. Acts of collusion between households and peer pressure are thus less likely to appear, and a comparison of family output with that of others may provide the migrants with an efficient mechanism for monitoring productivity.
Figure 1 : Trade-off between technical efficiency and the reliability of the poverty insurance mechanism.
0.1 0.12 0.14 0.16 0.18 0.2 0.22 weak- - - strong Mean technical efficiency Reliability of the insurance mechanism
5- Robustness
Several objections may be raised with the results presented thus far. The most important one
concerns our interpretation of Ψ. First, does Ψ properly measure the effect of the reliability of the insurance mechanism on technical efficiency ? Following Greene (1997, p.981), the answer is no if the typical household who chooses to purchase insurance through migration would be relatively less efficient whether or not she migrated. The problem here is one of self-selection. If this argument is proved correct, then it implies that the least squares coefficient in
the regression of µ on Ψ actually overestimates the insurance effect. What we have to do, thus, is to separate moral hazard effects from potential selection effects in the efficiency model. As part of this effort, we adopt the approach used in Horowitz and Lichtenberg (1993). We construct a model based on a dichotomous selection mechanism known as a "treatment effects model" in the empirical literature13. Estimation techniques are as follows (Heckman, 1979): we first model insurance decisions (migration participation) as a dichotomous choice. The model is estimated as a probit equation using maximum likelihood methods. The estimated coefficients are used to compute the selection variable which is incorporated, in a second stage, in the efficiency model (see appendix for details). A test for selectivity bias is a test for a correlation between the errors of the probit and the corrected OLS regressions being not significantly different from zero. The results are presented in table A3. Since there does not appear to be significant correlation between the error terms, the selection variable and, consequently, household self-selection do not play much of a role in our analysis.
Second, it may be argued that our measure for Ψ should be viewed not as an indicator of the reliability of the poverty insurance mechanism, but rather as a "human capital depreciation rate". Such an argument is based on the idea that the migrants are the most skilled and motivated members of the household and that any new migration induces a decrease in the mean (unobservable) dynamism of those left behind. It is the latter effect that would be
captured by Ψ. Indirect arguments may contribute to disprove such an hypothesis. In a previous study, we showed that the migration decision of an individual was strongly influenced by his or her household status. Sons are more likely to migrate and, in line with law of primogeniture, eldest sons are more likely to migrate. To our knowledge, no study has ever proved that elders were more dynamic and therefore more migration prone than their
13
younger counterparts. Even if we were assured of it, nothing would tell that a migration prone individual is also a successful peasant. Lastly, remember that, in our calculations, each migrant is weighted by his estimated propensity to remit. As non remitters, non economic migrants (students, tied-movers, etc.) are associated with low weights even though their migration is likely to have exacerbated qualified labour shortages within the family.
6- Conclusions
The description of our survey data has revealed that although migration has certainly helped the adoption of improved agricultural technology, migrant households do not show better performance than non-migrant households. Our theoretical assumption is that the implicit insurance contractual arrangement between the migrant and his family gives rise to opportunistic behaviour which results in technical inefficiencies among migrant households. The estimation of a production function using panel data with household-specific fixed effects does not reject the hypothesis. The sum of weighted out-migrants divided by the household size, which is a proxy of the reliability of the insurance mechanism, has a significant and negative effect on households' unobserved level of productive endowment. The hypothesis of a trade-off between insurance and labour efficiency has already been mentioned in the economic literature (Fafchamps, 1992). The original feature of this article is to show that such a trade-off is likely to be observed in the specific context of contractual arrangements between a migrant and his family.
Had the migrant reliable signals on the labour effort of his family, moral hazard issues could be minimised. This would however imply a radical change in the relative powers of the migrant and his family. This change could in turn have consequential effects on the economic side by reviving rivalries between individuals.
Despite a negative effect of migration and remittances on technical efficiency, one should not forget that, on a regional scale, remittances constitute the only reliable mechanism to protect agricultural households from food-insecurity. Without the financial support of the migrants, the two droughts of 1973 and 1984 would have had much worse consequences.
References
Arnott, R., and J.E. Stiglitz, 1991, "Moral hazard and non market institutions: dysfunctional crowding-out or peer monitoring ?", The American Economic Review, vol.81 n°1, March 1991, pp.179-190
Barron, J.M., and K. Paulson Gjerde, 1997, "Peer pressure in an agency relationship", Journal
of Labor Economics, vol.15 n°2, April 1997, pp.234-254
Battese, G.E, 1997, "A note on the estimation of Cobb-Douglas production functions when some explanatory variables have zero values", Journal of Agricultural Economics, 48, pp.250-252
Binswanger, H.P., and M.R. Rosenzweig, 1986, "Behavioural and material determinants of production relations in agriculture", Journal of Development Studies, vol.22 n°3, April 1986, pp.503-539
Bradley, P., C. Raynaut, and J. Torrealba, 1977, Le Guidimakha mauritanien. Diagnostic et
propositions d'action, War on want, Londres,1977
Chaffai, M.E., 1997, "Estimation de frontières d'efficience : un survol des développements récents de la littérature", Revue d'économie du développement, 3/1997, pp.33-67
Collier, P., and D. Lal, 1984, "Why poor people get rich: Kenya 1960-79", World
Development, vol.12 n°10, pp.1007-1018
Fafchamps, M., 1992, "Solidarity Networks in Pre-industrial Societies: Rational Peasants with a Moral Economy", Economic Development and Cultural Change, Vol.41, n°1 (1992), pp.147-174
Greene, W.H., 1997, Econometric analysis, 3rd Edition, International Edition, 1075 p.
Hausman, J.A., 1978, "Specification tests in econometrics", Econometrica, 46, pp.1251-1272
Hausman, J.A., and W.E. Taylor, 1981, "Panel data and unobservable individual effects",
Econometrica, vol.49 n°6 (November 1981), pp.1377-1398
Heckman, J., 1979, "Sample selection bias as a specification error", Econometrica 47, January 1979, pp.153-161
Horowitz, J.K., and E. Lichtenberg, 1993, "Insurance, Moral Hazard and Chemical Use in Agriculture", American Journal of Agricultural Economics 75, (November 1993), pp.926-935
Kandel E., and E.P. Lazear, 1992, "Peer pressure and partnerships", Journal of Political
Economy, n°4 vol.100, August 1992, pp.801-817
Lazear, E.P., and S. Rosen, 1981, "Rank-order tournaments as optimum labor contracts",
Journal of Political Economy, 1981, vol.89, n°5, pp.841-864
Lipton, M., 1980, "Migration from rural areas of poor countries: the impact on rural productivity and income distribution", World Development, Vol. 8, pp. 1-24
Maddala, G.S., 1983, Limited-dependent and qualitative variables in econometrics, Cambridge University Press, 1993
Meillassoux, C., 1975, Femmes, Greniers et Capitaux, Paris, Maspéro
Mochebelele, M.T., and A. Winter-Nelson, 2000, "Migrant Labor and Farm Technical Efficiency in Lesotho", World Development, vol.28 n°1, pp 143-153
Otsuka K., H. Chuma, and Y. Hayami, 1992, "Land and labor contracts in agrarian economies : theories and facts", Journal of Economic Literature, vol. XXX (December 1992), pp.1965-2018
Papazian, V., and M. Aghassian, 1983, Aperçu sur les mouvements migratoires dans les pays
sahéliens de l'Afrique. Réflexions sur leurs effets sur les systèmes de production rurale,
FAO, Rome, 43p.
Popkin, S.L., 1979, The rational Peasant: The Political Economy of Rural Society in Vietnam, University of California Press, Berkeley, 1979
Sen, A., 1981, Poverty and famines. An essay on entitlement and deprivation, Clarendon Press, Oxford
Shleifer, A., 1985, "A theory of yardstick competition", Rand Journal of Economics, vol.16, n°3, Autumn 1985, pp.319-327
Singh, I., L. Squire, and J. Strauss, 1986, Agricultural household models. Baltimore, Maryland. The Johns Hopkins University Press, 1986
Stark, O., 1991, Migration of Labor, Basil Blackwell, 1991
Stiglitz, J.E., 1974, "Incentives and risk sharing in sharecropping", Review of Economic
Studies, 41(2), pp.219-256
Stiglitz, J.E., 1990, "Peer monitoring and credit markets", The World Bank Economic Review, vol.4 n°3, pp.351-366
Udry, C., 1996, "Gender, Agricultural Production, and the Theory of the Household", Journal
of Political Economy, 1996, vol.104 n°5, pp.1010-1046
Weigel, J.Y., 1982, Migration et production domestique des soninké du Sénégal, Travaux et documents de l'ORSTOM, n°146, 1982, 133 p.
Appendix
RELIABILITY OF THE INSURANCE MECHANISM: MIGRANTS' WEIGHTS COMPUTATION
The migrants do not constitute an homogeneous group and do not have, in particular, the same propensity to remit, the latter being strongly dependent on individual characteristics. We thus computed individual predicted probabilities to remit through the estimation of a probit model. The dependent variable is dichotomous and has values one (or zero) if the migrant is a remitter (or is not a remitter). Each migrant was then weighted by his estimated propensity to remit.
Table A1 : Probit model of remittances
Variables Coefficients Marginal effects z P>|z|
Intercept - 5.26 - 7.06 0.00 *** Age 0.19 0.070 5.00 0.00 *** Age²/100 - 0.20 - 0.073 - 4.20 0.00 *** International out-migrant 0.47 0.176 2.80 0.01 *** France 1.44 0.483 7.96 0.00 *** Household head 1.11 0.286 2.60 0.01 *** Brother 0.61 0.206 2.77 0.01 *** Son 0.85 0.287 4.65 0.00 *** Number of observations 560 Chi-squared (7) 312.07 Pseudo-R² 0.42 Predicted 0 1 Total Actual 0 169 52 211 1 64 275 339 Total 233 327 560
Note.- ***: significant at 1% level
Mean predicted probabilities by place of residence are given in table A2.
Table A2 : Mean predicted probabilities by place of residence
Mean Standard error n
Internal migrant 0.26 0.18 175
International migrant 0.77 0.27 385
France 0.90 0.13 276
TEST FOR SELECTIVITY BIAS
The procedure described below is the one proposed by Heckman (1979).
We first model insurance decisions (migration participation) as a dichotomous choice:
≤ = > = 0 if 0 M 0 if 1 M * h h * h h Ψ Ψ ,where Ψ*h=γ'wh+uh (A.1)
As before, technical efficiency depends on household characteristics and on migration participation: v M Z ' ˆh=β h+ξ h+ h µ (A.2) (u,v)~bivariate normal [0,0,σu,σv,ρ].
If it is the case that migrant households are self-selected, then uh and vh are correlated and
least squares estimates of ξwill overestimate the insurance effect.
To correct for this problem, we define
− − − = ) w ' ( 1 M 1 ) w ' ( M ) w ' ( h h h Φ γ Φ γ γ φ Ω , where φ and
Φ are the probability density and cumulative distribution function of the standard normal
distribution, respectively, defined over the observable variables which determine migration
status. Ω can be treated as a missing variable in equation (A.2) . By finding instruments for this variable, it can be added to the specification of equation (A.2) which can then be consistently estimated by OLS.
A two-stage method is used to estimate the model. In the first stage, a probit model of
migration participation provides estimates of γ. These estimates are then used to estimate Ω. In the second stage, this variable is added to equation (A.2) and the following equation is estimated: η Ω ρσ ξ β µˆh= 'Zh+ Mh+ ˆh+ h (A.3)
where ρ is the correlation between error terms u and v.
In order to get consistent and fully efficient estimates of the parameters, we use the maximum likelihood procedure to estimate the model. The results are presented in table A3.
Table A3: Results of the selection model
Variables Coef. z P>|z|
Selection (probit) equation
Intercept - 0.16 - 0.21 0.83 Village dummies Djimékon - 1.17 - 2.52 0.01 ** Fanguiné - 0.04 - 0.11 0.91 Kérouané - 0.95 - 2.85 0.00 *** Moussawaguia 0.07 0.12 0.90 Dyalla - 0.72 - 1.79 0.07 * Somankidi - 0.45 - 1.12 0.26 Diakandapé - 0.52 - 1.26 0.21
% of educated members in the household 0.79 1.39 0.16
Household size 0.04 2.87 0.00 ***
Number of individual plots/total number of cultivated plots - 0.99 - 1.76 0.08 *
Age of household head 0.02 1.79 0.07 *
Social status (dummies)
Noble - 0.16 - 0.63 0.53
Artisan caste 0.15 0.28 0.78
Off-farm work (dummy) - 0.40 - 1.73 0.08 *
Corrected regression
Insurance (migration dummy) - 0.25 - 1.74 0.08 *
% of educated members in the household - 0.03 - 0.15 0.88
Household size 0.003 0.63 0.53
Number of individual plots/total number of cultivated plots - 0.87 - 3.53 0.00 *** Social status (dummies)
Noble 0.15 1.30 0.19
Artisan caste 0.003 0.01 0.99
Off-farm work (dummy) - 0.10 - 1.22 0.22
Main ethnic group (dummy: 1 if kassonké) 1.10 11.43 0.00 ***
σ 0.65 24.16 0.00 ∗∗∗
ρ - 0.05 - 0.27 0.79
Number of observations 291
Log likelihood - 413.9
Note.- *: significant at 10% level, **: significant at 5% level, ***: significant at 1% level.
The z=-0.27, not significantly different from zero result suggests that there is no significant correlation between the errors in (A.1) and (A.2). The estimated coefficients in table A3 do not
change much when Ω is dropped from the regression. As a result, household self-selection does not play much role in our analysis.