Lowbush blueberry fruit yield and growth
response to inorganic and organic
N-fertilization when competing with two
common weed species
Charles Marty1, Jose´e-Anne Le´vesque1, Robert L. BradleyID2, Jean Lafond3, Maxime
C. Pare´ID1*
1 Laboratoire d’e´cologie Ve´ge´tale et Animale, De´ partement des Sciences Fondamentales, Universite´ du Que´ becàChicoutimi, Saguenay, QC, Canada, 2 De´ partement de Biologie, Universite´ de Sherbrooke, Sherbrooke, QC, Canada, 3 Soils and Crops Research and Development Centre, Agriculture and Agri-Food Canada, Normandin, QC, Canada
*Maxime_Pare@uqac.ca
Abstract
Inorganic N fertilizers are commonly used in commercial blueberry fields; however, this form of N can favor increased weed species’ growth, which can ultimately reduce the benefits of fertilization. We hypothesized that chipped ramial wood (CRW) compost is an effective alter-native organic fertilizer for blueberry plants when weeds are present, as ericaceous shrub species are generally more efficient in utilizing organic N than herbaceous weed species. In this study, we measured the growth, fruit yield, and foliar N response of lowbush blueberry (Vaccinium angustifolium Aiton) to an application of 45 kg N ha-1in the form of organic (CRW) or inorganic N (ammonium sulfate) in two areas of a commercial field colonized by either poverty oat grass (Danthonia spicata (L.) Beauv.) or sweet fern (Comptonia peregrina (L.) Coult.). We also assessed the impact of the fertilization treatments on litter decomposi-tion rates. Contrary to our hypothesis, we found no significant increase in blueberry fruit yield or growth using CRW. By contrast, inorganic N-fertilization increased fruit yield by 70%. The effect was higher in the area colonized by D. spicata (+83%) than by C. peregrina (+45%). Blueberry fruit yield was on average twice higher in the area of the field having D. spicata than C. peregrina, suggesting a stronger competition with the latter. However, the increase in D. spicata density from 0–1 to>25 plants m-2reduced fruit production by three-fold and strongly impacted vegetative growth in both fertilized and unfertilized plots. The impact of increased C. peregrina density was comparatively much lower, especially on veg-etative growth, which was much higher in the area having C. peregrina. These patterns are likely due to a lower competition for N uptake with C. peregrina as this species can derive N from the atmosphere. Interestingly, the higher fruit yield in the area colonized by D. spicata occurred even in plots where the weeds were nearly absent (density of 0–1 plant m-2), revealing the influence of unidentified variables on blueberry fruit yield. We hypothesized that this difference resulted from over-optimal foliar N concentrations in the area colonized by C. peregrina as suggested by the significantly higher foliar N concentrations and by the negative correlation between foliar N concentrations and fruit yields in this area. The
a1111111111 a1111111111 a1111111111 a1111111111 a1111111111 OPEN ACCESS
Citation: Marty C, Le´vesque J-A, Bradley RL, Lafond J, Pare´ MC (2019) Lowbush blueberry fruit yield and growth response to inorganic and organic N-fertilization when competing with two common weed species. PLoS ONE 14(12): e0226619.
https://doi.org/10.1371/journal.pone.0226619
Editor: Remigio Paradelo Nu´ñez, Universidade de Santiago de Compostela, SPAIN
Received: June 11, 2019 Accepted: December 1, 2019 Published: December 26, 2019
Copyright:© 2019 Marty et al. This is an open access article distributed under the terms of the
Creative Commons Attribution License, which permits unrestricted use, distribution, and reproduction in any medium, provided the original author and source are credited.
Data Availability Statement: All relevant data are within the manuscript and its Supporting Information files.
Funding: M.P. and R.L.B. received funding from Fonds de recherche axe´ sur l’agriculture nordique (FRAN-02), the Fonds de recherche du Que´bec – Nature et technologies (FRQNT), and the Fonds de de´veloppement de l’Universite´ du Que´becà Chicoutimi (FUQAC) The funders had no role in study design, data collection and analysis, decision to publish, or preparation of the manuscript.
possibility of an influence of C. peregrina on flowering and pollination success, as well as of unidentified local site conditions is discussed. The tested N-fertilization treatments did not affect foliar N concentrations or litter decomposition rates. Overall, our results show that ammonium sulfate is very effective at increasing fruit yields but that both fruit yields and the efficiency of the N-fertilization treatment are decreased by increased D. spicata density, especially above 25 plants m-2. Although CRW did not significantly enhance fruit yields in the short term, this fertilizer may have a long-term beneficial effect.
Introduction
Wild lowbush blueberry (Vaccinium angustifolium Aiton) is a perennial ericaceous shrub spe-cies that naturally forms dense and extensive colonies in the boreal forests of eastern North America. Following a major forest disturbance, such as wildfire or clearcutting, this shrub will spread and dominate the vegetative cover due to its extensive rhizomatic network [1]. Low-bush blueberry is grown for its fruits and represents an economically important crop in north-eastern North America, especially in Quebec, Maine, and the Canadian Atlantic provinces. Quebec’s commercial production expands over more than 35,000 ha and represented about the third of the Canadian production over the period 2010–2014 (20,373 t yr-1) [2].
Inorganic N fertilizers, mainly ammoniacal forms (N-NH4+), are used in commercial
blue-berry fields to stimulate vegetative growth and fruit yield [3]. This fertilizer is usually applied in the early spring of the vegetative year [4], and its application is often accompanied by weed control treatments [5]. The presence of weeds tends to diminish yields and the efficacy of inor-ganic N-fertilization [6] because some weed species are more efficient than blueberries in the taking up of inorganic N [7]. On the other hand, boreal ericaceous shrubs are more efficient in taking up organic N-forms from humus than other boreal forest plants [8,9] due to their asso-ciation with ericoid mycorrhizal fungi [10,11]. Therefore, we hypothesized that lowbush blue-berry is more competitive than companion weed species when fertilized with organic
substrates. If true, then the use of organic fertilizers may provide an option for weed manage-ment in commercial lowbush blueberry production [12]. This needs to be assessed, however, because blueberry fertilization studies using different organic sources, e.g., peat moss, pine bark, sawdust, hay, manure, paper, leaf litter, plant residues, and compost, have produced inconsistent results. For instance, two studies reported an increase in blueberry yields and foliar nutrient concentrations after fertilizing with paper mill sludge [13,14]. In contrast, War-man [15] found that organic manures had no significant effect on fruit yields or leaf N concen-trations, whereas Warman et al. [16] showed that municipal wastes increased foliar nutrients but did not improve yields. It is thus possible that ericoid mycorrhizae associated with lowbush blueberry roots have a greater affinity for organic nutrients derived from forest woody debris, e.g., paper mill sludge, than from other organic sources—manures and municipal wastes. There is a need to evaluate the fertilization potential of other forest-based composts.
Chipped ramial wood (CRW) is an organic material derived from the small branches, bark, and leaves of tree saplings. This woody debris contains nutrients, sugars, celluloses, proteins, and lignin, all of which contribute to the formation of a fertile compost [17]. Composted CRW can improve soil structure, water-holding capacity, and soil biological activity, features that are essential for maintaining healthy crops [18,19]. Several studies have shown the short, medium, and long-term efficacy of CRW compost on agricultural production on different types of soil and in various climates [18]; to our knowledge, however, this type of fertilizer has never been
Competing interests: The authors have declared that no competing interests exist.
tested in lowbush blueberry fields. Applying CRW compost to lowbush blueberry crops may not only be a means of increasing growth and fruit production but may also alleviate the need for chemical weed control. We thus conducted a study in a commercial lowbush blueberry field in Quebec, where we compared the growth and yield of lowbush blueberry when fertilized with ammonium sulfate or CRW compost in competition with two common weed species, namely poverty oat grass (Danthonia spicata (L.) Beauv.; thereafter D. spicata) and sweet fern (Comptonia peregrina (L.) Coult.; thereafter C. peregrina). These two species are characterized by distinct functional traits which drive the direction and the magnitude of interactions with lowbush blueberry [7].D. spicata is a perennial grass (Poaceae) that is native to North Amer-ica, commonly found in the pastures of southern Quebec and the Maritime provinces where it invades dry-soil and low-fertility agricultural fields due to its numerous, shallow and fibrous roots [20]. In contrast,C. peregrina is a N2-fixing woody shrub of the Myricaceae family that
grows 0.3–1.5 m in height which spreads mainly by rhizomes and forms thickets in sunny or partially shady locations. This plant also develops cluster roots, allowing this species to colo-nize sterile soils, such as abandoned fields and pine barrens, and to grow well on nutrient-depleted—especially P-limited—habitats [21]. This species represents one of the most serious weed problems in the commercial lowbush blueberry fields of eastern Canada [22]. In a previ-ous study, we showed thatD. spicata is a strong competitor for inorganic N fertilizer acquisi-tion due to its shallow and dense root system, whereasC. peregrina has a beneficial impact on blueberry growth due to its N2-fixation ability [7]. However, the latter may be a stronger
com-petitor when N-fertilization occurs as organic N due to its cluster roots. Therefore, we hypoth-esized that the positive response of lowbush blueberry growth and fruit yield to CRW addition would be stronger in competition withD. spicata than with C. peregrina. Conversely, we hypothesized that the presence ofD. spicata would strongly reduce fruit yields in plots fertil-ized with inorganic N, whereasC. peregrina would have a minor effect due to its ability to obtain part of its N from the atmosphere.
Materials and methods
Study site
The study was conducted in a commercial lowbush blueberry field owned by the St-Eugene Coop (i.e., producers’ association) which granted us permission to conduct this research work. This commercial field is located near Saint-Eugène d’Argentenay in the Saguenay–Lac-Saint-Jean region, Quebec, Canada (48˚590N, 72˚180W), which contains 82% of Quebec’s commer-cial lowbush blueberry surface area [2]. A study was previously conducted on this field to assess the ability of the three aforementioned species to acquire15N from an inorganic fertilizer [7]. Soils in the lowbush blueberry stands are podzols characterized by fine sands that originate from fluvioglacial deposits. The soils are very acidic and have a low water retention capacity; they are thus non-fertile [23]. The region is characterized by a cold and humid climate having a mean annual air temperature of 0.8˚C and annual precipitation of ~948 mm. Mean precipita-tion and air temperature during the growing season (May–August) are 346 mm and 14˚C, respectively. The studied lowbush blueberry field was established in 2005 and has an average stem density of ca. 500 m-2. The blueberry crop is currently cultivated over a 2-year cycle, i.e., one year of vegetative growth followed by a fruit production year. After fruit harvesting, the stand is then mowed at the end of fall or early in the following spring.
Experimental design
In autumn 2014, we surveyed the commercial field to find areas colonized either byC. pere-grina or D. spicata. Two distinct areas separated by ca. 2 km (one colonized by C. perepere-grina,
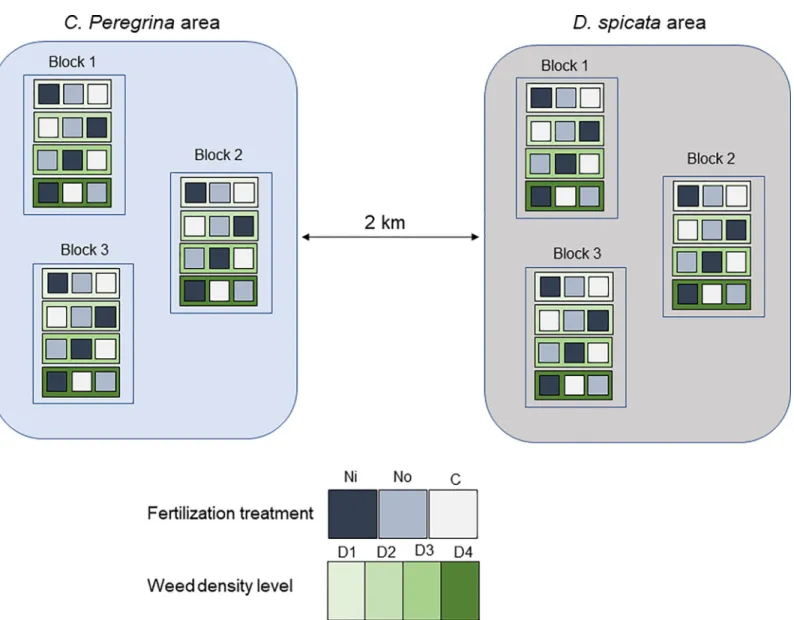
the other byD. spicata) were selected. In each area, we estimated initial weed density (number of plants�m-2) visually, and we established 1× 1 m plots to have four levels of plant density for each weed (0–1, 2–3, 4–5, and 6+ plants m-2forC. peregrina, and 0–1, 5–10, 15–20, and 25+ plants m-2forD. spicata). Each of the four weed density plots was replicated three times—one density plot for each treatment—within three separate blocks (Fig 1). The blocks were located at least 100 m away from each other. We dug a narrow trench (~40 cm deep) around each experimental plot and filled it with two layers of polyethylene tarpaulin in order to isolate the root systems and retain the maximum amount of fertilizer within the plots. We then mowed the vegetation (lowbush blueberry and weeds) to a height of ~0.5 cm above the soil level in all 72 plots (2 weed species× 4 weed density levels × 3 fertilization treatments × 3 blocks).
We applied the fertilization treatment in early June 2015. For the inorganic N-fertilization treatment, we spread a 2 L solution of ammonium sulfate [(NH4)2SO4], which corresponded
to an input of 45 kg N ha-1, i.e., the recommended N-fertilization rate for the region. As
Fig 1. Schematic view of the experimental field. The studied lowbush blueberry commercial field contains two distinct areas (one colonized byD. spicata and the other one byC. peregrina) located ca. two kilometers away from each other. Each of these areas contain three blocks with four weed density levels and three N-fertilization treatment.
recommended in Quebec’s wild blueberry production guide, we also applied 20 kg ha-1of P2O5and 20 kg ha-1K2O. For the organic N-fertilization, we applied composted CRW
pro-vided by the Ferland-Boileau Forestry Coope´rative (Saguenay, Quebec) as a homogeneous layer. The CRW was composed exclusively of hardwoods, mainly fire cherry (Prunus pennsyl-vanica), green alder (Alnus viridis), and white birch (Betula papyrifera). Assuming a N-use effi-cacy of 12.5% for this type of organic material [24], equivalent to ca. 45 kg N ha-1, we required the application of 10 kg of CRW (wet basis) per plot, i.e., 100 t ha-1. This CRW input also pro-vided the equivalent of ca. 22 kg P ha-1and ca. 51 kg P ha-1. The chemical composition of the CRW is presented in the supplementary materials (S1 Table). After adding the CRW, we added 2 L of demineralized water. The control plots received no N-fertilization but received 20 kg ha-1of P2O5and 20 kg ha-1K2O and 2 L of demineralized water. No pesticides or weed
con-trol (herbicides, mechanical concon-trol) were applied in any of the treatments.
Blueberry foliar chemistry
In mid-July 2015, i.e., about two months after the application of the fertilizer, we harvested leaves from ten randomly selected stems from each plot. We dried the leaves at 60˚C for 72 h and ground them using a cutting mill (Pulverisette 19, Fritsch, Idar-Oberstein, Germany). Chemical analyses were performed at Agriculture Canada’s experimental farm in Normandin after moist digestion with H2SO4+ H2O2[25]. Colorimetry (Lachat Instruments, Quickchem
Method 13-107-06-2-E; 15-501-03) was used to measure N and P concentrations, whereas K concentrations was determined by flame emission spectroscopy, and Ca and Mg concentra-tions by atomic absorption spectrometry (Perkin Elmer Analyst 300, Uberlingen, Germany).
Blueberry fruit biomass
We hand-harvested the blueberry fruits from each plot during the week of August 15, 2016, and we weighed the fruits immediately after their collection. We removed a ~125 mL subsam-ple of fruit for each plot and dried them at 65˚C for five days; we used these samsubsam-ples to estimate the dry matter content. We estimated the mass of individual berries of this subsample by divid-ing the total mass by the number of berries contained in the subsample (78–538 berries).
Total vegetative aboveground biomass
At the end of the production year (August 2016), we harvested the vegetative biomass of the weed species and lowbush blueberry from each plot—at ~0.5 cm above the soil level—and transported the harvested biomass to the lab. For each plot, we dried the aboveground biomass of each species at 60˚C for 72 h and then measured the dry mass.
Litter decomposition
We measured litter decomposition using the litterbag method. For this purpose, we manufac-tured 10 cm× 10 cm fiberglass net bags (1.5 mm mesh) that we filled with 2–3 g of fresh low-bush blueberry leaves. A fraction of the fresh litter was stored in the freezer (-14˚C), another was dried at 55˚C for 48 h to determine the water content of the fresh litter, and the other was buried within the litter bags in the plots on June 23, 2015, approximately one month after the application of the fertilizers. We buried three bags per plot, 30 cm apart. We placed the bags horizontally into the organic horizon of the soil, at 2–5 cm depth. We buried all three bags per plot along the same edge of the plots to minimize any disturbance to the existing biomass of the plots.
We placed fresh litter bags only in plots of the lowest and highest weed density, i.e., D1 and D4. During the experiment, we removed bags (one bag per plot) on three separate dates to assess the impact of incubation duration on litter decomposition. As such, we buried a total of 108 bags (3 fertilization treatments× 2 weed species × 2 weed density levels × 3 dates × 3 repli-cates = 108 bags). We collected one-third of the bags (36) in the fall of 2015 after 114 days of incubation. We removed another set of bags (36) from the soil in the spring of 2016 after 330 days of incubation, and the remaining bags were removed from the soil in August 2016 after 420 days of incubation.
Once the bags had been exhumed, we placed them immediately into plastic bags and stored the samples in a freezer (-14˚C). To prepare the buried litter bags, we removed the litter from the bags, dried the litter at 55˚C for 48 h, and then brushed away sand and root fragments from the litter samples using a binocular microscope. We then weighed and finely ground the samples (Mixer Mill MM 200, Retsch, Haan, Germany) before sending the material to Agricul-ture Canada’s Normandin Experimental Farm for determining their respective C and N con-tents via dry combustion (TruMac CNS macro analyze, Leco, St. Joseph, USA).
We calculated the mass as well as N and C losses (%) during field incubation as:
%loss ¼ ½ðXi XfÞ=Xi� � 100 Eq1
where Xiand Xfare respectively the initial and final values for mass (g), C (g), or N (g) content
of the samples.
Statistical analyses
We performed a principal component analysis (PCA) on nine response variables and the 72 plots using theade4 package in R [26]. We then ran mixed-ANOVA on the number and mass of fruits produced by lowbush blueberry as well as the aboveground vegetative biomass pro-duction. The mixed models had fertilization treatment (three levels), weed species (two levels), and weed density (four levels) as fixed effects and blocks (three blocks per area) as the random effect. We also applied mixed-model analyses to litter decomposition with treatment (three levels), weed species (two levels), weed density (four levels), and incubation duration (three levels) as fixed effects and blocks (three blocks per site) as the random effect. Mixed-model analyses were performed running thelmerTest package in R, which uses the Satterthwaite’s degrees of freedom method [27]. The packageemmeans, which is an updated version of the lsmeans package [28], was used to estimate marginal means and conduct a post-hoc mean comparison between the factors’ levels.
Results
Blueberry fruit production
The analyses of variance revealed significant effects of the companion weed species, the N-fer-tilization treatments, and weed density on both the number and the mass of fruit produced per hectare (Table 1).
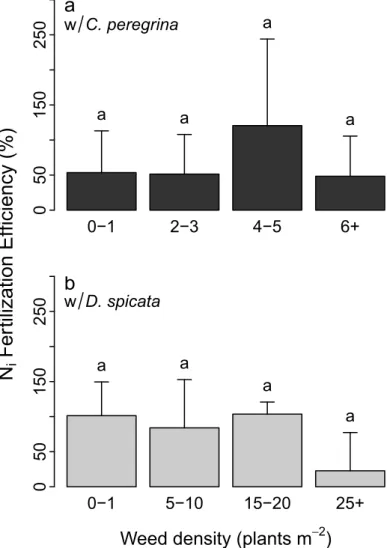
Plots havingD. spicata produced fruit yields that were almost twice that of those having C. peregrina (6.3 vs. 3.2 t ha-1;Table 2). On average, fruit yield was 48% higher in the inorganic N-fertilization plots (6.3± 4.6 t ha-1) than in the organic N-fertilization (4.3± 2.8 t ha-1) and 71% higher than in the control plots (3.7± 2.3 t ha-1). Although not statistically significant, the application of CRW tended to increase fruit yield by 300 and 800 kg ha-1forC. peregrina and D. spicata, respectively, compared to the control plots (Table 2). The efficiency of inorganic N-fertilization (%), i.e. the factor by which N-N-fertilization increased fruit yield, did not differ
significantly betweenC. peregrina and D. spicata plots or between density levels (Fig 2). None-theless, the efficiency of inorganic N-fertilization was: i) 2× higher in D. spicata plots (100%) than inC. peregrina plots (50%) at low weed density levels (D1 and D2); ii) 2× lower in high-density plots (D4) withD. spicata than with C. peregrina; and iii) 4× times lower (25%) in D. spicata plots at high density (>25 plants m-2) than at lower density levels (0–1, 5–10, and 15– 20 plants m-2).
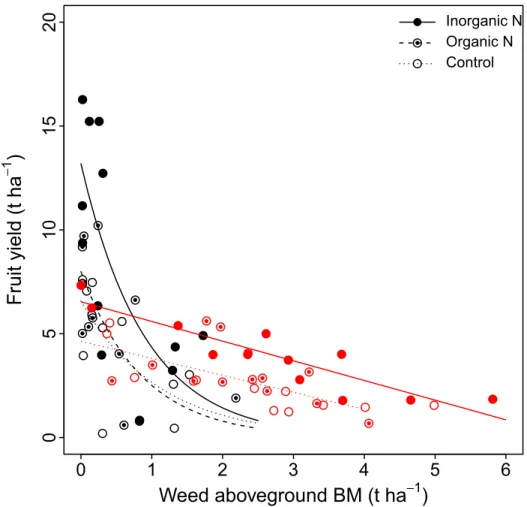
Fruit yield decreased with increasing weed aboveground biomass under all fertilization treatments (Fig 3), illustrating the detrimental effect of weed density on fruit yield (Table 1;S1 Fig). This fruit yield–weed aboveground biomass decrease was linear forC. peregrina plots, whereas it was best described by a decreasing exponential function (y = ae-bx) for theD. spicata plots. The number of fruits produced per hectare was highest in plots havingD. spicata fertil-ized with inorganic N (Table 2). The number of fruits produced per hectare also decreased with increasing weed density (S2 Fig). In contrast, N-fertilization did not affect the average mass of individual berries (Table 1); however, the average mass of individual berries was signif-icantly higher in plots havingD. spicata than in those having C. peregrina (Table 2).
Blueberry and weed vegetative biomass production
The N-fertilization treatments and the companion weed species had a significant effect on the aboveground vegetative biomass of blueberry over the two years of the experiment (Table 1). Blueberry aboveground vegetative biomass was 30–40% higher in the inorganic N-fertilization plots relative to the control plots, regardless of the competing weed species (Table 2). In
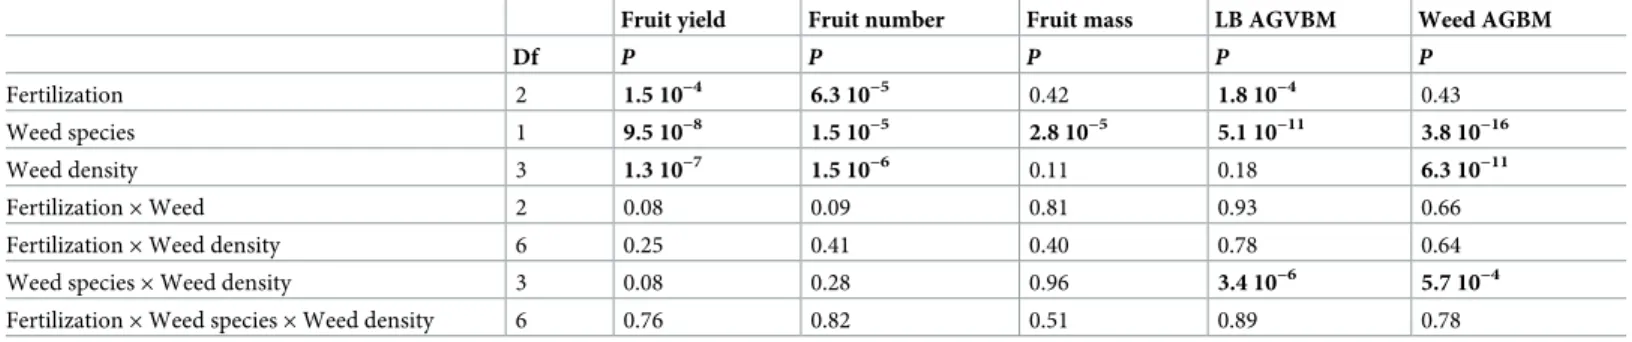
Table 1. Results of the mixed-model analyses for the tested variables of lowbush blueberry. Tested variables are fruit yield (t ha-1), fruit production (number of fruits
ha-1), average individual fruit mass (mg), aboveground vegetative biomass (AGVBM, g m-2) and weed aboveground biomass (AGBM, g m-2). Fertilization treatment, weed species, and weed density were used as fixed effects, and “blocks” was used as a random effect. Significant effects are shown in bold (P<0.05).
Fruit yield Fruit number Fruit mass LB AGVBM Weed AGBM
Df P P P P P
Fertilization 2 1.5 10−4 6.3 10−5 0.42 1.8 10−4 0.43
Weed species 1 9.5 10−8 1.5 10−5 2.8 10−5 5.1 10−11 3.8 10−16
Weed density 3 1.3 10−7 1.5 10−6 0.11 0.18 6.3 10−11
Fertilization× Weed 2 0.08 0.09 0.81 0.93 0.66
Fertilization× Weed density 6 0.25 0.41 0.40 0.78 0.64
Weed species× Weed density 3 0.08 0.28 0.96 3.4 10−6 5.7 10−4
Fertilization× Weed species × Weed density 6 0.76 0.82 0.51 0.89 0.78
https://doi.org/10.1371/journal.pone.0226619.t001
Table 2. Average values (± SD) of the measured variables for blueberry and weeds in plots colonized by C. peregrina and D. spicata subjected to the three fertiliza-tion treatments. Measured variables included lowbush blueberry fruit yield (t ha-1), number of fruits produced (106ha-1), individual fruit mass (mg), aboveground
vegeta-tive biomass (AGVBM; g m-2), fruit yield: aboveground vegetative biomass ratio, and weed aboveground biomass (AGBM; g m-2) under the three N-fertilization
treatments in plots havingC. peregrina or D. spicata as companion weed species. Values not sharing the same letters are significantly different (P <0.05). Roman letters are used to compare N-fertilization treatments, whereas Greek letters are used to compare the two areas of the field (i.e.,C. peregrina area vs. D. spicata area).
C. peregrina area D. spicata area
Inorganic N Organic N Control Mean Inorganic N Organic N Control Mean Fruit yield (t ha-1) 4.0± 1.8 (a) 3.0± 1.4 (b) 2.7± 1.5 (b) 3.2± 1.6 (α) 8.6± 5.4 (a) 5.5± 3.3 (b) 4.7± 2.7 (b) 6.3± 4.2 (β) No. of fruits (106ha-1) 18.6
± 8.9 (a) 12.6± 4.9 (b) 10.9± 4.7 (b) 14.0± 7.1 (α) 32.4± 21.2 (a) 19.0± 10.7 (b) 15.2± 8.7 (b) 22.2± 16.0 (β) Individual fruit mass (mg) 228± 62 (a) 233± 50 (a) 238± 49 (a) 233± 53 (α) 275± 46 (a) 297± 71 (a) 305± 48 (a) 292± 56 (β) AGVBM (g m-2) 392± 102 (a) 331± 64 (ab) 301± 67 (b) 341± 86 (α) 254± 92 (a) 203± 106 (a) 176± 96 (a) 211± 101 (β) Yield: AGVBM ratio 1.1± 0.7 (a) 0.9± 0.4 (a) 0.9± 0.5 (a) 1.0± 0.2 (α) 3.5± 2.1 (a) 3.1± 2.1 (a) 3.0± 1.9 (a) 3.2± 1.0 (β) Weed AGBM (g m-2) 268
± 171 (a) 225± 101 (a) 241± 143 (a) 245± 138 (α) 54± 60 (a) 46± 62 (a) 48± 57 (a) 49± 58 (β)
contrast, N-fertilization did not affect weed biomass (Table 1). Weed biomass was much higher inC. peregrina plots than in D. spicata plots under all N-fertilization treatments (Table 2). The significant interaction between weed species and weed density (Table 1) reflects the decrease in blueberry aboveground vegetative biomass with increasedD. spicata density (Fig 4B), whereas no such trend was observed in plots havingC. peregrina (Fig 4A). The fertili-zation treatments did not significantly affect the blueberry fruit yield: aboveground vegetative biomass ratio. In contrast, this ratio was significantly higher in plots havingD. spicata than those withC. peregrina for all fertilization treatments (Table 2).
Blueberry foliar chemistry
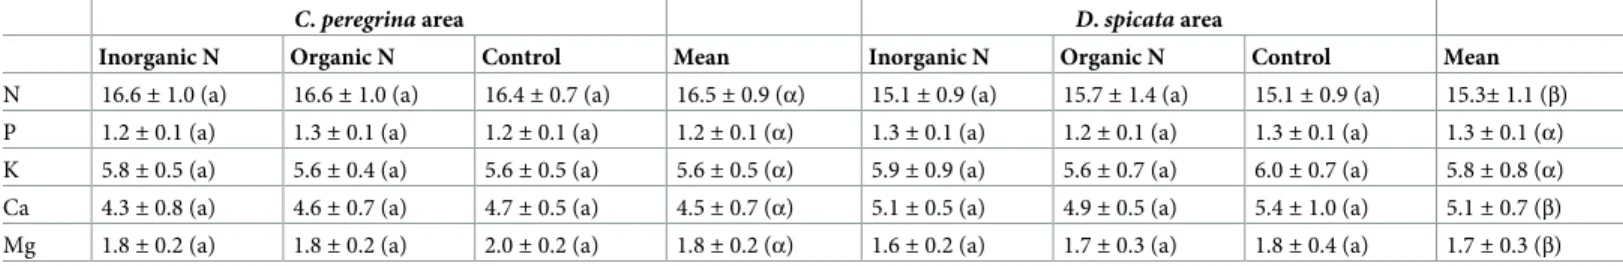
The N-fertilization treatments did not significantly affect blueberry foliar N, P, K, Mg, and Ca concentrations. In contrast, there was a significant difference in N, Mg, and Ca concentrations between the area colonized byC. peregrina and the one colonized by D. spicata (Table 3). On
0−1 2−3 4−5 6+ 0 5 0 1 50 250
a
w C. peregrina a a a aN
iF
e
rt
ilization Efficiency (%)
0−1 5−10 15−20 25+ 0 5 0 1 50 250b
w D. spicata a a a aWeed density (plants m
−2)
Fig 2. Increased fruit yield (%) due to the inorganic N treatment (inorganic N-fertilization efficiency) as a function of weed density. The increase in fruit yield was determined relative to fruit yield in control plots. (a) Inorganic N-fertilization efficiency in plots ofC. peregrina; (b) Inorganic N-fertilization efficiency in plots of D. spicata. Values are mean ± SD (n = 3). Values that share the same letters above the bar plots are not significantly different (P > 0.05).
average, blueberry foliar N and Mg concentrations were higher in plots havingC. peregrina than in those havingD. spicata (16.5 and 15.3 mg g-1, respectively, for N concentrations, and 1.8 and 1.7 mg g-1, respectively, for Mg concentrations). On the contrary, the foliar Ca concen-tration of blueberry was higher in plots havingD. spicata than in those having C. peregrina (5.1 and 4.5 mg g-1, respectively).
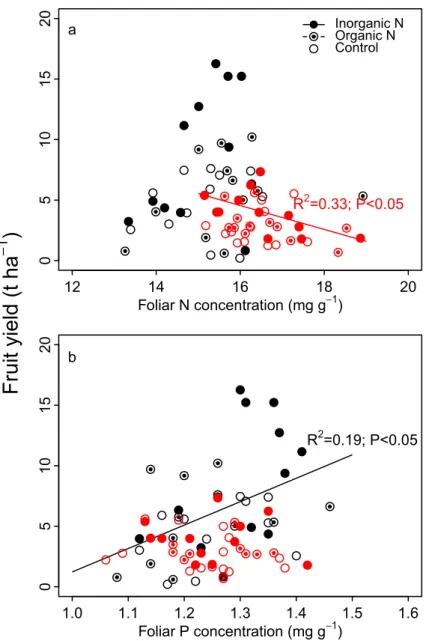
There was a significant negative relationship between blueberry foliar N concentration and fruit yield in plots havingC. peregrina as a companion weed species and an inorganic N-fertili-zation treatment (Fig 5A). No significant relationship was found between these two variables in plots havingD. spicata. There was a positive relationship between fruit yield and foliar P concentration in association withD. spicata for N-fertilization treatments (Fig 5B). We found no such relationship in plots havingC. peregrina.
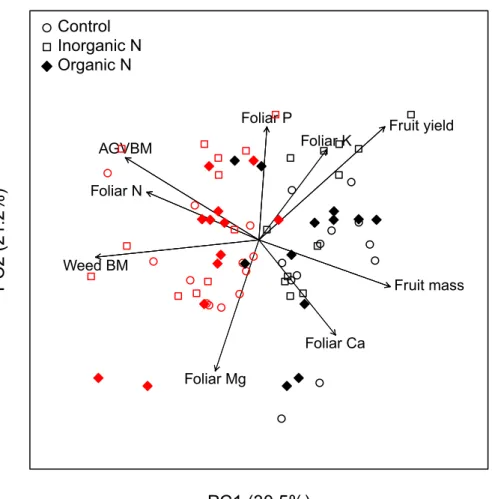
A principal component analysis (PCA) summarizes the influence of fertilization and the presence of weeds on lowbush blueberry (Fig 6). Plots havingC. peregrina (red symbols) or D. spicata (black symbols) were well separated on the first axis (PC1), whereas plots were not sep-arated as a function of the N-fertilization treatment they received. Plots havingC. peregrina
0
1
2
3
4
5
6
0
5
10
15
20
Weed aboveground BM (t ha
−1)
Fr
uit yield (t ha
− 1)
Inorganic N Organic N ControlFig 3. Relationship between lowbush blueberry fruit yield (t ha-1) and the aboveground biomass of weeds (t ha-1). Values are shown forC. peregrina (red symbols) and D. spicata (black symbols) under the three fertilization treatments (inorganic N, organic N, and control). Curves show significant relationships (P < 0.05). C. peregrina plots–Inorganic N: y = 6.53–0.94x (R2= 0.82); Control: y = 4.63–0.82x (
R2= 0.63).
D. spicata plots–Inorganic N: y = 13.18e1.11x(
R2=
0.51); Organic N: y = 7.99e1.16x(R2= 0.51); Control: y = 6.57e0.90x(R2= 0.45).
0−1 2−3 4−5 6+ 0 100 300 500 700 w C. peregrina
Blueberr
y
A
G
VBM (g m
− 2)
a
ab ab a ab ab ab ab ab a b ab b 0−1 5−10 15−20 25+ 0 1 00 300 500 700b
w D. spicata a ab ab ab ab ab ab ab ab ab b bWeed density (plants m
−2)
Inorganic N Organic N Control
Fig 4. Lowbush blueberry aboveground vegetative biomass (AGVBM) at the end of the production cycle (g m-2).
AGVBM values (mean± SD) are shown for the three fertilization treatments (inorganic fertilization, organic N-fertilization, and control plots) and the four levels of weed density. (a) Lowbush blueberry AGVBM in plots ofC. peregrina; (b) lowbush blueberry AGVBM in plots of D. spicata; bars of AGVBM values not sharing the same letters are significantly different (P < 0.05).
https://doi.org/10.1371/journal.pone.0226619.g004
Table 3. Foliar chemistry of lowbush blueberry. Concentrations of N, P, K, Ca, and Mg (mg g-1) in plots having
C. peregrina or D. spicata as companion species of low-bush blueberry. Values are mean± SD. Values not sharing the same letters are significantly different (P < 0.05). Roman letters are used to compare N-fertilization treat-ments, whereas Greek letters are used to compare the two areas of the field (i.e.,C. peregrina area vs. D. spicata area).
C. peregrina area D. spicata area
Inorganic N Organic N Control Mean Inorganic N Organic N Control Mean N 16.6± 1.0 (a) 16.6± 1.0 (a) 16.4± 0.7 (a) 16.5± 0.9 (α) 15.1± 0.9 (a) 15.7± 1.4 (a) 15.1± 0.9 (a) 15.3± 1.1 (β) P 1.2± 0.1 (a) 1.3± 0.1 (a) 1.2± 0.1 (a) 1.2± 0.1 (α) 1.3± 0.1 (a) 1.2± 0.1 (a) 1.3± 0.1 (a) 1.3± 0.1 (α) K 5.8± 0.5 (a) 5.6± 0.4 (a) 5.6± 0.5 (a) 5.6± 0.5 (α) 5.9± 0.9 (a) 5.6± 0.7 (a) 6.0± 0.7 (a) 5.8± 0.8 (α) Ca 4.3± 0.8 (a) 4.6± 0.7 (a) 4.7± 0.5 (a) 4.5± 0.7 (α) 5.1± 0.5 (a) 4.9± 0.5 (a) 5.4± 1.0 (a) 5.1± 0.7 (β) Mg 1.8± 0.2 (a) 1.8± 0.2 (a) 2.0± 0.2 (a) 1.8± 0.2 (α) 1.6± 0.2 (a) 1.7± 0.3 (a) 1.8± 0.4 (a) 1.7± 0.3 (β)
(red symbols) were associated with a higher weed aboveground biomass and a higher blue-berry aboveground vegetative biomass (AGVBM) as well as higher foliar N concentrations. By contrast, plots withD. spicata (black symbols) were associated with higher blueberry fruit yields, foliar Ca concentration, and individual fruit mass.
Litter decomposition
None of the studied variables (N-fertilization treatments, weed species, and weed density) affected the measured litter decomposition variables, namely total mass, C and N losses
12 14 16 18 20 0 5 10 15 20 Foliar N concentration (mg g−1)
Fr
uit yield (t ha
− 1)
a R2=0.33; P<0.05 Inorganic N Organic N Control 1.0 1.1 1.2 1.3 1.4 1.5 1.6 0 5 10 15 20 Foliar P concentration (mg g−1) b R2=0.19; P<0.05Fig 5. Relationships between lowbush blueberry foliar chemistry and fruit yield (t ha-1). (a) Relationship between
N concentrations (mg g-1) and fruit yield; (b) Relationship between P concentrations (mg g-1) and fruit yield. Results are shown for plots ofC. peregrina (red symbols) and D. spicata (black symbols) subjected to the three fertilization treatments (inorganic N, organic N, and control).
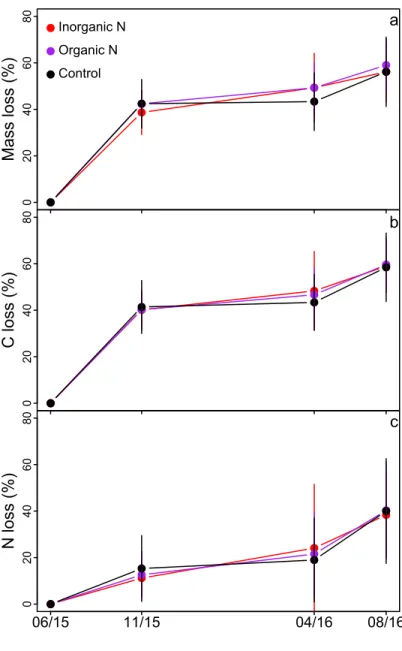
(ANOVA; data not shown). Litter mass and C content decreased by 40%, and N loss by 15% during the first 114 days of incubation, between June and November 2015 (Fig 7). Mass, C, and N losses were not significant during the following winter (from December to April). Litter mass, C, and N content decreased by an additional 10–15% from May to August 2016 (Fig 7).
Discussion
Effect of N-fertilization on plant biomass production and foliar chemistry
Most plants species, especially in cold ecosystems, can fulfill a portion of their N demand by taking up small organic molecules, e.g., amino acids and proteins, from the soil [8,29–33]. Eri-caceous species are particularly efficient in taking up N from recalcitrant soil organic matter [10,34,35] due to their ericoid mycorrhizal associations [36–38]. We therefore expected the organic N treatment of CRW to have a positive effect on lowbush blueberry biomass produc-tion as reported in a recent review [12]. Although slight increases were observed, the organic N-fertilization treatment did not significantly increase blueberry aboveground vegetative bio-mass production or fruit yield relative to the unfertilized controls. This lack of effect did notPC1 (30.5%)
PC2 (21.2%)
AGVBM Weed BM Fruit yield Fruit mass Foliar N Foliar P Foliar K Foliar Ca Foliar Mg Control Inorganic N Organic NFig 6. Principal component analysis ofC. peregrina and D. spicata plots. C. peregrina (red symbols) and D. spicata (black symbols) are presented with the variables of blueberry aboveground vegetative biomass (AGVBM; t ha-1), fruit yield (t ha-1), individual fruit mass (mg), weed aboveground biomass (Weed BM; t ha-1), and foliar concentrations of
N, P, K, Ca, and Mg (mg g-1).
result from competition for N with weed species as the weeds’ biomass did not increase with the organic N-fertilization treatment either. As CRW not only provides nutrients but also improves soil conditions in the long term—moisture, structure, biological activity, etc.—the absence of an effect may be due to the short duration of the experiment. A beneficial effect may require a number of years of application before appearing. That organic N-fertilization did not stimulateD. spicata biomass agreed with our expectations as Poaceae species rely mainly upon inorganic N [39]. A previous15N-labelling study has shown thatD. spicata specif-ically relies heavily on inorganic N fertilizer for producing its aboveground biomass [7]. The absence of an effect for the organic N fertilizer on the three plant species may have resulted
0 204 06 08 0 Mass loss (%) a Inorganic N Organic N Control 0 204 06 08 0 C loss (%) b 0 204 06 08 0 N loss (%) 06/15 11/15 04/16 08/16 c
Fig 7. Impact of the fertilization treatments on litter decomposition. (a) Mass loss (%), (b) C loss (%), and (c) N loss (%) from the litter 114, 330, and 420 days after the litter bags were buried in the three experimental plots (inorganic N, organic N, and control plots).
from the specific organic fertilizer used. First, CRW has a high C:N ratio (61;S1 Table), which can decrease inorganic N availability by stimulating N immobilization the year following CRW application [12,40,41]. Second, the ~2 cm thick layer of CRW (10 kg of RCW per m2) may have impeded vegetative growth by changing soil physicochemical conditions, e.g., mois-ture and temperamois-ture, through its mulching effect. The latter explanation seems unlikely, how-ever, as adding CRW compost did not modify soil litter decomposition in our study.
The inorganic N-fertilization did not enhance weed biomass production. Although it was not entirely surprising forC. peregrina, which can use atmospheric N through an actinorhizal association, the lack of enhanced biomass production was more surprising forD. spicata, which is very effective in taking up inorganic N derived from fertilizer due to its dense and superficial root system [7]. By contrast, the inorganic N-fertilization treatment significantly enhanced blue-berry fruit yield and aboveground vegetative biomass, regardless of the associated weed species. Estimations of aboveground vegetative biomass using the «point intercept method» [42] showed that the vegetative growth was particularly stimulated the year following fertilizer appli-cation (S3 Fig). This result agrees with several studies that report increased blueberry nutritional status, growth [6,43–46], and fruit production after repeated additions of inorganic N [6,46– 48]. As well, the inorganic N-fertilization treatment enhanced fruit yield more than above-ground vegetative biomass production, resulting in a 15–20% higher fruit yield to aboveabove-ground vegetative biomass ratio in the inorganic N plots relative to the organic N and control plots (Table 2). The positive effect of the inorganic N treatment on fruit yield resulted mainly from an increase in the number of berries produced, supporting results from a previous study [49]. The fertilization treatment had no significant effect on the mass of individual berries, showing that berry mass was not limited by N availability. Much of the observed increase in fruit yield likely resulted from an increase in the number of flowers per surface area as reported in another study [46]. Our observations may be, however, also related to decreased fruit abortion. Penney et al. [49] observed that the number of living flower buds did not differ between the fertilized and unfertilized plots. They speculated that the increased number of berries following N-fertili-zation stemmed from lower fruit abortion. More research is required to clarify this point.
AsD. spicata relies heavily on inorganic N and the presence of this species can be detrimen-tal for blueberry vegetative biomass production, especially at high-density levels [7], we expected a lower inorganic-N fertilizer efficiency inD. spicata than in C. peregrina plots. This hypothesis was not supported by our data, although this efficiency tended to be lower at high D. spicata density. Whereas the inorganic N-fertilization treatment increased fruit yield by ca. 100% in plots having density levels lower than 15–20 plants m-2, the increase was only 20% in plots with >25 plants m-2(Fig 2B). Therefore, inorganic N-fertilization may not be a good strategy for farmers whenD. spicata density exceeds 25 plants m-2
.
Contrary to other studies, N-fertilization had no significant effect on foliar N concentra-tions of blueberry. This absence of increased N foliar concentration may have resulted from a dilution effect because blueberry aboveground biomass production increased following inor-ganic-N-fertilization. A large fraction of N derived from the fertilizer may also have been allo-cated to fruit production rather than to the vegetative parts. Overall, the range of foliar N concentration reported here (13.3–18.9 mg g-1) is slightly lower than the ones reported for other fertilized commercial fields [50–53]. This likely results from the comparatively young age of our study field (cultivated since 2005) and the moderate use of fertilizers.
Impact of weeds on blueberry biomass production and foliar N concentration
The PCA (Fig 6) highlighted the stronger influence of the companion weed species than the type of fertilization treatment on blueberry variables. The strong separation of plots colonizedbyC. peregrina and D. spicata reflected their respective and distinct impacts on blueberry crops. Although both weed species affected blueberry aboveground vegetative biomass and fruit yield, the weed species differed in their impact on blueberry production.D. spicata had a greater negative impact on vegetative biomass than on fruit yield. Conversely,C. peregrina negatively impacted fruit yield more than vegetative biomass. The aboveground vegetative bio-mass production of blueberry was 40% lower in plots colonized byD. spicata than in those col-onized byC. peregrina, whereas blueberry fruit production in plots having C. peregrina was half that of plots havingD. spicata, regardless of the N-fertilization treatment (Table 2). This pattern indicates a decoupling between vegetative and fruit biomass as shown by the lack of relationship between these two variables regardless of the fertilization treatment or weed spe-cies (r = -0.10; P = 0.38). Higher vegetative growth in plots having C. peregrina has been shown to result from the ability ofC. peregrina to derive N from the atmosphere, especially when present at high density, thus alleviating the competition for soil N acquisition [7]. Differences in fruit yield between plots colonized byC. peregrina and D. spicata was more driven by the number of fruits per surface area than by the mass of individual berries. The number of fruits per hectare in plots havingD. spicata was ca. 2× that of C. peregrina plots (22.2 106vs. 14.0 106 ha-1, respectively), whereas the mass of individual berries was only 25% higher inD. spicata plots (292± 56 mg vs. 233 ± 53 mg, respectively). The reasons for such a difference are unclear. The predominance of one of the two weed species may have impacted blueberry flower duction, pollination efficiency, fruit abortion or any other mechanisms involved in fruit pro-duction. For instance,C. peregrina, as other species in the Myricaceae family, produces strong odors, insect-repellant secondary substances [54,55], and cytotoxic molecules [56] that can repulse insect pollinators, and could thus decrease flower visitation rates by pollinators and pollination success in nearby blueberry patches. Previous studies and personal observations also suggest thatC. peregrina may reduce light availability in blueberry patches, as C. peregrina grows taller than both blueberry andD. spicata. Although lowbush blueberry plants can persist under a canopy, at least 50% full sunlight is required for flower bud formation and fruiting [57,58]. Shade from taller weeds can reduce fruit yields when sunlight is reduced below 80% [5,59]. Further studies are necessary to address these possibilities. However, our data revealed an “area effect” on fruit yield. Indeed, fruit yields were higher inD. spicata plots even in low weed density plots (D1 level), in which weed species were almost absent (weed aboveground biomass null or close to zero;Fig 3). This occurred although the commercial field is very homogeneous and the two selected areas (the one colonized byC. peregrina and the other by D. spicata) are situated only ca. 2 km away from each other. In addition, available soil analyses for the site show minimal differences between the two areas. A “population effect” may be responsible for the difference between the two areas as several studies report a large variability in fruit yields among clones and species as well as a large influence of the degree of cross-polli-nation and self-fertility in blueberry species [60–62]. Another hypothesis is an excessive amount of foliar N in plots colonized byC. peregrina (Table 3), which can be detrimental to fruit production in blueberry [50]. This hypothesis is supported by the negative relationship between blueberry foliar N concentrations and fruit production in the plots havingC. pere-grina (Fig 5). This mechanism does not contradict the positive effect of inorganic N on fruit production inC. peregrina plots because inorganic N-fertilization did not significantly increase foliar N concentration (Table 3).
Litter decomposition rate
The direction and magnitude of the effect of N-fertilization on litter decomposition vary between studies as this effect depends on several interacting factors, such as the rate and type
of fertilizer applied, litter quality, moisture, and the rate of N deposition. A recent meta-analysis showed that litter decay response to N addition ranged from 38% inhibition to 64% stimulation depending on experimental conditions [63]. In studies where N inputs were < 75 kg N ha-1, there was a slight but significant decrease in litter decomposition rates (-5%). When N inputs were 75–125 kg N ha-1, there was a significant stimulation of litter decomposition (+17%). In our experiment, N addition (45 kg N ha-1)—either in an inorganic or organic form—did not significantly alter litter decomposition variables, i.e., loss of mass, C, and N. At the end of the 420-day incubation period, the litter had lost ~55% of its initial mass and C content and ~40% of its initial N content. Most litter mass and C loss (~40%) occurred during the first growing season, and the litter did not lose a significant fraction of mass, C, or N during the following winter (Fig 7), most likely because of the low winter temperatures that impeded soil microbial activity. Losses of litter mass and C in the second season were less than the first growing season as most of the labile fraction of the litter decomposed in the first growing season, making the lit-ter more recalcitrant the second year [64].
Conclusion
In contrast with our initial hypothesis, composted CRW did not significantly improve lowbush blueberry fruit yield nor vegetative biomass and foliar N concentration, suggesting that this type of organic fertilizer did not release a significant amount of readily available N in the time frame of the study. In contrast, the addition of inorganic N enhanced fruit yield by ~70% relative to the control plots. The beneficial effect of this fertilization treatment depended on the compan-ion weed species and its density, revealing complex competitcompan-ion mechanisms likely driven by weed functional traits and local soil conditions. Although blueberry fruit yield was on average twice higher in plots havingD. spicata than in plots having C. peregrina, blueberry growth and fruit yield as well as fertilization efficiency were more strongly impacted by increasingD. spicata thanC. peregrina density. As shown in a previous study, this likely resulted from the ability of C. peregrina to derive some of its N from the atmosphere as its density increased [7]. A close analy-sis of the data also revealed that, in addition to weed competition, unknown local site conditions contributed to the variability in fruit yield at the field scale. Overall, the present study reveals the distinct interactions between lowbush blueberry and weed species and confirms the necessity of weed control to improve fruit yields and the efficiency of inorganic N-fertilization. We recom-mend keepingD. spicata density as low as possible to maximize fruit yields and under 25 plants m-2to optimize inorganic N-fertilization efficiency.
Supporting information
S1 Table. Results of chemical analyses performed on the chipped ramial wood (CRW) used as organic fertilizer.
(DOCX)
S1 Fig. Lowbush blueberry fruit yield (t ha-1) as a function of the N-fertilization treatment and weed density. (a) Values in sweet fern plots; (b) Values in poverty oat grass plots. Values
(mean± SD) not sharing the same letter are significantly different (P < 0.05). Seematerial and methodsfor details of the statistical analyses.
(DOCX)
S2 Fig. Lowbush blueberry fruit yield (t ha-1) and number of fruits produced (106ha-1). (a–
c) Fruit yield as a function of companion weed species, N-fertilization treatment, and weed density, respectively. (d–f) Number of fruits produced as a function of companion weed spe-cies, N-fertilization treatment, and weed density, respectively. Values (mean± SD) not sharing
the same letter are significantly different (P < 0.05). Seematerial and methodsfor details of the statistical analyses.
(DOCX)
S3 Fig. Aboveground vegetative biomass (AGVBM) (g m-2) estimated using the point intercept method. AGVBM values (mean± SD) are shown for the three N-fertilization treat-ments over the two years of the production cycle. Asterisks indicate significant fertilization effects. (a) Lowbush blueberry; (b) sweet fern; (c) poverty oat grass (c).
(DOCX) S4 Fig. (JPG) S1 Data. (CSV) S2 Data. (CSV)
Acknowledgments
The authors thank the Fonds de recherche axe´ sur l’agriculture nordique (FRAN-02), the Fonds de recherche du Que´bec–Nature et technologies (FRQNT), and the Fonds de de´veloppement de l’Universite´ du Que´becà Chicoutimi (FUQAC) for their financial support. The authors thank M. Moreau and La Bleuetière Coope´rative de Saint-Eugène for providing access to their sites and infrastructure. Thanks also to Club Conseil Bleuet employees, Andre´anne Simard, Catherine Tremblay, and Jean-Guy Girard for their laboratory and technical assistance.
Author Contributions
Conceptualization: Charles Marty, Jose´e-Anne Le´vesque, Robert L. Bradley, Jean Lafond,
Maxime C. Pare´.
Data curation: Charles Marty, Jose´e-Anne Le´vesque. Formal analysis: Charles Marty, Maxime C. Pare´. Funding acquisition: Robert L. Bradley, Maxime C. Pare´. Investigation: Robert L. Bradley, Maxime C. Pare´.
Methodology: Jose´e-Anne Le´vesque, Robert L. Bradley, Jean Lafond, Maxime C. Pare´. Project administration: Robert L. Bradley, Maxime C. Pare´.
Resources: Robert L. Bradley, Jean Lafond, Maxime C. Pare´. Supervision: Robert L. Bradley, Maxime C. Pare´.
Validation: Charles Marty, Robert L. Bradley, Jean Lafond, Maxime C. Pare´. Writing – original draft: Charles Marty.
Writing – review & editing: Charles Marty, Robert L. Bradley, Jean Lafond, Maxime C. Pare´.
References
1. Hall IV, Aalders LE, Nickerson NL, Vander Kloet SP. The biological flora of Canada. 1. Vaccinium angu-stifolium Ait., Sweet lowbush blueberry. Can Field-Naturalist. 1979; 93:415–27.
2. MAPAQ. Monographie de l’industrie du bleuet sauvage au Que´ bec [Internet]. Que´bec; 2016. Available from:https://www.mapaq.gouv.qc.ca/fr/Publications/Monographiebleuet.pdf
3. Yarborough DE. Establishment and Management of the Cultivated Lowbush Blueberry (Vaccinium angustifolium). Int J Fruit Sci. 2012; 12:14–22.
4. Lafond J. Fractionnement de la fertilisation azote´e dans la production du bleuet nain sauvage. Can J Soil Sci [Internet]. 2010; 90:189–99.
5. Jensen KIN, Yarborough DE. An overview of weed management in the wild lowbush blueberry—past and present. Small Fruits Rev [Internet]. 2004; 3:229–55.
6. Penney BG, McRae KB. Herbicidal weed control and crop-year NPK fertilization improves lowbush blueberry (Vaccinium angustifolium Ait.) production. Can J Plant Sci. 2000; 80:351–61.
7. Marty C, Le´vesque J-A, Bradley RL, Lafond J, Pare´ MC. Contrasting impacts of two weed species on lowbush blueberry fertilizer nitrogen uptake in a commercial field. PLoS One. 2019; 14:e0215253.
https://doi.org/10.1371/journal.pone.0215253PMID:30978227
8. Na¨sholm T, Ekblad A, Nordin A, Giesler R, Ho¨ gberg M, Ho¨gberg P. Boreal forest plants take up organic nitrogen. Nature. 1998; 392:914–6.
9. Persson J, Ho¨gberg P, Ekblad A, Ho¨gberg MN, Nordgren A, Na¨sholm T. Nitrogen acquisition from inor-ganic and orinor-ganic sources by boreal forest plants in the field. Oecologia. 2003; 137:252–7.https://doi. org/10.1007/s00442-003-1334-0PMID:12883986
10. Joanisse GD, Bradley RL, Preston CM, Bending GD. Sequestration of soil nitrogen as tannin–protein complexes may improve the competitive ability of sheep laurel (Kalmia). New Phytol. 2009; 181:187– 98.https://doi.org/10.1111/j.1469-8137.2008.02622.xPMID:18811620
11. Read DJ. The structure and function of the ericoïd mycorrhizal root. Ann Bot. 1996; 77:365–74.
12. Caspersen S, Svensson B, Håkansson T, Winter C, Khalil S, Asp H. Blueberry—Soil interactions from an organic perspective. Sci Hortic (Amsterdam). Elsevier B.V.; 2016; 208:78–91.
13. Gagnon B, Simard R, Lalande R, Lafond J. Improvement of soil properties and fruit yield of native low-bush blueberry by papermill sludge addition. Can J Soil Sci [Internet]. 2003; 83:1–10.
14. Lafond J. Application of Paper Mill Biosolids, Wood Ash and Ground Bark on Wild Lowbush Blueberry Production. Small Fruits Rev [Internet]. Taylor & Francis; 2004; 3:3–10.
15. Warman PR. The effects of pruning, fertilizers, and organic amendments on lowbush blueberry produc-tion. Plant Soil [Internet]. 1987; 101:67–72.
16. Warman PR, Burnham JC, Eaton LJ. Effects of repeated applications of municipal solid waste compost and fertilizers to three lowbush blueberry fields. Sci Hortic (Amsterdam) [Internet]. Elsevier; 2009 [cited 2019 Jan 22]; 122:393–8.
17. Lemieux G, Germain D. Ramial chipped wood: the clue to a sustainable fertile soil [Internet]. Que´bec; 2000.
18. Tremblay J, Beauchamp CJ. Fractionnement de la fertilisation azote´ e d’appointàla suite de l’incorpo-ration au sol de bois rame´aux fragmente´ s: modifications de certaines proprie´te´s biologiques et chimi-ques d’un sol cultive´ en pomme de terre. Can J Soil Sci. 1998; 78:275–82.
19. Beauchemin S, N’Dayegamiye A, Laverdière MR. Effets d’apport d’amendements ligneux frais et humi-fie´s sur la production de pomme de terre et sur la disponibilite´ de l’azote en sol sableux. Can J Soil Sci. 1990; 70:555–64.
20. Darbyshire SJ, Cayouette J. The biology of Canadian weeds. 92. Danthonia spicata (L.) Beauv. in Roem. & Schult. Can J Plant Sci. 1989; 69:1217–33.
21. Hurd TM, Schwintzer CR. Formation of cluster roots and mycorrhizal status of Comptonia peregrina and Myrica pensylvanica in Maine, USA. Physiol Plant. 1997; 99:680–9.
22. Hall I V., Aalders LE, Everett FC. The biology of Canadian weeds. 16. Comptonia peregrina (L.) Coult. Can J Plant Sci. 1976; 56:147–56.
23. Raymond R, Mailloux A, Dube´ A. Pe´dologie de la re´gion du Lac-Saint-Jean. La Pocatière, Que´ bec; 1965.
24. He´bert M, Chantigny M, N’Dayegamiye A, Coˆte´ C. Les engrais de ferme et les matières re´siduelles ferti-lisantes organique. Guid re´fe´rence en Fertil. Que´ bec, Que´bec, Canada: Centre de re´fe´rence en agri-culture et agroalimentaire du Que´bec; 2010. p. 289–344.
25. Isaac RA, Ohnson WC. Determination of total nitrogen in plant tissue, using a block digestor. J Assoc Off Anal Chem. 1976; 59:98–100.
26. Dray S, Dufour AB. The ade4 package: implementing the duality diagram for ecologists. J Stat Softw. 2007; 22:1–20.
27. Kuznetsova A, Brockhoff PB, Christensen RHB. lmerTest Package: Tests in Linear Mixed Effects Mod-els. J Stat Softw. 2017; 82:1–26.
28. Lenth R V. Least-Squares Means: The R Package lsmeans. J Stat Softw. 2016; 69:1–33.
29. Chapin FS, Moilanen L, Kielland K. Preferential use of organic nitrogen for growth by a non-myccorhizal arctic sedge. Nature. 1993; 361:150–3.
30. Kielland K. Amino-acid absorption by arctic plants: implications for plant nutrition and nitrogen cycling. Ecology. 1994; 75:2373–83.
31. Jones DL, Kielland K. Soil amino acid turnover dominates the nitrogen flux in permafrost-dominated taiga forest soils. Soil Biol Biochem [Internet]. Pergamon; 2002 [cited 2019 Jan 30]; 34:209–19.
32. Lipson DA, Monson RK. Plant-microbe competition for soil amino-acids in the alpine tundra: effects of freeze-thaw and dry-rewet events. Oecologia. 1998; 113:406–14.https://doi.org/10.1007/
s004420050393PMID:28307826
33. Persson J, Na¨sholm T. Amino acid uptake: a widespread ability among boreal forest plants. Ecol Lett [Internet]. 2001; 4:434–8.
34. Nadelhoffer K, Shaver G, Fry B, Giblin A, Johnson L, McKane R. 15N natural abundances and N use by tundra plants. Oecologia [Internet]. 1996; 107:386–94.https://doi.org/10.1007/BF00328456PMID:
28307268
35. Nasholm T, Persson J. Plant acquisition of organic nitrogen in boreal forests. Physiol Plant [Internet]. 2001; 111:419–26.https://doi.org/10.1034/j.1399-3054.2001.1110401.xPMID:11299006
36. Read DJ. Mycorrhizas in ecosystems. Experientia. 1991; 47:376–91.
37. Read DJ. The biology of mycorrhiza in the Ericales. Can J Bot. 1983; 61:985–1004.
38. Read DJ, Leake JR, Perez-Moreno J. Mycorrhizal fungi as drivers of ecosystem processes in heathland and boreal forest biomes. Can J Bot Can Bot. 2004; 82:1243–63.
39. Persson J, Ho¨gberg P, Ekblad A, Ho¨gberg MN, Nordgren A, Na¨sholm T. Nitrogen acquisition from inor-ganic and orinor-ganic sources by boreal forest plants in the field. Oecologia. 2003; 137:252–7.https://doi. org/10.1007/s00442-003-1334-0PMID:12883986
40. Beauchemin S, Laverdière MR, N’dayegamiye A. Effets d’amendements ligneux sur la disponibilite´ d’azote dans un sol sableux cultive´ en pomme de terre. Can J Soil Sci [Internet]. 1992; 72:89–95.
41. Retamales JB, Hancock JF. Blueberries. CAB Intern. Crop Prod. Sci. Hortic. Ser. Wallingford, UK; 2012.
42. Le´vesque J, Bradley RL, Bellemare M, Lafond J, Pare´ MC. Predicting weed and lowbush blueberry bio-mass using the point intercept method. Can J Plant Sci. 2018; 4:1–4.
43. Percival D, Sanderson K. Main and Interactive Effects of Vegetative-Year Applications of Nitrogen, Phosphorus, and Potassium Fertilizers on the Wild Blueberry. Small Fruits Rev [Internet]. Taylor & Francis; 2004; 3:105–21.
44. Yarborough DE. Factors contributing to the increase in productivity in the wild blueberry industry. Small Fruits Rev. 2004; 3:33–43.
45. Eaton L, Sanderson K, Fillmore S. Nova Scotia wild Blueberry soil and leaf nutrient ranges. Int J Fruit Sci. 2009; 9:46–53.
46. Lafond J, Ziadi N. Fertilisation azote´e et phosphate´e dans la production du bleuet nain sauvage au Que´-bec. Can J Plant Sci [Internet]. 2011; 91:535–44.
47. Maqbool R, Percival D, Zaman Q, Astatkie T, Adl S, Buszard D. Leaf nutrients ranges and berry yield optimization in response to soil-applied nitrogen, phosphorus and potassium in wild blueberry (Vacci-nium angustifolium Ait.). Eur J Hortic Sci. 2017; 82:166–79.
48. Lafond J, Ziadi N. Biodisponibilite´ de l’azote et du phosphore dans les sols de bleuetières du Que´ bec. Can J Soil Sci [Internet]. 2013; 93:33–44.
49. Penney BG, Mcrae KB, Bishop GA. Second-crop N-fertilization improves lowbush blueberry (Vaccinium angustifolium Ait.) production. Can J Plant Sci. 2003; 83:149–55.
50. Lafond J. Optimum leaf nutrient concentrations of wild lowbush blueberry in Quebec. Can J Plant Sci [Internet]. 2009; 89:341–7.
51. Lockhart CL, Langille WM. The mineral content of lowbush blueberry. Can Plant Dis Surv. 1962; 42:124–8.
52. Townsend LR, Hall IV. Trends in nutrient levels of lowbush blueberry leaves during four consecutive years of sampling. Nat Can. 1970; 97:416–66.
53. Trevett MF. A second approximation of leaf analysis standards for lowbush blueberries. Maine Agric Exp Stn Res Life Sci. 1972; 19:15–16.
54. Bentley MD, Leonard DE, Leach S, Reynolds E, Stoddard W, Tomkinson B, et al. Effects of some natu-rally occuring chemicals and extracts of non-host plants on feeding by spruce budworm larvae (Choris-toneura fumiferana). Life Sci Agric Exp Stn Tech Bull. 1982; 107.
55. Simpson MJA, Macintosh DF, Cloughley JB, Stuart AE. Past, present and future utilisation of Myrica gale (Myricaceae). Econ Bot. 1996; 50:122.
56. Sylvestre M, Pichette A, Lavoie S, Longtin A, Legault J. Composition and cytotoxic activity of the leaf essential oil of Comptonia peregrina (L.) Coulter. Phyther Res. 2007; 21:536–40.
57. Hall IV. Floristic changes following the cutting and burning of a woodlot for blueberry production. Can J Agr Sci. 1955; 35:142–52.
58. Hall IV, Forsythe FR, Aalders LE, Jackson LP. Physiology of the lowbush blueberry. Econ Bot. 1971; 26:68–73.
59. Chandler FB, Mason IC. Blueberry weeds in Maine and their control. Bul. 443. Maine Agr. Expt. Sta., Orono, ME. 1946.
60. Bell DJ, Rowland LJ, Stommel J, Drummond FA. Yield variation among clones of lowbush blueberry as a function of genetic similarity and self-compatibility. J Am Soc Hortic Sci. 2010; 135:259–70.
61. Bell DJ, Rowland LJ, Zhang D, Drummond FA. The spatial genetic structure of lowbush blueberry, Vac-cinium angustifolium, in four fields in Maine. Botany. 2009; 87:932–946.
62. Hancock JF, Lyrene P, Finn CE, Vorsa N, Lobos GA. Blueberries and cranberries. In: Hancock JF, edi-tor. Temp fruit Crop Breed Germplasm to genomics. Springer Science & Business Media; 2008.
63. Knorr AM, Frey SD, Curtis PS. Nitrogen additions and litter decomposition: A meta-analysis. Ecology. 2005; 86:3252–7.
64. Melillo JM, Aber JD, Muratore J. Nitrogen and lignin control of hardwood leaf litter decomposition dynamics. Ecology. 1982; 63:621–6.