Science Arts & Métiers (SAM)
is an open access repository that collects the work of Arts et Métiers Institute of
Technology researchers and makes it freely available over the web where possible.
This is an author-deposited version published in: https://sam.ensam.eu Handle ID: .http://hdl.handle.net/10985/10869
To cite this version :
Adrien VAN GORP, Maxence BIGERELLE, Alain GRELLIER, Alain IOST, Denis NAJJAR - A multi-scale approach of roughness measurements: Evaluation of the relevant scale - Materials Science and Engineering: C - Vol. 27, p.1434-1438 - 2007
Any correspondence concerning this service should be sent to the repository Administrator : archiveouverte@ensam.eu
A multi-scale approach of roughness measurements:
Evaluation of the relevant scale
A. Van Gorp
a,b,⁎
, M. Bigerelle
b, A. Grellier
c, A. Iost
a, D. Najjar
aa
Equipe Caractérisation et Propriétés des Périsurfaces, LMPGM, CNRS UMR 8517, ENSAM, 8, Boulevard Louis XIV, 59046 LILLE CEDEX, France
b
Laboratoire Roberval, CNRS FRE 2833, UTC Centre de Royallieu, BP 2059 Compiegne, France
c
Aubert and Duval-Groupe Recherche et Développement-63770 Les Ancizes, France
Abstract
This paper proposes a new multi-scale measurement approach performed to compare the surface roughness and the visual aspect of polished surfaces. In this investigation, five specimens of glass moulds presenting different visual aspects are considered. All roughness profiles assessed by tactile profilometry were rectified by a first degree polynomial fitting, and current roughness parameters were calculated with respect to the evaluation length among which they are estimated. A variance analysis was then performed to discriminate each roughness parameter and each evaluation length with regard to a correlation with the visual aspect. Although the average roughness amplitude is about 100 nm, the results show that the optimal correlation with the visual aspect is obtained for a 400 μm evaluation length. Moreover, the multi-scale method allows to confirm results already found in the bibliography about the high wavelengths origin of “orange peel” aspect. This application allowed us to conclude on the advantages and the limits of the implemented method.
Keywords: Roughness measurement; Multi-scale analysis; Variance analysis
1. Introduction
One of the main problems is the characterisation of surfaces aspect, sometimes performed only by means of qualitative methods[1]. In particular, in glass industry, the quality criteria impose a good-quality visual aspect of manufactured products
[2,3], which requires for the mould to have a high-quality visual aspect too. The problem is then the following:“How to evaluate with a quantitative criterion the quality of mould surfaces?” To answer this question, the roughness of these moulds will be studied with regard to their visual aspect. Two ways are assessed: firstly, a“conventional” way used in Ref.[4]and based on the calculation of 27 current roughness parameters, and secondly, an original approach including the evaluation length in roughness parameters definition. The variance analysis is used to select the
most relevant roughness parameter, but also its evaluation length in the second way, to put in evidence the visual aspect differences. 2. Context of the study
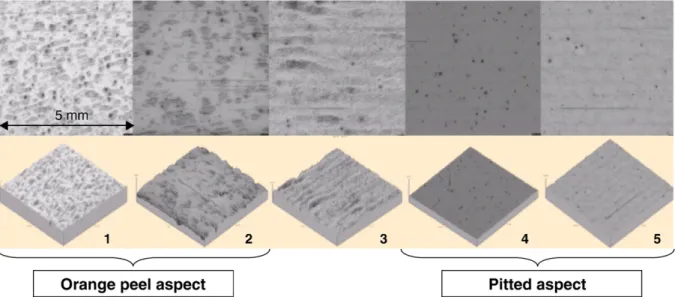
Five specimens of mould presenting differences surface aspects are considered. Each of them corresponds to a type of aspect default observed on produced moulds. According to a first study made on the visual aspect of these specimens analysed by many observers, the samples have been classified by visual quality of polishing as presented onFig. 1(specimen n°1 presenting the worst aspect). This classification allows to show that the well known “orange peel” aspect (observed on specimens 1 and 2) more affects the visual perception of polished surfaces than pitting (observed on specimens 4 and 5). For each sample, 30 profiles were recorded by means of a KLA-TENCOR™P-10 profilometer with a 2μm tip radius and a 10 nm vertical resolution. The scanning length and the sampling length were respectively 8 mm and 0.1μm. For both ⁎ Corresponding author. Tel.: +33 3 20 62 29 58; fax: +33 3 20 62 29 57.
ways of studying roughness, profiles were firstly rectified by a third degree polynomial fitting.
3. Computation
3.1. Conventional roughness parameters calculation
For each recorded profile considered on their total length (8 mm), 27 current roughness parameters were calculated. Values of the arithmetic roughness lie between 70 nm and 140 nm. Next, a variance analysis is performed to select the more relevant roughness parameters to quantify aspect differences between each sample. This statistical method allows to evaluate the relevancy of a given roughness parameter using the ratio of the variance of this roughness parameter due to a given aspect difference with the variance of this roughness parameter due to its estimation errors (see[5]for more details). The higher this ratio denoted F, the more relevant the roughness parameter. According to the F values reported in Table 1for each roughness parameter, Rv defined as the mean of maximum height of roughness valleys of 5 contiguous profiles (obtained by splitting the global profile in 5) and the fractal dimension calculated with the oscillations method[6]can be selected as the more relevant roughness parameters to describe visual aspect differences.
3.2. Multi-scale analysis
As the fractal dimension is relevant on the global evaluation length (8 mm), this involves multi-scale variations of height amplitude of the profile. To quantify these amplitudes, each roughness parameter is calculated on a particular evaluation length. Each profile is previously split in sub-profiles which length corresponds to the given evaluation length denoted asε as presented onFig. 2. Each sub-profile is then rectified by a first degree polynomial fitting by imposing a C0continuity with the two fitting adjacent sub-profiles (Fig. 2). The calculation of this fitting corresponds to the computation of the first degree
B-spline function (defined by a knot sequence and a series of control points which abscissas are taken equal to abscissas of the boundaries between each sub-profile) which minimize the quadratic distance to the global profile (see[7]for more details on the B-spline functions definition). On each rectified ith sub-profile, current roughness parameters denoted by pie are
calculated and the mean of these values denoted by pε is
taken to represent the value of the parameter p of the profile related to the evaluation length ε. With this approach, it is postulated that the profile is ergodic, i.e. that the roughness, characterised by a parameter value and considered at the given evaluation length is statistically similar along the global profile
[8]. This property is verified by the gaussian distribution of roughness parameters values and their low autocorrelation length along profiles. To discriminate with regard to the aspect differences, the roughness parameters associated with their evaluation length, a variance analysis is performed again. In this multi-scale approach, roughness measurement on different Fig. 1. Specimens classification with regard to their visual aspect.
Table 1
List of roughness parameters calculated in the conventional approach and their relevancy to describe the visual aspect differences
Roughness parameter
Roughness parameter relevancy to describe aspect differences (F) Roughness parameter Roughness parameter relevancy to describe aspect differences (F) Z0 1.16 Rz 24.66 Ra 8.91 Rmax 2.73 Rq 4.63 Rpm 8.79 Sk 2.68 Rv 134.68 Ek 0.43 Rz3 21.94 Zmax 0.88 Sm 1.29 Zmin 32.50 L0 5.04 Rt 2.96 Lr 5.04 Deltaa 7.27 Gamma 0.67 Deltaq 6.81 Rwz 5.56 Landaa 7.35 Romin 18.06 Landaq 7.64 Romax 4.38 G 3.16 Fractal dimension 71.51
support lengths is similar to those of fractal and multi-fractal formalisms. For more details see Ref.[9]. Results are given in
Fig. 3 for the two more relevant roughness parameters. From these graphs, the most relevant evaluation length of each roughness parameter can be selected (more relevant roughness parameter are given inTable 2).
4. Results and discussions 4.1. Conventional calculation
Value of the two most relevant roughness parameters versus visual quality of polishing are given inFig. 4. From these graphs,
three groups of specimens can be made: {1 and 2}, {3} and {4 and 5}. The first group is characterised by deep grooves on the surface (high amplitude value of Rv), which induce a less random roughness and a decrease of the fractal dimension. Moreover, the depth of grooves relative to pitted specimens is lower than samples presenting an“orange peel” aspect. More precisely, the monotony of the relevant roughness parameters versus the visual aspect classification from 2 to 5 gives the ability of these roughness parameters to describe the visual aspect differences of these specimens. In contrast, the evolution of relevant roughness parameters between specimens 1 and 2 suggests that these roughness parameters calculated on the total length of the profile, are not able to describe the different orange peel aspects. Fig. 2. Sub-profiles definition from the global profile and first degree B-spline fitting for an evaluation length of 623μm.
Fig. 3. Evolutions of the more relevant roughness parameters (Ra on the left,λa on the right) relevancy versus the evaluation length.
Table 2
List of the more relevant roughness parameters with their evaluation length to describe aspect differences
Roughness parameter Ra λa Rv Fractal dimension λq Rq Zmin Sm Rz
Evaluation length (μm) 371.2 336 745.3 471.5 336 521 280.7 371.2 648.5
4.2. Multi-scale approach
Table 2reports the most relevant roughness parameters and their evolution at their most relevant evaluation length are shown in Fig. 5. Firstly, Ra can now be noticed as the most relevant roughness parameter. This result can be explained by the filter effect of the B-spline function which keeps the more relevant information contained in the profile. These results show that the multi-scale method is able to highlight amplitude differences about 30 nm at an evaluation length of 370 μm. As the conventional approach, the same three groups of specimens can be extracted. The orange peel aspect is characterised by high value of Ra associated with an increasing depth of groves. In contrast, the evolution between specimens 4 and 5 is not in correspondence with the pitted
aspect. This observation can be explained by the fact that the Ra is calculated from a population of values computed along the profile. Consequently, if the profile presents an “irregular high peak”, its effect is attenuated. In the studied case, pitting is treated as “high peaks” and their influence is more difficult to put in evidence. The increase of Ra after sample 4 can be explained by a wavelength observed at an evaluation length about 350 μm on the specimen n°5 that is confirmed by the evolution of the arithmetic mean of wavelengths of profiles (λa) in Fig. 5. Moreover, this multi-scale approach outlines that, although the arithmetic roughness is around 30 nm, the roughness must be evaluated on the spacial length around 400 μm. This result shows that orange peel aspect is linked with high wavelengths and need a profilometer with high vertical resolution and long scanning length. This emphasizes the importance of the choice of the measurement device as in Ref.[10]. Jacobs et al. have found characteristic texture called “orange peel” in the surface of a ZnSe part after MRF (MagnetoRheological Finishing) [11]. A roughness analysis shows that the surface features causing this microroughness are not pits or scratches but are rather hills and valleys on the part surface. They also found that the orange peel is concentrated on large spatial resolution 350 μm and low amplitude peak-valley height (60 nm peak to valley value). The irregular surface texture, “orange peel” is related to the chemistry and mechanics of the polishing process[12]. These results confirm the relevancy of the multi-scale analysis. 5. Conclusion
This paper outlines two methods (conventional and multi-scale) for studying roughness of mould surfaces with regard to their visual aspect. Globally, the results have shown that 3 Fig. 4. Evolution of the two more relevant roughness parameters to describe visual aspect differences for the traditional approach of roughness measurement.
Fig. 5. Evolution of the two more relevant roughness parameters to describe visual aspect differences for the multi-scale approach of roughness measurement.
groups of specimens can be discriminated by both approaches. The conventional approach is less able to highlight the level of the orange peel aspect because of its lack of relevancy. The multi-scale approach gives a higher relevancy. It was shown that the orange peel aspect is due to an increase arithmetic roughness of 20 nm evaluated on a large spacial length of 400μm. This clearly means that an appropriate roughness profilometer (high vertical resolution, long scanning length) must be used to detect these critical visual defaults.
References
[1] K. Schützer, A.L. Helleno, S.C. Pereira, J. Mater. Process. Technol. 179 (2006) 172.
[2] Terminology of Defects in Glass, ed. Sub-committee A1 of the International Commission on Glass, Offenbach, Germany, 1969. [3] F.M. Ernsberger, Annu. Rev. Mater. Sci. 2 (1972) 529.
[4] F. Hennebelle, D. Najjar, M. Bigerelle, A. Iost, Prog. Org. Coat. 56 (2006) 81.
[5] D. Benoist, Y. Tourbier, S. Germain-Tourbier, Plans d'expériences— Construction et Analyse, Tec and Doc Ed, Paris, 1995.
[6] D. Dubuc, J.F. Quiniou, C. Roques-carnes, C. Tricot, S.W. Zucker, Phys. Rev. A 39 (3) (1989) 1500.
[7] G. Farin, Curves and Surfaces for Computed-Aided Geometric Design— A Practical Guide, 4th EditionAcademic Press, San Diego, 1996. [8] V.V. Lopushenko, Applied Math and Computer Science Faculty of the
Moscow State University, Vorob'yov Hills, Moscow, 1999.
[9] M. Bigerelle, A. Van Gorp, A. Iost, 10th International Conference on Metrology and Properties of Engineering Surface, Publications de l’Université de Saint-Etienne, 2005, p. 69.
[10] J.M. Bennett, Meas. Sci. Technol. 3 (1992) 1119.
[11] S.D. Jacobs, F. Yang, E.M. Fess, J.B. Feingold, B.E. Gillman, W.I. Kordonski, H. Edwards, D. Golini, Magnetorheological Finishing of IR Materials, LLE Review 72 (1997) 197.
[12] H. Matsushita, M. Ishida, J. Kikawa, J. Cryst. Growth 103 (1–4) (1990) 448.