INTRODUCTION
Cadmium content in coastal marine sediments is highly variable due to the precipitation of authigenic cadmium as sulfide (Rosenthal et al. 1995a,b, van Geen et al. 1995, Gobeil et al. 1997a, Morford & Emerson 1999). Hence, in anoxic basins and in environments with rich organic carbon deposits, sedimentary Cd concentration can reach values up to 1 or 2 orders of magnitude higher than crustal abundance (ca. 0.1 μg g–1) right at the sediment-water interface (Pedersen et al. 1989). However, sedimentary Cd is usually close to crustal abundance near the sediment-water interface, and increases significantly only below the horizon corresponding to the lower limit of oxygen penetration depth in the sediments (Gobeil et al. 1997a). Although the factors that precisely determine the extent to which a sediment is enriched in authigenic Cd are not yet fully understood, factors such as fluxes of
organic matter at the sea floor, bottom water oxygen concentration, and sedimentation rate appear to be important.
The accumulation of sedimentary Cd in benthic organisms might be affected by the varying levels of authigenic Cd in the sediment if high levels occur close to the sediment-water interface, as it is often the case in coastal environments. The view that sedimentary Cd is mainly bioavailable as a dissolved constituent in porewater, and that dissolved cadmium concentration in porewater controls uptake of this metal by benthic organisms (e.g. Di Toro et al. 1992), is not generally applicable. Indeed, Lee et al. (2000a) concluded that feeding behavior and dietary uptake control the accu-mulation of Cd in marine benthic invertebrates ( Pota-mocorbula amurensis, Macoma balthica, Neanthes arenaceodentata, and Heteromastus filiformis), since the levels of Cd and other metals in the organisms cor-related well with those in the sediments, despite the
© Inter-Research 2006 · www.int-res.com *Email: [email protected]
Cadmium accumulation in coastal demersal fish
Claude Rouleau
1,*, Charles Gobeil
1, 2, Hans Tjälve
31Institut Maurice-Lamontagne, Ministère des Pêches et Océans, CP 1000, Mont-Joli, Québec G5H 3Z4, Canada 2Institut National de la Recherche Scientifique, Centre Eau, Terre et Environnement, 490 avenue de la Couronne,
Québec, Québec G1K 9A9, Canada
3Swedish University of Agricultural Sciences, Department of Pharmacology and Toxicology,
Box 7028, 750 07 Uppsala, Sweden
ABSTRACT: The hepatic Cd burden, measured on 291 individuals of 4 species of demersal fish (Gadus morhua, Reinhardtius hippoglossoides, Hippoglossoides platessoides, and Raja radiata), is 2 to 5 times higher in fish from the open Gulf of St. Lawrence than in fish from the St. Lawrence Estuary, 600 km landward. The higher Cd burden in the open Gulf is not related to the input of anthropogenic Cd, nor can it be attributed to differences in size, sex, sampling season, or state of health. Rather, the Cd burden in demersal fish may be related to sediment diagenesis, since the con-centration of authigenic Cd (i.e. Cd minerals formed in the sediments) is higher in the Gulf than in the Estuary, which may lead in turn to Cd-enrichment in sediment-dwelling organisms. Measured Cd burdens in the liver agree with predictions made with a simple biokinetic model that uses realistic estimates of the Cd content of benthic invertebrates in combination with kinetic parameters deter-mined in H. platessoides with in vivo gamma counting. These results strongly suggest that the Cd content of the diet, rather than of the water phase, determines the hepatic Cd burden in these demersal fish species.
KEY WORDS: Cadmium · Fish · Accumulation · Biogeochemistry · Trophic transfer · Sediment Resale or republication not permitted without written consent of the publisher
presence of a large excess of precipitating acid volatile sulfide (AVS) in the sediments. As suggested in pio-neer investigations (Hardisty et al. 1974a,b, Pentreath 1997), if diet is a major vector for the transfer of Cd to demersal fish, which are predators of benthic organ-isms, then diagenetic processes leading to the forma-tion of authigenic Cd sulfide at the vicinity of the sedi-ment-water interface would likely also influence Cd burdens in fish tissues.
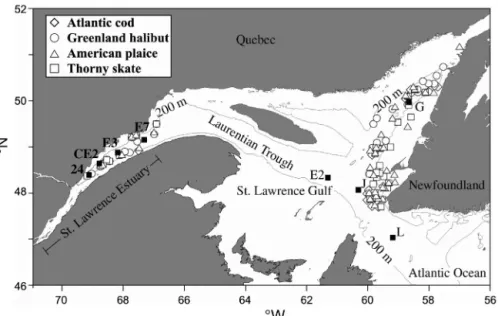
The Laurentian Trough is a 1200 km long and 300 to 500 m deep basin, which stretches across the Estuary and Gulf of St. Lawrence to the edge of the continental shelf in the northwest Atlantic (Fig. 1). The bottom water in this environment has nearly constant salinity (33 to 34 ‰), temperature (2.5 to 4.5°C), and Cd con-centrations (0.25 to 0.30 nM) (Cossa 1988, Koutitonsky & Bugden 1991). The vertical distribution of Cd in the fine-grained sediments of the Trough is characterized by a sharp concentration gradient at about 1 cm depth, approximately at the oxygen penetration depth, which results in the downward diffusion of dissolved Cd into the sediments and its subsequent precipitation (Gen-dron et al. 1986, Gobeil et al. 1987). Moreover, due to the progressive decrease of detrital Cd flux along the Trough, Cd concentration in the subsurface sediment increases as one moves seaward (Gendron et al. 1986, Sundby et al. 2004). Demersal fish living at both ends of the Laurentian Trough are therefore exposed to dif-ferent sedimentary Cd levels and speciation. Thus, the Laurentian Trough is an interesting laboratory to investigate the accumulation of Cd in organisms that feed and spend their life cycle at or near the sediment-water interface.
Here we report results on the hepatic Cd burden in a number of individuals of 4 demersal fish species, the Atlantic cod Gadus morhua, the Greenland halibut Reinhardtius hippoglossoides, the American plaice Hippoglossoides platessoides, and the thorny skate Raja radiata, collected in the open Gulf of St. Lawrence and in the St. Lawrence Estuary. These fish species are good candidates to assess the relationship between Cd concentrations in sediments and in fish tissues due to a high level of separation among the various stocks (Scott & Scott 1988, Arthur & Albert 1993, Swain et al. 1998, Campana et al. 1999). We also present results on the distribution of Cd, Mn, and AVS in sediment cores from the same regions, as well as data on the biokinet-ics (Luoma & Rainbow 2005) of dietary 109Cd in the American plaice, as determined from in vivo gamma counting. Altogether, these results provide an insight into the Cd uptake routes to coastal demersal fish and possible connection with sediment diagenesis.
MATERIALS AND METHODS
Fish sampling and analysis. Atlantic cod, Greenland halibut, American plaice and thorny skate were col-lected by bottom trawl in the Estuary and Gulf of St. Lawrence (Fig. 1) in 1993 and 1994 as follows: Atlantic cod were caught in January 1993 and August 1994 in the Gulf, and in June 1994 in the Estuary; Green-land halibut were caught in August 1993; American plaice were caught in January 1993 and August 1994 in the Gulf, and in August 1993 and 1994 in the Estuary; Thorny skate were caught in August 1993 in the Gulf and in January 1993 in the Estuary. Fish were immediately measured, weighed, placed in clean plastic bags, frozen at –20°C, and brought back to our laboratory for dissection. Sex was determined and liver was collected and weighed. The hepatosomatic index, HSI (Lambert & Dutil 1997), and the allometric condition factor, a (Ricker 1975), were calculated following:
HSI = 100 × WLWSo–1 (1) and
a = 100 × WSoS–b (2)
where WSois the somatic weight (g), defined as the total weight of the organisms minus the weight of gonads, WLis the weight of the liver (g), S is the length of fish (cm), and b is a species-specific coefficient deter-mined by linear regression analysis of lnWSoversus lnS.
Fig. 1. Location of sediment sampling stations and sites of fish catches. Solid squares: sediment sampling stations with station designation; open symbols:
The liver of each fish was individually homogenized in a Teflon bag, freeze-dried, and mineralized with nitric acid in a microwave oven (Nakashima et al. 1988). Cd concentration was then measured by atomic absorption spectroscopy using a graphite furnace. The detection limit, estimated as 3 times the standard devi-ation of the analytical blanks, was 0.02 nmol g–1 wet weight (ww). Biological reference material DORM-1 from the National Research Council of Canada, with a certified Cd concentration of 0.77 ± 0.11 nmol g–1dry weight (dw), was used to assess the quality of our analyses. The precision was 6% and analytical accu-racy was always within prescribed limits (n = 15).
Data of weight, length, HSI, hepatic Cd concentra-tions, and hepatic Cd burdens were transformed to the natural logarithm to correct for the non-homogeneity of variances. The Student t-test was then used to com-pare fish from the Estuary and the Gulf.
Sediment sampling and analysis. Undisturbed sedi-ment box-cores were collected at 300 to 500 m depth in the Laurentian Trough (Fig. 1). The cores were sub-sampled under inert atmosphere into 1 cm-thick layers from sediment surface down to 10 cm depth, and then by 2 cm-thick layer from 10 to 20 cm depth. The sedi-ment samples were then placed in plastic bags and kept frozen at –20°C.
Later in the laboratory, sediment aliquots were freeze-dried, homogenized, and completely digested in a microwave oven with a mixture of concentrated nitric, hydrofluoric and perchloric acids (McLaren et al. 1995). The digestates were then analyzed for total Cd by inductively coupled plasma mass spectrometry (ICP-MS). The overall analytical procedure was veri-fied with the reference sediment BCSS-1 from the National Research Council of Canada. The precision was ± 5%, expressed as the coefficient of variation of replicate analyses (n = 10) of the reference material. The accuracy was within 10%. Dried sediment aliquots were also analyzed to determine Cd and Mn extracted from the sediments during 12 h with a diluted nitric acid solution (1 N). The precision was better than 5%. AVS was determined in frozen samples according to the procedure of Allen et al. (1993). The detection limit, defined as 3 times the standard deviation of blank samples, was 0.01 μmol g–1dw and the precision was better than 10%.
Biokinetics of dietary Cd in American plaice. Six mature female American plaice, weighing 300 to 500 g, were caught in the St. Lawrence Estuary and transferred to 60 l all-glass aquariums 1 wk before the beginning of the experiment. Fish were housed in-dividually in aquaria supplied with aerated filtered flowing seawater and maintained at 5 to 6°C. The day before the experiment started, supplemented fish food (Provencher et al. 1995) was spiked with radioactive
109Cd(II) (New England Nuclear, 10.5 MBq μmol–1, t1/2= 462.6 d), thoroughly homogenized with a stain-less steel spatula for 5 min, and molded in small balls weighing approximately 0.5 g. The contaminated food was kept at 4°C overnight. At Day 0, the fish were anesthetized by placing them in seawater containing 100 mg l–1of Tricaine (MS-222) for 5 min. They then re-ceived 2 balls of contaminated food, which were gently pushed into the stomach with a glass rod. Radioactivity of fish was measured immediately after this feeding and they were returned to their aquarium. Cd dose administered was 44 nmol per fish (5 μg, 0.46 MBq 109Cd, or 10 to 17 μg Cd kg–1body weight). The fish were then fed with uncontaminated food (chopped capelin) from Day 3 until the end of experiments.
The rate of water renewal in the aquariums was kept high enough (1.5 to 2 l min–1) to approximate an open system with no recirculation of the metal. Water sam-ples (3 ml) were collected at least twice a week throughout the experiment and radioactivity was mon-itored for 10 min with a LKB Clinigamma counter. Radioactivity in all water samples was below the detection limit of 0.05 Bq ml–1(< 0.5 ng Cd l–1).
109Cd activity was repeatedly monitored over 42 d in the viscera and caudal muscle with an in vivo gamma counting system described elsewhere (Rouleau et al. 1998). Fish were anesthetized prior to radioactivity measurements and the 88 keV γ-ray emission of 109Cd was monitored for 1 to 3 min, daily during the first 7 d and then every 2 to 4 d thereafter. Fish did not appear to be affected by the repeated manipulations needed for gamma counting. They recovered from anesthesia within ~15 min (recovery of equilibrium). One fish died during the experiment due to a technical failure that caused its aquarium to empty during the night.
109Cd activity was quantified with Genie-PC Gamma Analysis software (Canberra-Packard). After correc-tions for background and decay, activity data were standardized by expressing them as a percentage of the activity measured at t = 0. The stability of the gamma detector was regularly checked through the analysis of a standard containing 74 kBq 109Cd. The mean coefficient of variation of decay-corrected activi-ties measured over the whole experimental period was 2.3%, and the average statistical counting error was 1.4%. The error due to variations in the positioning of fish under the detector, expressed as a coefficient of variation of 5 replicate measurements, was 2%.
At the end of the experiments, all fish were sacri-ficed and dissected. Several tissues and organs were collected and their radioactivity measured. Data obtained were used to calculate the percentage of the 109Cd-body burden contained in each organ and tissue. The concentration index, IC(Rouleau et al. 2000), was then calculated by:
-3 -2 -1 0 1 2 3 4 2 -1 0 1 -1 0 1 -1 0 1 -1 0 1 1 2 1 2 1 0 2 1 0 -3 -2 -1 0 1 2 3 4 3.4 3.6 3.8 4 3.4 3.6 3.8 4 3.4 3.6 3.8 4 3.4 3.6 3.8 4 -1.5 -1 -0.5 0 0.5 1 1.5 2 3.4 3.6 3.8 4 3.4 3.6 3.8 4 3.4 3.6 3.8 4 3.4 3.6 3.8 4 3.4 3.6 3.8 4 3.4 3.6 3.8 4 3.4 3.6 3.8 4 5 5.5 6 6.5 7 7.5 8 3.4 3.6 3.8 4 b = 2.947 ± 0.096 r2 = 0.91 r2 = 0.94 r2 = 0.93 b = 2.665 ± 0.108 r2 = 0.005 b = -0.92x + 2.50 r2 = 0.30 b = -1.34x + 1.47 r2 = 0.40 b = -0.80x + 2.51 r2 = 0.15 b = -1.01x + 0.74 r2 = 0.22 b = -1.30x + 2.46r2 = 0.40 r2 = 0.92 b = 3.152 ± 0.114 b = 3.240 ± 0.088 b = 2.665 ± 0.108 G. morhua (a) (b) (c) (d) (e) (f) (g) R. hippoglossoides H. platessoides ln size (cm) ln somatic weight (g) ln [Cd] liver (nmol g –1 ww) ln [Cd] liver (nmol g –1 ww) ln [Cd] liver (nmol g –1 ww) ln hepatic Cd bur d en (nmol kg –1 bw) ln hepatic Cd bur d en (nmol kg –1 bw) ln a ln size (cm) ln size (cm) ln size (cm) ln % water in liver ln hepato-somatic index ln hepato-somatic index R. radiata -3 -2 -1 0 1 2 3 4 3.5 4 4.5 3.5 4 5 4 3 2 3.5 4 4.5 4.5 -10 1 2 3 4 5 6 7 -10 1 2 3 4 5 6 7 2 1 0 -1 0 1 -1 0 1 1 2
Fig. 2. Gadus morhua, Reinhardtius hippoglossoides, Hippoglossoides platessoides, and Raja radiata. (a) ln somatic weight vs. ln
size, (b) ln a vs. ln size, (c) ln [Cd] in liver vs. ln size, (d) ln [Cd] in liver vs. ln % water in liver, (e) ln [Cd] in liver vs. ln
hepato-so-matic index (HSI), (f) ln hepatic Cd burden vs. ln HSI, and (g) ln hepatic Cd burden vs. ln size. R: fish sampled from the
(3) A value of IC> 1 indicates that a tissue is enriched in 109
Cd compared to the whole-body average metal con-centration. Two additional American plaice, weighing ca. 50 g, were each given 0.5 g of the 109 Cd-contami-nated food (2.5 μg Cd or ca. 50 μg Cd kg–1 body weight) and sampled 7 d after feeding to be used for whole-body autoradiography, as described previously (Ullberg et al. 1982, Rouleau et al. 1998).
RESULTS
Anatomical data
Atlantic cod sampled in the Gulf were significantly larger than those sampled in the Estuary, whereas the reverse was the case for thorny skate. Weight-length relationships for the 4 fish species, as well as values of the calculated condition factor a as a function of length, are shown in Fig. 2. No significant correlation could be found between a and size for any of the fish species. Average values of a did not differ between sites for the Atlantic cod, American plaice, and thorny skate (Table 1). In the case of Greenland halibut, the differ-ence between the Estuary and Gulf, though small, was significant.
Values of HSI and percentage of water in the liver strongly differed between sites for Atlantic cod (Table 1): the high value of HSI was associated with low water content in fish from the Gulf, whereas the inverse trend was observed for those sampled in the Estuary. A significant, though less marked, difference in liver water content was observed between sites for Greenland halibut and American plaice, but not for thorny skate (Table 1), and average values of HSI did not differ between sites for these 3 species. There was no significant difference in size between males and females for any of the fish species or sampling sites.
Trends in hepatic cadmium concentration and burden
The average concentrations of hepatic Cd were 2 to 5 times higher in Greenland halibut, American plaice, and thorny skate from the Gulf than in those sampled from the Estuary, whereas higher Cd concentrations were observed in the Estuary in the case of the Atlantic cod (Fig. 3). However, when expressing results as hepatic burden normalized for somatic body weight, all fish species exhibited the same trend, e.g. higher values in the Gulf than in the Estuary (Fig. 3). Hepatic
IC % of body burden % of body weight = = 109109 CD in tissue CD in whole body
[
]
[
]
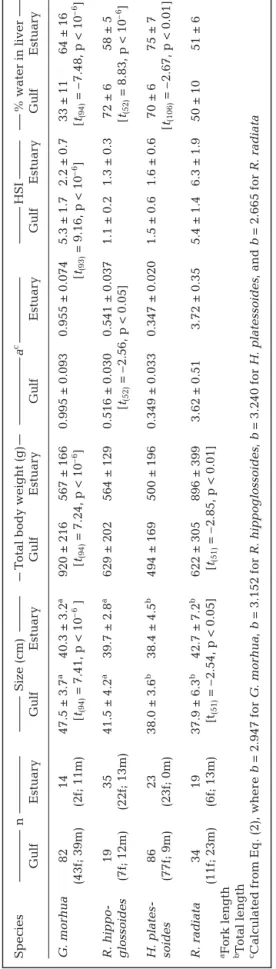
T a ble 1. Gadus mor hua , Reinhar dtius hippoglossoides , Hippoglossoides platessoides , and Raja radiata. Size, total body weight, allometric condition factor
a
, hepatosomatic
index (HSI), and % of water in the liver of fish sampled in the St. Lawr
ence Estuar
y and Gulf. Data ar
e mean ±
SD; n is br
oken d
own into females (f) and males (m). Squar
e
brackets:
t-statistics for significant dif
fer
ences (p < 0.05) between fish sampled in the Estuar
y and the Gulf
Species
n
Size (cm)
T
otal body weight (g)
a c HSI % water in liver Gulf Estuar y Gulf Estuar y Gulf Estuar y Gulf Estuar y Gulf Estuar y Gulf Estuar y G. mor hua 82 14 47.5 ± 3.7 a 40.3 ± 3.2 a 920 ± 216 567 ± 166 0.995 ± 0.093 0.955 ± 0.074 5.3 ± 1.7 2.2 ± 0.7 33 ± 1 1 64 ± 1 6 (43f; 39m) (2f; 11m) [t(94) = 7.41, p < 10 –6 ][ t(94) = 7.24, p < 10 –6][ t(93) = 9.16, p < 10 –6][ t(94) = – 7.48, p < 10 –6] R. hippo-19 35 41.5 ± 4.2 a 39.7 ± 2.8 a 629 ± 202 564 ± 129 0.516 ± 0.030 0.541 ± 0.037 1.1 ± 0.2 1.3 ± 0.3 72 ± 6 58 ± 5 glossoides (7f; 12m) (22f; 13m) [t(52) = – 2.56, p < 0.05 ][ t(52) = 8.83, p < 10 –6] H. plates-86 23 38.0 ± 3.6 b 38.4 ± 4.5 b 494 ± 169 500 ± 196 0.349 ± 0.033 0.347 ± 0.020 1.5 ± 0.6 1.6 ± 0.6 70 ± 6 75 ± 7 soides (77f; 9m) (23f; 0m) [t(106) = – 2.67, p < 0.01 ] R. radiata 34 19 37.9 ± 6.3 b 42.7 ± 7.2 b 622 ± 305 896 ± 399 3.62 ± 0.51 3.72 ± 0 .35 5.4 ± 1.4 6.3 ± 1.9 50 ± 1 0 51 ± 6 (11f; 23m) (6f; 13m) [t(51) = – 2.54, p < 0.05 ][ t(51) = – 2.85, p < 0.01 ] aFork length bT otal length cCalculated fr om Eq. (2), wher e b = 2.947 for G. mor hua , b = 3.152 for R. hippoglossoides , b = 3.240 for H. platessoides , and b = 2.665 for R. radiata
Cd concentrations were not significantly correlated with size, with the exception of American plaice sam-pled from the Gulf (Fig. 2c) for which a very weak cor-relation was found. Cd concentrations were not corre-lated with the water content of the liver (Fig. 2d). A significant negative relationship between Cd concen-tration and HSI was observed for 5 of the 8 groups of fish (Fig. 2e). However, hepatic burden was not corre-lated with HSI, length (Fig. 2f,g), or water content (not shown).
Hepatic Cd concentrations did not differ between male and female with the exception of Atlantic cod in the Gulf (3.7 ± 2.2 nmol g–1ww for males versus 2.7 ± 1.6 nmol g–1 ww for females, t(80)= 2.83, p < 0.01). It is noteworthy that male fish had a smaller liver than females (male HSI = 4.8 ± 1.7, female HSI = 5.8 ± 1.5, t(79)= –3.25, p < 0.01), and that hepatic Cd burden of males and females did not differ (males = 167 ± 91 nmol kg–1, females = 144 ± 63 nmol kg–1, t
(79)= 1.31, p = 0.27).
Trends in sedimentary cadmium content and profiles
Vertical extractable Cd and AVS profiles in the sedi-ments were similar at all stations (Fig. 4). Concentra-tions extracted from the sediments with a diluted nitric acid solution were minimum at the sediment-water interface and then increased downwards below the depth corresponding approximately to the base of the enriched Mn surface layer. The average Cd con-centration in the cores from the open Gulf was signifi-cantly higher (p < 10– 6, non-parametric Mann-Whitney U-test) than in cores from the Estuary, with a Gulf/Estuary ratio of approximately 2 (Fig. 4). The con-centrations of Cd extracted with nitric acid repre-sented 85 ± 8 and 63 ± 8% of the total Cd concentration in the Gulf and the Estuary, respectively.
Biokinetics of dietary Cd in American plaice
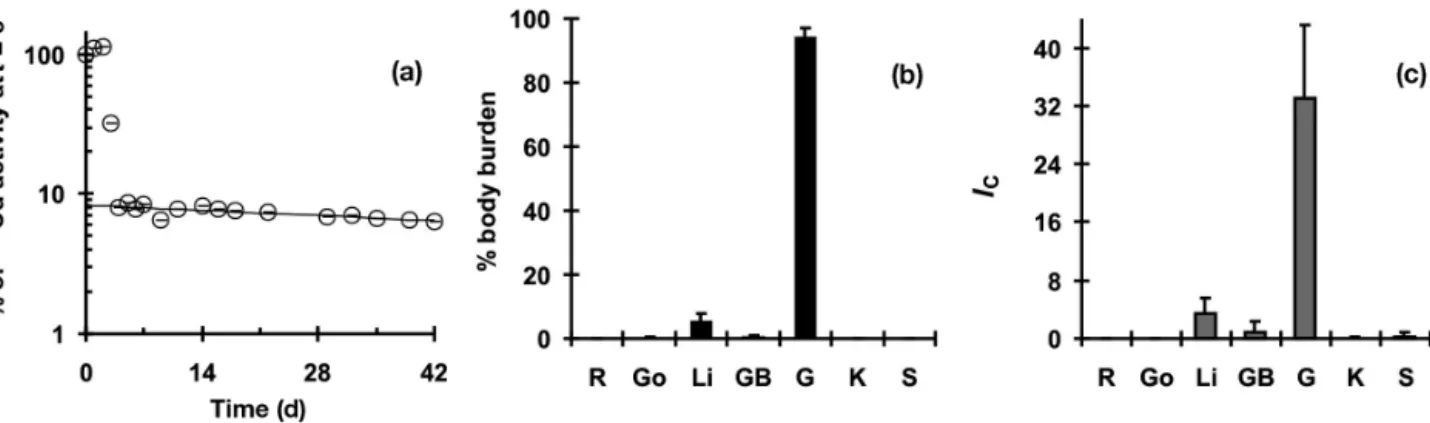
The 109Cd activity in the caudal muscle of the Amer-ican plaice remained too low to be detected by in vivo gamma counting, but was always well above the back-ground in the viscera. A typical example of the tempo-ral evolution of 109Cd activity is illustrated in Fig. 5a. Activity sharply decreased at Day 3–4 as non-retained metal was eliminated with feces, and the quantity of retained 109Cd decreased monoexponentially there-after. Linear regression analysis of the natural loga-rithm of Cdt(109Cd activity at time t) allowed us to cal-culate the assimilation efficiency, AE0 (0% ≤ AE0 ≤ 100%), and the first order elimination rate constant, ke, by:
ln Cdt= ln AE0– ket (4) American plaice retained 8 to 27% of the Cd dose ingested and the biological half-life, t1/2, of the re-tained metal varied between 57 and 131 d (Table 2).
Whole-body autoradiography showed that most of the radiolabel was concentrated in the gastrointesti-nal tract 7 d after feeding (Fig. 6). Detectable levels of radiolabel were also observed in the liver, but not in any other tissue. Data obtained by dissecting plaice at the end of the experiment did not reveal any marked changes in the distribution of 109Cd 42 d after feed-ing, compared to results from the autoradiogram (Fig. 5). The gastrointestinal tract still accounted for most of the Cd body burden (Fig. 5b), with 94 ± 3%. The liver contained only 5 ± 2%, and the other tissues ≤0.3% each. The value of IC (Fig. 5c) was highest in the gastrointestinal tract (IC = 33 ± 10), followed by the liver (IC = 3.4 ± 2.3) and the other tissues (IC≤ 0.5). 0 2 4 6 8 10 AC GH AP TS nmol Cd g –1 ww nmol hepatic Cd kg –1 bw Gulf Estuary 0 1 2 3 4 5 AC GH AP TS [Cd] in liver [Cd]Gulf/Estuary * *** *** *** 0 50 100 150 200 250 300 AC GH AP TS 0 1 2 3 4 5 6 BurdenGulf/Estuary Hepatic Cd burden ** *** *** ***
Fig. 3. Gadus morhua, Reinhardtius hippoglossoides, Hippo-glossoides platessoides, and Raja radiata. Hepatic Cd
concen-tration and hepatic Cd burden. Data are means ± SD. AC: Atlantic cod; GH: Greenland halibut; AP: American plaice; TS: thorny skate. Significant differences between sites at p < 0.05, p < 0.01 and p < 0.001 indicated by *, **, and ***,
DISCUSSION
Hepatic Cd burdens of fish and Cd concentrations in sediments were both higher in the Gulf than in the Estuary, suggesting a direct causal relationship. This hypothesis, however, is subject to the following con-ditions: (1) that this trend reflects local conditions, (2) that sedimentary Cd is similarly bioavailable in the Gulf and the Estuary, and (3) that dietary Cd
uptake in demersal fish is an efficient mechanism. Before such a conclusion can be drawn, variables such as morphological and physiological status of the fish relevant to the Cd content in tissues need to be carefully examined.
Biological factors influencing cadmium content in fish
The accumulation of a trace metal in a given species at a given location is dependent upon factors such as size, seasonal variations in physiological status, and sex (Depledge & Rainbow 1990). The potential influ-ence of these factors is discussed below. The discrep-ancy of the spatial trend observed for Cd concentration and body burden in the case of the Atlantic cod is of particular concern.
Relationships between weight and length, e.g. condition indices, are commonly used to compare the effect of biotic and abiotic factors on the health and well-being of a population (Cone 1989). The fact that no significant correlation could be found between the calculated values of the condition factor a and size for any of the fish species (Fig. 2b) indicates that fish samples from the Estuary and Gulf were homogenous
Fig. 4. Profiles of total sedimentary Cd, extracted Cd and Mn, and acid volatile sulfide (AVS) as a function of depth z in sediment
cores from the Estuary and Gulf of St. Lawrence. See Fig. 1 (solid squares) for location of sampling stations
Table 2. Hippoglossoides platessoides. Biokinetic parameters
of dietary 109Cd(II) in female American plaice. Values of
elim-ination rate constant keand assimilation efficiency (AE0) were
determined by linear regression analysis with Eq. (4). Biolog-ical half-life t0.5is (0.693 ke–1) and the time needed to reach
95% of the kinetic equilibrium t0.95is (2.996 ke–1)
Fish no. AE0(%) ke(10– 3d–1) t0.5(d) t0.95(yr) r2
1 10.0 12.1 57 0.7 0.92 2 14.6 9.3 75 0.9 0.94 3 26.7 5.3 131 1.6 0.74 4 8.4 6.2 112 1.3 0.65 5 24.0 7.9 88 1.0 0.78 All fish 16.7 ± 8.2 8.2 ± 2.7 93 ± 29 1.1 ± 0.4 (mean ± SD)
for b (Eq. 2) in their weight-length relationship (Bol-ger & Connolly 1989, Cone 1989). The similar values of condition factor a for Atlantic cod, American plaice, and thorny skate indicated that the ‘fitness’ of fish was similar, despite size differences observed for cod and skate (Table 1). In the case of Greenland halibut, the difference between Estuary and Gulf, though sig-nificant, was very small. It thus appears that the spa-tial distribution of hepatic Cd levels in fish cannot be related to variables of general health status. Further-more, body size was not correlated with hepatic Cd concentrations, with the exception of American plaice (Fig. 2c) for which the correlation was very weak (r2= 0.05).
The HSI and the percentage of water in the liver cor-related well with the energy content of this organ (comprised mostly of fat), and accurately reflected the physiological status of many marine fish species (Lam-bert & Dutil 1997, and references therein). In the case of Atlantic cod, the inverse spatial trends observed for HSI and water content were related to important
seasonal variations in the nutritional status of this fish species (Lambert & Dutil 1997, Schwalme & Chouinard 1999). Lambert & Dutil (1997) observed that cod caught in the St. Lawrence from August to January exhibited high HSI values, which characterized ‘fat’ livers, containing 40 to 70% lipid and ≤40% water. On the contrary, cod caught in May and June had low HSI values, characterizing ‘lean’ livers that typically con-tained ≤25% lipid and ≥60% water. These variations were strictly seasonal and not related to body size (Lambert & Dutil 1997). In the present study, cod from the Gulf were caught in August and January, whereas those from the Estuary were caught in May (Table 1). Thus, the different physiological status of our 2 groups of cod, reflected by HSI and water content, was related to the time of their capture.
Variations in liver fat content may have had a signif-icant impact on hepatic Cd concentrations since Cd in cells is mostly bound to proteins (George 1982). For a given hepatic Cd burden, an increase of liver size due to lipid accumulation will result in an apparent
diminu-Fig. 5. Hippoglossoides platessoides. (a) Typical evolution of 109Cd activity measured over 42 d in the viscera of female American
plaice. Data are standardized as a percentage of the radioactivity measured immediately after feeding. Solid line represents the result of linear regression analysis with Eq. (4), excluding data from Day 0 to 3. (b) Percentage of 109Cd body burden and (c)
con-centration index, IC, of various organs and tissues in plaice (n = 5) dissected 42 d after feeding with 109Cd-contaminated food.
Values are means ± SD. R: rest of body, Go: gonads, Li: liver, GB: gall bladder, G: gut, K: kidney, S: spleen
Fig. 6. Hippoglossoides platessoides. (a) Whole-body autoradiogram from an American plaice sampled 7 d after feeding with a
tion of Cd concentrations. In actual fact, the significant negative relationship between Cd concentration and HSI that was observed for most of the groups (Fig. 2e) was probably related to variations in the hepatic lipid content, since no significant correlation between Cd concentration and water content was found (Fig. 2d). This correlation between Cd concentration and HSI indicates that the comparison of hepatic Cd levels expressed as concentrations can be systematically biased. Relating metal concentration to the dry weight of the organ would not be useful in this case because dessication does not remove fat.
A more robust comparison was obtained by compar-ing hepatic Cd burden normalized for the somatic body weight. The absence of a correlation of hepatic Cd burden with HSI (Fig. 2f), length (Fig. 2g), and water content (not shown) demonstrated that the former was not affected by liver composition. As mentioned above, average hepatic Cd burdens were higher in the Gulf than in the Estuary for all 4 fish species (Fig. 3). The ratio [hepatic burdenGulf/ hepatic burdenEstuary] for Greenland halibut, American plaice, and thorny skate was similar to the ratio observed for concentrations (Fig. 3).
In the case of the Atlantic cod, observed hepatic bur-den values revealed that fish from the Gulf contained 60% more Cd in their liver than those from the Estu-ary, despite seasonal changes in nutritional status that affected the apparent hepatic Cd concentration. The apparent discrepancy between concentration and hepatic burden data can be explained as follows: in addition to their effect on the value of HSI, seasonal variations in feeding rate were likely to also affect the hepatic Cd burden. The intake rate of the metal with food would vary with feeding rate, and if metal elimi-nation rate by fish is deemed constant, the seasonal variations in the Cd hepatic burden would closely fol-low those of HSI. Fish from both the Gulf and the Estu-ary were submitted to the same seasonal pattern in feeding rate. This results in parallel temporal varia-tions in HSI and Cd hepatic burden in both cod popu-lations. Despite the fact that hepatic Cd burden of cod in the Gulf was always higher than in the Estuary, Cd hepatic concentrations may show an inverse spatial distribution sometime during the year if seasonal vari-ations in HSI are more important compared to those affecting hepatic Cd burden. Fig. 7 shows a simulation of the seasonal variation of hepatic Cd concentration in standardized Atlantic cod of 600 g somatic body weight, in the case where variations of HSI (3×) are greater than those affecting the hepatic Cd burden (1.5×). Seasonal variations in the hepatic Cd burden were simulated with a kinetic model featuring cyclical feeding rates (Whicker & Schultz 1982). The average hepatic burden values corresponded to those found in
Fig. 7. Gadus morhua. Simulation of the seasonal variation of
the hepatic Cd concentration in standardized Atlantic cod of 600 g somatic body weight, in the case where seasonal varia-tions of HSI (3×) are greater than those affecting the hepatic Cd burden (<1.5×). (a) Seasonal variations of HSI interpolated from the data of Lambert & Dutil (1997) and Schwalme & Chouinard (1999). (b) The weight of the liver calculated according to Eq. (1). (c) Seasonal variations of the hepatic Cd burden simulated with a kinetic model featuring cyclical feeding rates (Whicker & Schultz 1982). (d) Hepatic Cd con-centrations (hepatic burden × liver weight–1). Shaded and
open bars represent sampling in the St. Lawrence Estuary and Gulf, respectively
wild fish caught in the Estuary and the Gulf of St. Lawrence. Despite the fact that hepatic Cd burden was always higher in fish from the Gulf (Fig. 7c), cod from the Estuary were sampled at a time when liver size was minimal. This resulted in higher hepatic Cd liver concentrations than cod from the Gulf, which were sampled at times when HSI values were high (Fig.7d). Hepatic Cd burden values can thus be consid-ered a more reliable indicator of the Cd levels in the 4 fish species at the time of sampling than can hepatic concentrations.
From the above discussion, we can conclude that fish from the Gulf of St. Lawrence contained more Cd in their liver, expressed as hepatic burden, than fish from the Estuary, and this trend is not related to morpho-logical, physiomorpho-logical, or seasonal factors.
Cadmium pathways at the sediment-water interface
The vertical distribution of sedimentary Cd was consistent with a mechanism whereby dissolved Cd diffuses downwards and precipitates with sulfide in anoxic sediments (Gobeil et al. 1987, 1997a, Pedersen et al. 1989, Rosenthal et al. 1995a,b). In Gulf sedi-ments, AVS became detectable at a depth somewhat greater than the oxic-suboxic interface. Nevertheless, solubility calculations indicated that precipitation of CdS may occur in suboxic sediments in the presence of trace levels of sulfide that are below routine detec-tion limits (Rosenthal et al. 1995b). Higher Cd con-centrations in cores from the Gulf agreed with previ-ous observations (Gendron et al. 1986, Gobeil et al. 1987, 1997a) and were due to lower sedimentation rates in the Gulf (<1 mm yr–1compared to 3 to 7 mm yr–1 in the Estuary; Smith & Schafer 1999), which resulted in a less important dilution of authigenic Cd by Cd-poor terrigenous particles (Gendron et al. 1986). The fact that sedimentary Cd concentrations and hepatic Cd burden of fish were both higher in the Gulf than in the Estuary indicated that early diagenetic processes affect the bioaccumulation of Cd, if sedimentary Cd is similarly bioavailable in the Gulf and the Estuary.
The bioavailability of authigenic Cd-sulfide is very low according to the AVS model. The latter states that free ionic divalent metal ions, including Cd2+, do not accumulate in porewater and are thus not bioavail-able to endo- and epibenthic organisms when the molar ratio of metal simultaneously extracted with AVS is <1 (Di Toro et al. 1990, 1992, Carlson et al. 1991, Ankley 1996). However, though metal concen-trations in porewater may be mostly controlled by equilibration with metal sulfides in sediments, benthic organisms are not exclusively exposed to dissolved
metals as demonstrated by Lee et al. (2000a,b). These authors showed that dietary uptake controlled the accumulation of sedimentary Cd, Ag, Ni, and Zn in the tissues of 4 species of filter- and deposit-feeding benthic invertebrates even if most metals in the diet were in sulfide forms. In actual fact, Cd concentra-tions in sediment-dwellers and deposit-feeders corre-lated well with sedimentary Cd extracted from sedi-ments with a diluted acid solution (Thomas & Bendell-Young 1998, Langston et al. 1999, Lee et al. 2000a,b, Wallace & Luoma 2003, Wallace et al. 2003). Since we have determined Cd concentrations in the Laurentian Trough sediments by a method similar to those used in the above studies, e.g. cold weak acid treatment, it is likely that the bioavailability of Cd extracted from the sediments with diluted acid is roughly the same in both the Estuary and the Gulf. It is thus reasonable to suppose that Cd levels in benthic organisms of lower trophic level in the St. Lawrence were proportional to the level of ex-tractable Cd in the sediments. The same would be true for predatory demersal fish if diet were the primary uptake route for Cd.
Modelling dietary cadmium uptake in American plaice
The study of the biokinetics of dietary Cd in Ameri-can plaice was aimed at the assessment of the actual importance of trophic transfer in this fish species. Since the distribution pattern observed in the American plaice 42 d after feeding (Fig. 5b,c) was not different from that seen in the autoradiogram obtained 7 d after feeding (Fig. 6), it appears that the distribution of assimilated 109Cd reached a steady state within a few days after food ingestion. Both autoradiographic and quantitative data corresponded to the distribution observed in wild fish, with Cd concentrations in muscle and gonads that were very low compared to hepatic levels (Gobeil et al. 1997b).
The long-term accumulation of Cd in American plaice tissues was modeled with a simple 1-compart-ment model (Rouleau et al. 1998, 2000) expressed as:
Cp = CF · AE0 · IC · (kin/ke) · (1 – e–ket) (5)
where CPand CFrepresent the concentrations of Cd in the predator’s tissues and its food, respectively, and kin is the food consumption rate (g food g–1 body weight d–1). Considering that the approximate age of the American plaice sampled during the field study, > 8 yr (Scott & Scott 1988), was higher than the time needed for dietary Cd uptake to reach 95% of the kinetic equilibrium (Table 2), we only modeled equi-librium (t = ∞) hepatic Cd concentrations with:
Cliver= CF · AE0 · IC liver · kinke (6) or
Cliver= CF · TTFliver (7)
where TTFliveris the trophic transfer factor for the liver.
Cliverwas calculated with experimental average values
of AE0, IC liver, and ke, whereas the value of kin was taken from the literature (Horwood et al. 1989) (Table 3). Cadmium concentration measured in the benthic worm Maldane sarsi from the St. Lawrence Estuary (7.4 ± 2.8 nmol g–1ww, n = 5) was considered a reasonable approximation of CFin the typical food of American plaice, e.g. polychaete worms, molluscs, echinoderms, and crustaceans (Scott & Scott 1988). The value of CF for the Gulf was calculated assuming a ratio ([Cd in worm] / [mean extractable Cd in sedi-ment, z = 0 to 5 cm]) similar to the Estuary (Table 3). Since metal concentrations measured in the tissues of organisms from a given location often show important interindividual variations because of differences in accumulation and elimination capacities, we estimated a concentration range that would comprise 99% of the individuals from a given population under given expo-sure conditions by calculating minimum (Cliver min) and maximum (Cliver max) accumulation with values of AE0,
IC liver, and kethat were 1 SD below or above average
values (Fig. 8) (Table 3). We assumed that values of AE0, IC liver, and kewere normally distributed and that they were independent from each other.
Predicted values of Cliver, Cliver min, and Cliver max agreed well with field data, within a factor of 2 to 3
(Fig. 9). It is noteworthy that the extent of the ranges predicted was in very good agreement with field data, since the values of [log10Cliver max– log10Cliver min] and [log10Cdmax field– log10Cdmin field] differed by less than 0.3 unit. The somewhat higher value of predicted hepatic Cd concentrations may be related to a differ-ence between the actual Cd concentration in the prey organisms of American plaice and our estimate. This may also be due to the use of spiked food to feed the American plaice. Indeed, it has been shown that Cd naturally incorporated in prey organisms is distributed within different subcellular compartments, such as cytosol and metal-rich granules. Only a fraction of Cd, 20 to 75% of the total intracellular metal, is trophically
Table 3. Hippoglossoides platessoides. Values of parameters
used with Eq. (6) to model the long-term trophic accumulation of Cd in the liver of American plaice from the St. Lawrence Estuary and Gulf. Values of AE0, IC liver, and kefor Cliver minand Cliver maxare 1 SD below or above average values. Parameter
values were assumed to be the same for male and female
Average Cliver min Cliver max
AE0a 0.17 0.09 0.25 IC liver 3.4 1.1 5.7 kinb 0.01 kec 0.0082 0.0109 0.0055 CFd Estuary 7.4 Gulf 16.3 aAssimilation efficiency (%)
bFeeding rate (g food g–1body weight d–1) (Horwood et al.
1989)
cElimination rate constant (d–1)
dCd level in food (nmol g–1ww) from Cd level measured in
benthic worms caught in the Estuary, assuming that the ratio ([Cd in worm] / [mean extractable Cd in sediment,
z = 0–5 cm]) = 2.2 and is similar for both Estuary and Gulf
Fig. 8. Normal probability distribution of the values of AE0, IC liver, and ke. The probability that Cliver< Cliver min, e.g. the
probability that AE0< (X – 1σ) and IC liver< (X – 1σ) and ke>
(X – 1σ) for a single fish, is ([0.16 × 0.16 × 0.16] × 100) = 0.5%. The probability that Cliver> Cliver maxis the same. Thus, the
probability that Cliver min≤ Cliver≤ Cliver maxis 99%
Fig. 9. Hippoglossoides platessoides. Equilibrium Cd
concen-trations in American plaice liver resulting from trophic up-take, as modeled with Eq. (6) and parameter values shown in Table 3, compared to field data. Bars represent concentration ranges modelled (Cliver minto Cliver max) for predicted values) or
available and assimilated by predators (Wallace & Lopez 1997, Wallace et al. 1998, Wallace & Luoma 2003). Such a partitioning between available and non-available fractions does not occur in spiked food. Nev-ertheless, the good agreement between predicted and field concentrations and ranges strongly suggests that diet is the main source of Cd for the American plaice.
In summary, we demonstrated that the spatial distri-bution of hepatic Cd burden in the 4 fish species stud-ied follows the distribution of sedimentary labile Cd concentrations in the Laurentian Trough. Higher Cd levels found in fish living in the Gulf of St. Lawrence corresponded to an enrichment of the Gulf sediments with authigenic Cd. Though direct uptake of Cd from the sediment and water by demersal flatfish cannot be totally excluded at present, and further data are needed to better characterize their food sources in term of Cd concentration and speciation, the similarity between the laboratory-based predictions and Cd con-centrations in wild American plaice strongly suggests that the correlation observed between hepatic Cd levels and extractable Cd in sediments is the result of trophic transfer.
Acknowledgements. This work was supported by the Toxic
Chemicals Program of the Canadian Department of Fisheries and Oceans, and by the Swedish Foundation for Strategic Environmental Research. The authors gratefully acknowl-edge the technical assistance of Y. Clermont, L. Beaudin, J. Bolduc, A. Boström, and P. Robichaud.
LITERATURE CITED
Allen HE, Fu G, Deng B (1993) Analysis of acid-volatile sul-fides (AVS) and simultaneously extracted metal (SEM) for the estimation of potential toxicity in aquatic sediments. Environ Toxicol Chem 12:1441–1453
Ankley GT (1996) Evaluation of metal/acid-volatile sulfide relationships in the prediction of metal bioaccumulation by benthic macroinvertebrates. Environ Toxicol Chem 15: 2138–2146
Arthur JR, Albert E (1993) Use of parasites for separating stocks of Greenland halibut (Reinhardtius hippoglos-soides) in the Canadian northwest Atlantic. Can J Fish
Aquat Sci 50:2175–2181
Bolger T, Connolly PL (1989) The selection of suitable indices for the measurement and analysis of fish condition. J Fish Biol 34:171–182
Campana SE, Chouinard GA, Hanson JM, Fréchet A (1999) Mixing and migration of overwintering Atlantic cod
(Gadus morhua) stocks near the mouth of the Gulf of
St. Lawrence. Can J Fish Aquat Sci 56:1873–1881 Carlson AR, Phipps GL, Mattson VR, Kosian PA, Cotter AM
(1991) The role of acid-volatile sulfide in determining cad-mium bioavailability and toxicity in freshwater sediments. Environ Toxicol Chem 10:1309–1319
Cone RS (1989) The need to reconsider the use of condition indices in fishery science. Trans Am Fish Soc 118:510–514 Cossa D (1988) Cadmium in Mytilus spp.: worldwide survey
and relationship between seawater and mussel content. Mar Environ Res 26:265–284
Depledge MH, Rainbow PS (1990) Models of regulation and accumulation of trace metals in marine invertebrates. Comp Biochem Physiol C 97:1–7
Di Toro DM, Mahony JD, Hanson DJ, Scott KJ, Hicks MB, Redmond MS (1990) Toxicity of cadmium in sediments. The role of acid volatile sulfides. Environ Toxicol Chem 9: 1487–1502
Di Toro DM, Mahony JD, Hanson DJ, Scott KJ, Hicks MB, Redmond MS (1992) Acid volatile sulfide predicts the acute toxicity of cadmium and nickel in sediments. Envi-ron Sci Technol 26:96–101
Gendron A, Silverberg N, Sundby B, Lebel J (1986) Early dia-genesis of cadmium and cobalt in sediments of the Lau-rentian Trough. Geochim Cosmochim Acta 50:741–747 George SG (1982) Subcellular accumulation and detoxication
of metals in aquatic animals. In: Vernberg WB, Calabrese A, Thurberg FP, Vernberg FP (eds) Physiological mecha-nisms of marine pollutant toxicity. Academic Press, New York, p 3–52
Gobeil C, Silverberg N, Sundby B, Cossa D (1987) Cd diagen-esis in Laurentian Trough sediments. Geochim Cosmo-chim Acta 51:589–596
Gobeil C, Macdonald RW, Sundby B (1997a) Diagenetic separation of cadmium and manganese in suboxic conti-nental margin sediments. Geochim Cosmochim Acta 61: 4647–4654
Gobeil C, Clermont Y, Paquette G (1997b) Concentrations en mercure, plomb et cadmium chez diverses espèces de poissons de fond, de poissons pélagiques et de crustacés de l’estuaire et du golfe du Saint-Laurent et du fjord du Saguenay. Rapp Stat Can Sci Halieut Aquat No. 1011 Hardisty MW, Huggins RJ, Kartar S, Sainsbury M (1974a)
Ecological implications of heavy metal in fish from the Severn Estuary. Mar Pollut Bull 5:12–15
Hardisty MW, Kartar S, Sainsbury M (1974b) Dietary habits and heavy metal concentrations in fish from the Severn Estuary and Bristol Channel. Mar Pollut Bull 5:61–63 Horwood JW, Walker MG, Witthames P (1989) The effect of
feeding levels on the fecundity of plaice (Pleuronectes platessa). J Mar Biol Assoc UK 69:81–92
Koutitonsky VG, Bugden GL (1991) The physical oceanogra-phy of the Gulf of St. Lawrence: a review with emphasis on the synoptic variability of the motion. In: Therriault JC (ed) The Gulf of St. Lawrence: small ocean or big estuary? Can Spec Publ Fish Aquat Sci 113:57–90
Lambert Y, Dutil JD (1997) Can simple condition indices be used to monitor and quantify seasonal changes in the energy reserves of Atlantic cod (Gadus morhua)? Can J
Fish Aquat Sci 54(Suppl 1):104–112
Langston WJ, Burt RT, Pope ND (1999) Bioavailability of met-als in sediments of the Dogger Bank (Central North Sea): a mesocosm study. Estuar Coast Shelf Sci 48:519–540 Lee BG, Griscom SB, Lee JS, Choi HJ, Koh CH, Luoma SN,
Fisher NS (2000a) Influences of dietary uptake and reactive sulfides on metal bioavailability from aquatic sediments. Science 287:282–284
Lee BG, Lee JS, Luoma SN, Choi HJ, Koh CH (2000b) Influ-ence of acid volatile sulfide and metal concentrations on metal bioavailability to marine invertebrates in contami-nated sediments. Environ Sci Technol 34:4517–4523 Luoma SN, Rainbow PS (2005) Why is metal bioaccumulation
so variable? Biodynamics as a unifying concept. Environ Sci Technol 39:1921–1931
McLaren MJ, Methven BA, Lam JWH, Berman SS (1995) The use of ICP-MS in the production of environmental certi-fied materials. Mikrochim Acta 119:287–295
sensitive trace metals in sediments. Geochim Cosmochim Acta 63:1735–1750
Nakashima S, Sturgeon RE, Willie SN, Berman S (1988) Acid digestion of marine samples for trace element analysis using microwave heating. Analyst 113:159–163
Pedersen TF, Waters RD, Macdonald RW (1989) On the nat-ural enrichment of Cd and molybdenum in the sediments of Ucluelet Inlet, British Columbia. Sci Total Environ 79: 125–139
Pentreath RJ (1977) The accumulation of cadmium by the plaice, Pleuronectes platessa L., and the thornback ray, Raja clavata L. J Exp Mar Biol Ecol 30:223–232
Provencher L, Bryl P, Gendron A, Roy F, Boyer J (1995) Essais d’alimentation de la morue franche (Gadus morhua). Rapp
Tech Ind Sci Halieut Aquat No. 228
Ricker WE (1975) Computation and interpretation of the bio-logical statistics of fish populations. Bull Fish Res Board Can 191:1–382
Rosenthal Y, Boyle EA, Labeyrie L, Oppo D (1995a) Glacial enrichments of authigenic Cd and U in Subantarctic sedi-ments: a climatic control on the elements’ oceanic budget? Paleoceanogr 10:395–413
Rosenthal Y, Lam P, Boyle E, Thomson J (1995b) Authigenic Cd enrichments in suboxic sediments: precipitation and postdepositional mobility. Earth Planet Sci Lett 132: 99–111
Rouleau C, Gobeil C, Tjälve H (1998) Pharmacokinetics and distribution of dietary tributyltin compared to those of methylmercury in the American plaice (Hippoglossoides platessoides). Mar Ecol Prog Ser 171:275–284
Rouleau C, Gobeil C, Tjälve H (2000) Accumulation of silver from the diet in two marine benthic predators: the snow crab (Chionoecetes opilio) and the American plaice (Hip-poglossoides platessoides). Environ Toxicol Chem 19:
631–637
Schwalme K, Chouinard GA (1999) Seasonal dynamics in feeding, organ weights, and reproductive maturation of Atlantic cod (Gadus morhua) in the southern Gulf of St.
Lawrence. ICES J Mar Sci 56:303–319
Scott WB, Scott MG (1988) Atlantic fishes of Canada. Can Bull Fish Aquat Sci No. 219
Smith JN, Schafer CT (1999) Sedimentation, bioturbation, and Hg uptake in the sediments of the estuary and Gulf of St. Lawrence. Limnol Oceanogr 44:207–219
Sundby B, Martinez P, Gobeil C (2004) Comparative geochemistry of molybdenum, cadmium, rhenium, and uranium in continental margin sediments. Geochim Cosmochim Acta 68:2485–2493
Swain DP, Chouinard GA, Morin R, Drinkwater KF (1998) Seasonal variation in the habitat associations of Atlantic cod (Gadus morhua) and American plaice (Hippoglos-soides plates(Hippoglos-soides) from the southern Gulf of St.
Law-rence. Can J Fish Aquat Sci 55:2548–2561
Thomas CA, Bendell-Young LI (1998) Linking the sediment geochemistry of an intertidal region to metal bioavailabil-ity in the deposit feeder Macoma balthica. Mar Ecol Prog
Ser 173:197–213
Ullberg S, Larsson B, Tjälve H (1982) Autoradiography. In: Gleen HJ (ed) Biological applications of radiotracers. CRC Press, Boca Raton, FL, p 56–108
van Geen A, McCorkle DC, Klinkhammer GP (1995) Sensitiv-ity of the phosphate-cadmium-carbon isotope relation in the ocean to cadmium removal by suboxic sediments. Paleoceanogr 10:159–170
Wallace WG, Lopez GR (1997) Bioavailability of biologically sequestered cadmium and the implications of metal detox-ification. Mar Ecol Prog Ser 147:149–157
Wallace WG, Luoma SN (2003) Subcellular compartimental-ization of Cd and Zn in two bivalves. II. Significance of trophically available metal (TAM). Mar Ecol Prog Ser 257: 125–137
Wallace WG, Lopez GR, Levinton JS (1998) Cadmium resis-tance in an oligochaete and its effect on cadmium trophic transfer to an omnivorous shrimp. Mar Ecol Prog Ser 172: 225–237
Wallace WG, Lee BG, Luoma SN (2003) Subcellular comparti-mentalization of Cd and Zn in two bivalves. I. Significance of metal sensitive fractions (MSF) and biologically detoxi-fied metal (BDM). Mar Ecol Prog Ser 249:183–197 Whicker FW, Schultz V (1982) Radioecology: nuclear energy
and the environment, Vol II, 1st edn. CRC Press, Boca Raton, FL
Editorial responsibility: Howard I. Browman (Associate Editor-in-Chief), Storebø, Norway
Submitted: March 21, 2005; Accepted: September 2, 2005 Proofs received from author(s): February 24, 2006