arXiv:0712.0262v1 [astro-ph] 3 Dec 2007
The well defined selection function of the XMM-LSS survey enables a simultaneous modelling of the observed cluster number counts and of the evolution of the L-T relation. We present results pertaining to the first 5 deg2 for a well con-trolled sample comprising 30 objects : they are compatible with the WMAP3 parameter set along with cluster self-similar evolution. Extending such a survey to 200 deg2
would (1) allow discriminating between the major scenarios of the cluster L-T evolution and (2) provide a unique self-sufficient determination of σ8 and Γ with an accuracy of ∼ 5% and 10%
respectively, when adding mass information from weak lensing and S-Z observations.
c
0000 WILEY-VCH Verlag GmbH & Co. KGaA, Weinheim
1 Introduction
It has been recognised for a long time that clusters of galax-ies, as the most massive entities of the universe, can be used as cosmological probes. They provide key information on the normalisation of the power spectrum and are potentially suitable for studying the properties of dark energy. They represent important and independent constraints in addition to those from the CMB and supernovae because they in-volve very different physics. It is also critical to ensure con-sistency between the cosmological constrains from the early and local universe.
Main statistical tools for cluster studies are the cluster number counts (dn/dz) and the cluster two-point correla-tion funccorrela-tion (ξ). This requires that, whatever the detection wavelength, the samples must be in some sense, complete and uncontaminated and thus, requires well understood de-tection and selection procedures. Cluster physics evolution is a key ingredient in interpreting the observed cluster den-sity as function of redshift. It is usually modelled in the form of scaling laws relating observable quantities such as flux, richness, luminosity or temperature to cluster masses. The cluster scaling laws are, however, still poorly known beyond the local universe.
With its mosaic of overlapping XMM pointings (104
s), the XMM Large-Scale Structure survey (XMM-LSS, Pierre et al 2004) has been designed to detect a significant frac-tion of the cluster populafrac-tion out toz = 1, over an area of several tens ofdeg2
, so as to constitute a sample suitable for cosmological studies. We present below the procedures developed to detect the clusters and to further analyse their
⋆ Corresponding author: e-mail: [email protected]
number counts along with their temperature and luminosity distribution in a self-consistent approach. In light of the re-sults obtained so far, we discuss the cosmological impact of a future 200deg2XMM wide survey.
2 Detecting and selecting clusters in the
XMM-LSS survey
In the redshift range of interest, although the cluster ap-parent sizes (20′′ < Rc < 100′′) are significantly larger
than the XMM PSF and source confusion can be consid-ered as negligible, cluster detection is a very specific task since our objects are weak sources (count-rate from 0.3 to 3 counts/min). We developed a two-step procedure combining wavelet multi-resolution analysis and maximum likelihood fits both using Poisson statistics. The pipeline was exten-sively tested using simulations which allowed us to define a sub-region in the extent vs extent likelihood parameter space, where the contamination level by point-sources is lower than 1%. This constitutes the class one (C1) cluster sample. Strictly speaking, this selection is not flux limited, but allows the construction of well controlled and uncontaminated cluster samples significantly larger than a simple flux limit would allow (Pacaud et 2006). Our C1 sample shows a density of ∼ 6 clusters per deg2.
3 Current cluster results
The XMM-LSS currently covers 10deg2. It is located in the W1 area of the Canada-France-Hawaii Telescope Legacy Survey (CFHTLS) and associated with a number of surveys in the radio, infrared and UV domains (Fig. 1). In these
pro-Fig. 1 Layout of the 98 XMM-LSS pointings including the Subaru Deep Survey. The colour scale indicates the ef-fective exposures, from 80 ks (SDS01) to ∼ 0. The green rectangle delineates data obtained prior to the AO5. In ad-dition to the coverage by the SWIRE and CFHT Legacy Surveys, observations from the VLA, Integral, UKIDSS and Galex are available in the field. Full coverage by SCUBA2 and Herschel is planned.
ceedings, we summarise the results from the first 5deg2
which are presented in detail by Pacaud et al 2007 (P07).
3.1 Modelling the cluster number counts
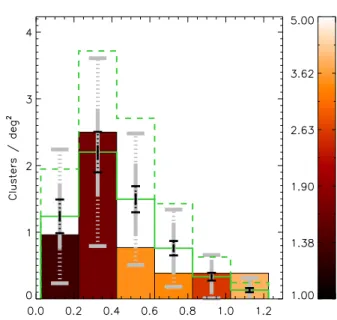
Some 30 C1 clusters are found in the first 5deg2. They all
have been spectroscopically confirmed. Their redshift dis-tribution is displayed on Fig. 2. P07 performed an ab initio modelling of the observed number counts as follows: as-sume a (1) cosmological framework (ΛCDM) and a power spectrum along with a transfer function; (2) a mass func-tion, (3) a halo model, (4) various scaling evolutionary re-lations for cluster physics. Then, for each redshift and mass range, the predicted luminosities are transformed into XMM count-rates using a dedicated plasma code. The C1 selec-tion criteria are finally applied, resulting in a simulated ob-served redshift distribution (Fig. 2). The effect of the degen-eracy between cluster scaling law evolution and cosmology is clearly illustrated on the figure; however, our results, de-spite the still small size of the sample, favour the WMAP3 parameter sets along with cluster self-similar evolution.
3.2 Evolution of the L-T relation
Each C1 cluster undergoes dedicated spatial and spectral fits in order to derive reliable luminosity and temperature es-timates. Willis et al (2005) have shown that using a well adapted binning procedure, it is statistically possible to ob-tained a 20% temperature accuracy with only 200 photons
Fig. 2 The current C1 cluster redshift distribution over the first 5deg2
of the XMM-LSS. The colour scale indicates the cluster mean temperature for each bin (un-weighted mean of the individual cluster temperatures in keV.) The solid green histogram shows the expectations of our cosmological model (WMAP3:σ8= 0.74 and self-
sim-ilar evolution for the Lx-T relation) along with the Poisson error bars. The dash-line histogram shows the expectations for a model with WMAP 1st year cosmological parameters (σ8= 0.85) and a non-evolving Lx-T relation. Fluctuations
around the mean expectation are represented by the solid and dotted error bars for the shot noise and sample vari-ance (estimated from Hu & Kravtsov 2003) respectively. The grey error bars are for 5deg2, while the black ones
for 200deg2.
for groups up to 2 keV. It turns out that for all C1 clus-ters, we obtain temperature measurements with satisfactory accuracy. The average temperature of the C1 clusters as a function of redshift is displayed on Fig. 2. Because of the very tight relation between X-ray temperature and luminos-ity, the mean temperature of the detected clusters appears to increases with redshift (Malmquist bias). This redshift -temperature distribution shows that the XMM-LSS survey unveils for the first time the population of low-mass groups (T= 2 keV) aroundz = 0.3, which constitute the building blocks of the present day clusters.
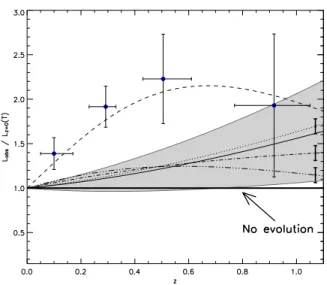
Assuming that all clusters, whatever their mass, follow the same evolutionary scaling laws, we have used our data to constrain the evolution of the L-T relation. The observed luminosity enhancement, with respect to the local expec-tation, is computed for the 30 clusters distributed in four redshift bins (Fig 3). The raw data suggest a rather strong evolution, best fitted with a two-parametre model. However, the inclusion of the survey selection function in the fit sug-gests a much more mild evolution, fully compatible with
Fig. 3 The L-T relation. The graph shows the cluster X-ray luminosity enhancement with respect to the expectation atz = 0. Our clusters are sorted in 4 redshift intervals. The dash line is the result of an ad hoc two-parameter fit to the raw data points:(1+z)α
× E(z)βwithα = 4.7, β = −5.4. When the survey selection function is taken into account, the best fit is the solid line,(1 + z)α
E(z) with α = −0.07, which is very close to the evolution predicted by the self-similar model (dotted line,α = 0 ). The grey region de-lineates the 1σ confidence interval for the surveyed 5 deg2
. The dot-dash and triple-dot-dash lines are the evolutionary models by Voit (2005) including non gravitational physics. The thick error bars at the end of the three models indicate the expectations for a 200deg2survey.
the predictions of the self-similar model. The fact that selec-tion effects were not systematically considered in the former L-T(z) studies may explain the discordant results obtained so far (see a compilation in P07): because the cluster mass function is so steep, most clusters are detected around the survey limiting sensitivity, hence favouring the compilation of over-luminous objects at any redshift. This is certainly not a feature unique to the XMM-LSS survey, but rather of any X-ray cluster survey (provided that the detection is per-formed down to the capabilities of the survey). This bias is to affect any sub-sample “randomly” selected from all-sky or serendipitous surveys for subsequent deep XMM or Chandra temperature observations. We emphasise that the XMM-LSS survey represents the first attempt, not only to determine the L-T relation with survey data alone but also to explicitly include the selection effects in the determination of the evolution of the scaling laws. The latter was possible thanks to the very well modelled survey selection function.
4 AGNs in the XMM-LSS
The XMM-LSS provides a source density of ∼ 300 /deg2 down to a flux limit of 410−15 erg s−1cm2
in the [0.5-2] keV band (95% level completeness limit). This constitutes
4.2 Spectral properties
A dedicated study of some 100 AGN selected in the hard band reveals a mismatch between the classification based on the characteristics of the optical emission lines and the classification given by the X-ray spectroscopy. This led to question some aspects of the AGN unified scheme (Garcet et al 2007). The many CFHTLS and SIWRE flux data points allowed us to perform SED fits on the XMM-LSS point source population. From this, it was possible to classify the AGN (star formation, type 1 or 2 AGN, Seyfert) and to ob-tain photometric redshifts. Combining with the X-ray spec-tral data points, we demonstrate that the SED properties are continuous through the various classes (Tajer et al 2007, Polletta et al 2007).
5 Data releases
Cluster data (positions, redshifts, LX, TX, mass estimates)
are published for the first 5deg2 along with the scientific
analysis (Valtchanov et al 2004 , Willis et al 2005, P07). The complete source catalogue with optical data and thumb nail images is also public (Pierre et al 2007). Data can be retrieved from the CDS or, in a more extensive form, via the consortium data bases for the cluster1and source2 cata-logues.
6 Next decade with XMM: A 200 deg
2wide
survey
During the past years, we explored a number of issues re-garding cluster detection and science with the XMM-LSS survey. In addition to the C1 clusters, a complementary clus-ter sample of about the same size has been identified in the XMM-LSS, but for which the selection criteria are less well defined (Adami et al in prep). We have also detected a number ofz > 1 clusters (Andreon et al 2005, Bremer et al 2006). The determination of the luminosity, temper-ature and mass (hydrostatic hypothesis) of the C1clusters
1 http://l3sdb.in2p3.fr:8080/l3sdb/
Fig. 4 Comparison between the XMM-LSS and Sunyaev-Zel’dovich sensitivities in terms of limiting mass. The red lines show various measured detection probability thresholds for the C1 clusters. The blue lines are the predic-tions for the 10µK APEX survey, currently observing the XMM-LSS field. For the regime of interest (z < 1), the X-ray observations are at least as efficient as the S-Z ones in terms of cluster detection.
from survey data appears to provide quantities reliable for statistical cosmological studies3. A weak lensing analysis over part of the XMM-LSS area shows promising prospects for constraining independently the slope and the normalisa-tion of the M-T relanormalisa-tion (Berge et al 2007). A further step in constraining cluster masses is to be reached by the up-coming generation of Sunyaev- Zel’dovich surveys which, in principle, with a sensitivity of10µK, are well matched to mass range of the XMM-LSS survey (Fig. 4).
Further, we have shown that, in order to increase the precision of the L-T relation evolution, it is more efficient to increase the cluster sample than the accuracy on the tem-perature measurements - a useful tip for a proper use of fu-ture XMM observing time. This is due to the large intrinsic dispersion of the L-T relation itself (P07).
In this way, a 200deg2
survey with 10 ks XMM point-ings4, would allow definitively discriminating not only be-tween cluster self-similar evolution and no evolution, but also between other theoretically justified models based on non-gravitational physics (Fig. 3). Such a 200deg2survey
would moreover overcome sample variance problems and provide more than a thousand C1 clusters as well as some 100 clusters atz > 1. Having determined the cluster evo-lution rate, an important degeneracy would be removed in the cosmological interpretation of the cluster number counts (Fig. 2) leaving a handle on the equation of state of the Dark Energy (P07). The cluster sky distribution provides
addi-3 The mass of XLSS 29 at z = 1.05 was measured to be 1.4 1014M ⊙
with survey data (P07) and 1.8 ± 0.5 1014M
⊙from a subsequent 80 ks
XMM pointing (Maughan et al 2007)
4 such a survey would require some 24 Ms with the current observing
settings, which could be decreased by about 1/3 when the foreseen mosaic-ing mode with a reduced pn overhead is implemented
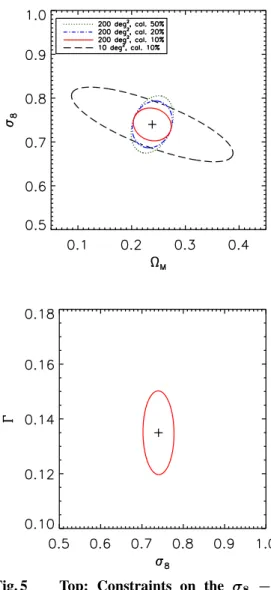
Fig. 5 Top: Constraints on the σ8 − Ωm plane
fromdn/dz + ξ(r). All contours are 1σ for C1 clusters, marginalised overΩΛ. (dots) The C1 X-ray cluster
popu-lation alone (6/deg2
) over 200 deg2
; adding information from S-Z (dash-dot) and weak lensing (solid) mass mea-surements; (dash) same as solid but for 10deg2
coverage. X-ray masses are taken to be accurate to 50%, adding S-Z then weak lensing data reduces this to 20% then to 10%; the latter giving an accuracy onσ8of 6 %. Bottom:
Con-straints on theσ8− Γ plane from ξ(r) + dn/dz.
Con-tours are 1σ for the C1 population, 200 deg2, mass accuracy
of 10% and marginalisation overΩmandΩΛ. The expected
accuracy onΓ is 10%.
tional constraints on the cosmological parameters and a 200 deg2
survey will not only allow a self-sufficient and accu-rate determination ofσ8, i.e. 5 %, but also of the slope of
the matter power spectrum,Γ, i.e. 10% (Fig. 5).
References
Andreon, S., et al: 2005, MNRAS 359, 1250 Berge J. et al: 2007, MNRAS submitted Bremer, M., et al: 2006, MNRAS 371, 1427