Université de Montréal
Effets de facteurs pédoclimatiques sur la
composition et l’anatomie du bois de cinq cultivars
de saule destinés aux biocarburants
par
Nicolas BERTHOD
Institut de recherche en biologie végétale Université de Montréal
Mémoire présenté à la Faculté des Arts et des Sciences en vue de l’obtention du grade de Maîtrise
en Sciences Biologiques
Avril, 2015
Membres du Jury
1. Alain COGLIASTRO : Professeur associé, Département des sciences biologiques de l’Université de Montréal; Botaniste chercheur, Jardin botanique de Montréal
2. Simon BARNABÉ: Professeur agrégé, Département de Chimie, Biochimie et Physique de l’Université du Québec à Trois-Rivières; Titulaire de la Chaire de recherche industrielle Bioéconomie / Bioénergie Région
3. Michel LABRECQUE (Co-Directeur): Professeur associé, Université de Montréal; Conservateur et chef de division R&D scientifique, Jardin botanique de Montréal.
4. Frédéric PITRE (Co-Directeur): Professeur associé, Département des sciences biologiques de l’Université de Montréal; Botaniste chercheur, Jardin botanique de Montréal
- 1 -
Résumé
Effets de facteurs pédoclimatiques sur la composition et l’anatomie du bois de cinq cultivars de saule destinés aux biocarburants
En 2011, cinq (5) cultivars de saules ont été sélectionnés pour leur rendement en biomasse. Ils ont été plantés sur quatre sites de la province du Québec et ont été maintenus selon le protocole de la culture intensive sur courtes rotations (CICR) afin de déterminer leur potentiel pour la bioénergie dans des environnements contrastés. La composition et l’anatomie du bois de ces cultivars ont été caractérisées et comparés en fonction des conditions environnementales caractéristiques de chaque site. La hauteur et le diamètre à la base des plantes diffèrent selon les sites. Ainsi, les cultivars répondent de façon spécifique aux conditions pédoclimatiques dans lesquelles ils sont cultivés. L’effet de l’environnement n’a pas été mis en évidence sur la teneur en lignine des cultivars. Cependant, un effet génotypique a pu être constaté soulignant l’importance de la sélectivité des cultivars. La densité du bois a étonnamment conservé la même hiérarchie génotypique entre les sites. À l’opposé, l’anatomie du bois présente des différences notamment au niveau des caractéristiques des fibres et des vaisseaux. Une forte teneur en polyphénols ainsi que des fibres moins larges et des vaisseaux plus nombreux ont été observés sur le site dont le bois est le plus dense supposant l’effet probable d’un stress abiotique. De plus, deux fois plus de fibres gélatineuses, fibres riches en cellulose, ont été identifiées sur ce site montrant un intérêt pour la production de bioéthanol.
- 2 -
Abstract
Influence of environmental factors on wood composition and anatomy in five willow cultivars tested for bioenergy potential
In 2011, five (5) willow cultivars were selected for biomass yield. They were planted according to SRC (Short Rotation Coppice) protocol on four sites in Quebec (Canada) to determine their bioenergy potential in contrasting environments. Wood composition and anatomical traits were characterized and compared between both genotypes and environmental growing conditions. Tree height and stem diameter differed between sites, and pedoclimatic conditions more favorable for willow growth were identified. However, each cultivar showed a specific response to its environment. While no significant variation in lignin content was observed between sites, a clonal effect confirms the importance of cultivar selection. Surprisingly, the pattern of genotype variability in stem density was the same on all sites. Wood anatomy differed on fiber and vessel traits between high and low wood density sites, which suggests a probable effect of an abiotic stress. Furthermore, twice as many cellulose-rich G fibers were also found at the most dense site, evidence of potential for use in bioethanol production.
- 3 -
Table des matières
Liste des tableaux ... 5
Liste des figures ... 6
Remerciements ... 9 Chapitre 1 – Introduction ... 10 1.1 Formation du bois ... 11 1.2 Composition de la biomasse ... 13 1.2. a) La cellulose ... 13 1.2. b) Les hémicelluloses ... 14 1.2. c) La lignine ... 15 1.2. d) Les polyphénols ... 16 1.3. Sources lignocellulosiques ... 17
Chapitre 2 – Objectifs et hypothèses ... 20
2.1 Objectifs ... 20
2.2. Hypothèses ... 20
Chapitre 3 – Contexte méthodologique ... 21
3.1. Zone d’étude ... 21
3.2. Dispositif expérimental ... 21
3.3 Caractéristiques et suivi des sites ... 22
3.4 Analyses des propriétés du bois ... 23
Chapitre 4 – Résultats ... 24
-Five willow varieties cultivated across diverse field environments reveals high stem density variation with an association to high tension wood abundance ... 24
4.1. Introduction ... 24
4.2. Material & Methods ... 26
4.2 a) Experimental sites ... 26
4.2 b) Tree morphology and density ... 26
4.2 c) Wood composition ... 27
-- 4 --
4.2 e) Statistics analysis ... 28
4.3 Results ... 28
4.3 a) Tree morphology and composition ... 28
4.3 b) Density ... 29
4.3 c) Wood anatomy ... 29
4.4 Discussion ... 30
4.4 a) Site influence on growth and wood composition ... 30
4.4 b) Genotypic variation among wood traits ... 32
4.4 c) Density variability of wood properties ... 33
4.4 d) Relationship between stress and wood anatomy ... 34
4.5 Conclusions ... 35
4.6. Tables ... 36
4.7. Figures ... 37
4.8. References ... 43
Chapitre 5 – Discussion et conclusion générale ... 49
5.1. Hypothèse 1 ... 49
5.2. Hypothèse 2 ... 50
5.3. Conclusion et perspectives ... 51
5.3. a) Productivité de la biomasse ... 51
5.3. b) Détermination de la cellulose accessible ... 52
5.3. c) Origine du stress ... 53
-- 5 --
Liste des tableaux
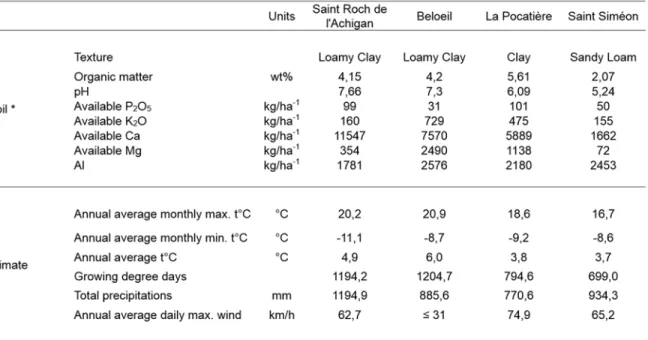
Table IV.I – Comparison of site characteristics (soil analysed in 2011 and climate data collected in 2013) at four trials (Saint-Roch-de-l’Achigan, Beloeil, Saint-Siméon and La Pocatière).
- 6 -
Liste des figures
Figure 1.1 – Architecture de la paroi secondaire de la cellule végétale
Figure 3.1 – Carte des sites sélectionnés dans le réseau de plantes bio-industrielles (RPBQ), mené par le Centre de Recherche sur les graines (CEROM) : Saint-Roch-de-l’Achigan, Beloeil, Saint-Siméon et La Pocatière.
Figure 3.2 – Répartition des cinq cultivars de saules (Salix viminalis 5027, S. dasyclados SV1, S. miyabeana SX61, S. miyabeana SX64, S. miyabeana SX67) sur le site de Saint-Siméon
Figure 3.3 – Vue de la plantation de saules à la Pocatière – Été 2013
Figure 4.1 – Site localization in Québec province, Canada: Saint-Roch-de-l’Achigan (SR), Beloeil (B), Saint-Siméon (SS) and La Pocatière (LP).
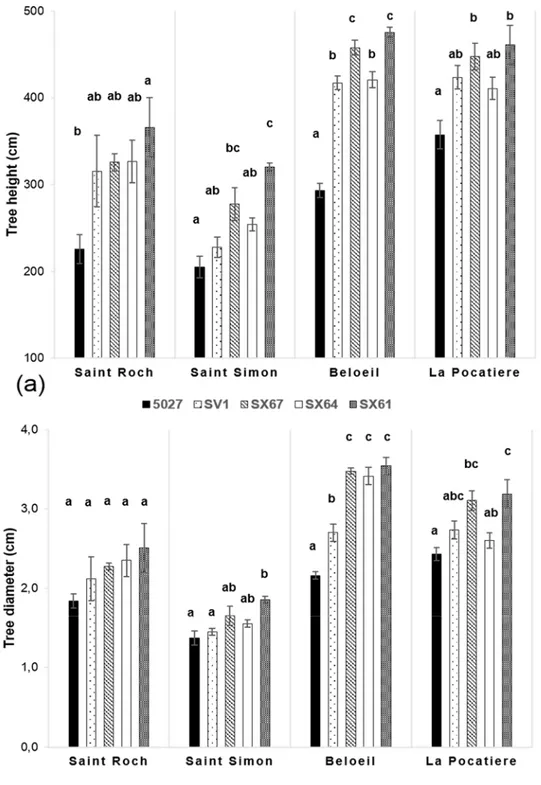
Figure 4.2 – Tree height (a) and stem diameter (b) from five willow cultivars in their second year of a harvest cycle (Salix viminalis 5027, S. dasyclados SV1, S. miyabeana SX61, S. miyabeana SX64, S. miyabeana SX67) sampled at four field trials in Québec: Saint-Roch-de-l’Achigan, Beloeil, Saint-Siméon and La Pocatière. Error bars represent standard error, n = 4 blocks (6 trees per block). Tukey's Honestly Significant Difference (HSD) pairwise post hoc test (α = 0.05) are represented by letters a - c.
Figure 4.3 – Five willow cultivars in their second year of a harvest cycle (Salix viminalis 5027, S. dasyclados SV1, S. miyabeana SX61, S. miyabeana SX64, S. miyabeana SX67) sampled at
- 7 -
four field trials in Québec: Saint-Roch-de-l’Achigan, Beloeil, Saint-Siméon and La Pocatière. a) Variation in extractives (toluene-ethanol/water extraction); b) lignin content expressed as a percentage of dry matter and c) total polyphenolics content (methanol-extractable). Error bars represent standard error, n = 4 blocks (4 trees per block). Tukey's Honestly Significant Difference (HSD) pairwise post hoc test (α = 0.05) are represented by letters a - b.
Figure 4.4 – Stem density was assessed using oven dried specific gravity (grams per cubic centimeters) from five willow cultivars in their second year of a harvest cycle (Salix viminalis 5027, S. dasyclados SV1, S. miyabeana SX61, S. miyabeana SX64, S. miyabeana SX67) sampled at four field trials in Québec: Saint-Roch-de-l’Achigan, Beloeil, Saint-Siméon and La Pocatière. Error bars represent standard error, n = 4 blocks (4 trees per block). Tukey's Honestly Significant Difference (HSD) pairwise post hoc test (α = 0.05) are represented by letters a - d.
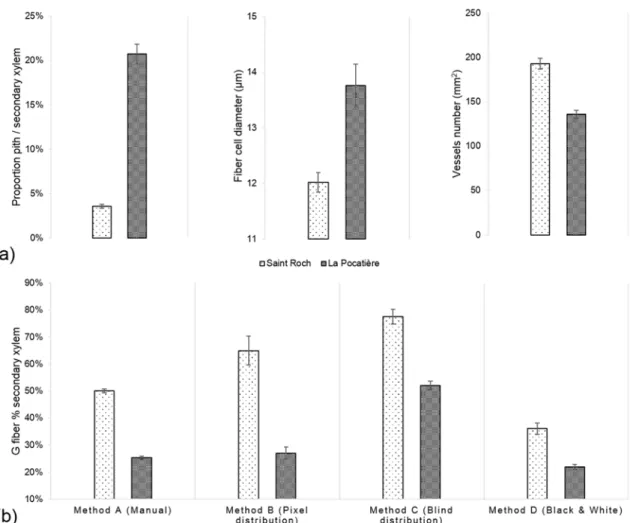
Figure 4.5 – SX64 cultivar (S. miyabeana) in its third year of a harvest cycle sampled at two field trials in Québec: Saint-Roch-de-l’Achigan and La Pocatière. a) Measured Anatomical traits: i) pith proportion, ii) fiber cell diameter and iii) vessels number per 1mm2; b) Variation of G fibers determined by different image analytical methods: Method A (Manual) involved manual drawing around stained g-fibre, Method B (Pixel distribution) quantified pixels in a bin from 0 to 100, Method C (Blind distribution) quantified pixels in a bin from 0 to 127 and Method D (Black & White) count black pixels of monochrome. Error bars represent standard error (n = 3 trees). All comparisons between Saint Roch and La Pocatiere presented in this figure are significantly different (t-test, p < 0.05).
Figure 4.6 – a) 40μm transverse section of a stem from SX64 cultivated at Saint-Roch de l’Achigan (left – most dense) and at La Pocatière (right – least dense). Stained in 1% Chlorazol Black E in methoxyethanol and 1% aqueous Safranin O. b) Polarization of G fibers determined by Method C (Blind distribution) from SX64 cultivar (S. miyabeana) in its third year of a harvest cycle sampled at two field trials: Saint-Roch-de-l’Achigan and La Pocatière. Error bars represent standard error (n = 3 trees). All comparisons between Saint Roch and La Pocatiere presented in this figure are significantly different (t-test, p < 0.05).
- 9 -
Remerciements
Je tiens à remercier vivement Michel Labrecque et Frédéric Pitre de m’avoir récupéré à l’autre bout de la planète afin de me donner l’opportunité de réaliser ce travail. Ce fut une belle expérience d’avoir pu intégrer leur équipe. Je les remercie de m’avoir soutenu dans le développement de mes idées et d’avoir été présents.
Je remercie Nicholas Brereton d’avoir remis un coup d’accélérateur à mes travaux de recherche à son arrivée à l’IRBV et de m’avoir soutenu dans l’étape cruciale de la rédaction.
Je tiens à remercier particulièrement les personnes impliquées dans le RPBQ et qui m’ont aidé à la collecte de mes échantillons et des données des plantations : Louis Roy du MAPAQ à Caplan, Guillaume Salvas et Francis Allard d’Agroénergie à Saint-Roch de-l’Achigan, Olivier Lalonde du CEROM à Beloeil, Isabelle Lemay et Catherine Emond du CDBQ à La Pocatière.
Pour finir je remercie toutes les personnes qui m’ont aidé pendant ces deux années au sein de l’équipe et de l’IRBV et tout particulièrement Stéphane Daigle, Karina Riviello, Hamida Hafssa et Vincent Robillard pour leur implication dans mes travaux.
- 10 -
Chapitre 1 – Introduction
L’augmentation régulière des prix du pétrole combinée aux conséquences du réchauffement climatique ont entraîné l’émergence des énergies dites renouvelables. Le potentiel de l’énergie solaire, de la force éolienne, de la géothermie, de la motricité hydraulique et de la biomasse a été exploité pour satisfaire aux besoins d’énergie que requiert notre développement et aussi répondre à une indépendance énergétique souhaitée (Panwar et al, 2011). La biomasse, comptant déjà pour plus de 75% de l’énergie renouvelable produite dans le monde (rapport IPCC, 2012), est utilisée depuis des millénaires comme source de chaleur par combustion. Plus récemment, cette ressource importante de carbone a été exploitée dans la transformation en biocarburants dans la perspective de remplacer les carburants d’origine fossile. Les premières sources de biomasse utilisées ont priorisé des cultures riches en graines oléagineuses (colza, tournesol) dont l’huile est transformée en biodiesel, ou celles riches en amidon (maïs) pouvant être converti en alcool.
Toutefois, la crise alimentaire mondiale médiatisée en 2008 (FAO, 2012)et celle plus récente (LeMonde, 2012), ont considérablement ralenti l’exploitation de ces ressources. La hausse des prix des céréales a créé un conflit direct avec les cultures dédiées à l’alimentation humaine alors qu’en même temps il existe d’autres sources de biomasses abondantes partiellement exploitées dont les résidus forestiers ou agricoles (paille) par exemple. Ces résidus constituent des sources riches en polysaccharides (cellulose et hémicelluloses), logés dans leurs parois cellulaires, pouvant également être convertis en biocarburants, dits de 2ème génération (Yevich and Logan, 2003). Des cultures ligneuses dédiées à la bioénergie, dont celle du saule, ont aussi émergé du fait de leur fort potentiel de productivité en biomasse. Ces cultures présentent en plus l’avantage de pouvoir être produites sur des terres marginales et exigent moins d’amendements (Dawson, 2007).
Une description générale de la formation du bois et de la composition de la biomasse sera présentée dans cette introduction ainsi que leur interaction avec l’environnement. L’introduction
- 11 -
sera complétée par un portrait des cultures utilisables en bioénergie avec une attention particulière accordée au saule.
1.1 Formation du bois
Le bois, ou xylème secondaire, se forme à partir à l’activité génératrice du cambium, cette assise méristématique de cellules situées sous l’écorce. En réponse à des changements environnementaux comme l’allongement de la photopériode et l’augmentation des températures, les hormones végétales telles que l’auxine, la gibbérelline et les cytokinines vont activer l’activité cambiale (Uggla et al, 2001).
Suite à une première étape de division cellulaire, la différenciation se poursuit par l’expansion de la cellule, une nouvelle fois régulée par les hormones. La cellule s’étend de façon longitudinale et radiale jusqu’à atteindre sa taille maximale. Cette expansion est gouvernée par les microfibrilles de cellulose et la force de turgescence. Les microtubules contrôlant le mouvement des microfibrilles de cellulose vont orienter l’extension cellulaire (Tyerman et al, 2002). La turgescence est conduite par le flux intracellulaire du potassium (Fromm, 2010) dont l’ouverture des canaux est régulée par la température extérieure (Ache et al, 2010). L’acidification de la paroi primaire cellulaire par des pompes à protons joue aussi un rôle dans l’expansion cellulaire (Brett and Waldron., 1990). De plus, des enzymes (voir paragraphe 1.2.b) qui cassent les liaisons cellulose/hémicelluloses participent également à cette extension cellulaire.
Une fois l’expansion cellulaire achevée, la paroi va s’épaissir, devenant la paroi secondaire, par production de cellulose, dépôt de la lignine et des hémicelluloses (Fujino and Itoh, 1998). L’épaississement de la paroi secondaire va se réaliser en trois couches successives (S1, S2, S3) dont les propriétés diffèrent. De plus, elles peuvent être modifiées durant la maturation cellulaire et les quantités de lignine et de cellulose peuvent diminuer sous l’effet par exemple de facteurs abiotiques. À titre d’exemple, la tige d’une plante, soumise à un stimulus mécanique ou gravitaire non vertical, forme un bois de réaction sur le côté supérieur chez les Angiospermes
- 12 -
(bois de tension) ou sur le côté inférieur chez les Gymnospermes (bois de compression) pour corriger la direction de croissance (Felten and Sundberg, 2013). Ce bois présente des propriétés chimiques et anatomiques spécifiques dont la principale caractéristique réside dans le développement d’une couche gélatineuse riche en cellulose à l’intérieur du lumen des fibres (Norberg and Meier, 1966).
La maturation en xylème secondaire s’achève par la mort cellulaire déclenchée par des signaux hormonaux. Le calcium joue un rôle essentiel dans la rupture vacuolaire. Des hydrolases présentes dans la vacuole s’activent et hydrolysent le contenu cellulaire (Jones, 2001).
Les caractéristiques chimiques et anatomiques du bois au cours de cette formation varient selon les espèces, les génotypes, l’âge de l’individu et également en fonction de la saison de croissance (Hejnowicz and Hejnowicz, 1958; Zobel and Jett, 1995). Par exemple, le bois formé au début de la saison de croissance présente des propriétés différentes, une faible densité, des vaisseaux et des trachéides plus larges comparés à ceux du bois formé plus tard dans la saison (Plomion
et al, 2001). Les facteurs abiotiques tels que la salinité ou le manque d’eau engendrent également des modifications de la composition et de l’anatomie du bois. En période de sècheresse, affectés par la perte de turgescence, la taille des fibres ainsi que le lumen des vaisseaux se retrouvent réduites (Arend and Fromm, 2007). Afin de maintenir la conductivité de l’eau dans l’arbre, le nombre de vaisseaux augmente pour corriger la perte en taille (Janz et al, 2012). Ce même phénomène de compensation se retrouve en stress salin où l’expansion cellulaire est affectée par la diminution de la concentration en K+ (Escalante-Perez et al, 2009).
Ces modifications dans l’anatomie du bois, couplées au renforcement des cellules (Junghans et
al, 2006), vont affecter la densité du bois, trait souvent utilisé pour définir les propriétés du bois. La densité augmente en stress salin dû à la réduction de la taille des cellules et l’épaississement des parois (Hacke et al, 2001). La densité du bois peut donc être associée à des perturbations liées à des facteurs abiotiques. Il est aussi intéressant de souligner que la densité est un facteur utile en bioénergie. Les individus à densité élevée présentent un meilleur rendement en combustion ayant plus de masse par unité de volume comparable (Goel et al, 1996). Les perturbations abiotiques changent aussi la composition chimique du bois principalement au
- 13 -
niveau de l’étape de lignification où le dépôt de lignine est altéré (Donaldson, 2002). L’angle des microfibrilles de la cellulose est également modifié dans le but de renforcer la paroi (Wimmer et al, 2002).
1.2 Composition de la biomasse
La biomasse lignocellulosique contient trois polymères majeurs : la cellulose, les hémicelluloses et la lignine. D’autres molécules, en minorité et variables selon les espèces, sont également présentes : des métabolites secondaires, des protéines membranaires, des pectines ou des phospholipides. De par leur rôle physiologique au sein de la plante, les polyphénols forment un groupe important des métabolites secondaires et seront présentés dans cette section suite à celle des polymères de la biomasse.
1.2. a) La cellulose
La cellulose est le polymère le plus abondant sur terre, élément majeur du règne végétal. Il est constitué de longues chaînes ramifiées de glucose, source principale de monosaccharides convertissables en bioéthanol par fermentation. Au cours de la synthèse de la cellulose, un complexe enzymatique, appelé complexe de la cellulose synthase, va directement assembler au niveau de la paroi cellulaire les unités β-D glucose par liaison en β 1-4 pour former une microfibrille d’unités de glucose en nombre variable (Perez and Mazeau, 2005).
La cellulose est en réalité une molécule ayant une structure tridimensionnelle complexe et son agencement va déterminer l’efficacité de l’ancrage sur celle-ci des enzymes d’hydrolyse utilisées pour la transformation en bioéthanol. Ce sont les groupes hydroxyle -OH du glucose qui vont définir la configuration du polymère en formant des liaisons hydrogènes entre eux. Ces liaisons vont se former aussi bien entre unités de glucose de la même microfibrille qu’entre microfibrilles adjacentes modifiant respectivement l’agencement intra- et inter-moléculaire du polymère (Plomion et al, 2001). De plus, ces liaisons vont rendre la molécule de cellulose plus
- 14 -
résistante mécaniquement, difficilement soluble et moins fusible. Cet agencement aléatoire de la cellulose va former des zones cristallines (chaînes alignées en cristaux) et amorphes (chaînes emmêlées en désordre). Et c’est au niveau de ces dernières que les enzymes d’hydrolyse vont s’attaquer en priorité pour scinder la cellulose en monosaccharides au niveau de la liaison β 1-4 (Zhang and Lynd, 2001-4).
1.2. b) Les hémicelluloses
Les hémicelluloses sont les autres polysaccharides de la paroi cellulaire des végétaux, moins abondants et plus complexes dans sa composition que la cellulose. Ces polymères contiennent en effet aussi bien des hexoses (glucose, mannose, galactose, acide galacturonique et acide glucuronique) que des pentoses (xylose et arabinose). La combinaison de ces pentoses et hexoses va former des polymères d’hémicelluloses de nature chimique et de propriétés différentes : les xyloglucanes, les xylanes, les mannanes et les glucanes (Scheller and Ulvskov, 2010). Leur teneur et leur présence varient en fonction de l’espèce considérée. Cette variabilité chimique va rendre la conversion des divers monosaccharides présents difficile par les micro-organismes fermenteurs dont le spectre d’activation diffère selon le type de sucre à fermenter (Girio et al, 2010).
D’un point de vue structurel, les hémicelluloses jouent un rôle important en étant le point de liaison entre la cellulose et les autres polymères de la paroi pectocellulosique : avec la pectine en paroi primaire et avec la lignine en paroi secondaire. Elles se lient fortement aux microfibrilles de cellulose par des liaisons hydrogènes multiples et par des liaisons covalentes fortes avec la lignine (Scheller and Ulvskov, 2010). C’est donc au niveau des polymères de l’hémicellulose que la cellule va agir pour modifier la taille de sa paroi lors des phases de développement ou de différenciation en utilisant des enzymes comme les endotransglycolases, endohydrolases ou les expansines (Somerville et al, 2004; Mellerowicz et al, 2001).
- 15 - 1.2. c) La lignine
Au cours de son développement, la cellule végétale atteint un stade final de croissance (arrêt). Le principal phénomène résultant de cet arrêt est l’insertion à l’intérieur de la paroi d’un composé phénolique, la lignine (Fujino and Itoh, 1998).
La lignine est un polymère aromatique composé de trois sous unités monolignols issues de la voie de la phénylalanine: alcool p-coumarylique, alcool coniférylique et alcool sinapylique. Ces trois unités se polymérisent par oxydation enzymatique via deux mécanismes distincts (bout à bout et en vrac) mais dont le processus exact reste encore mal défini (Wang et al, 2013). S’ajoute à la complexité du polymère le type de liaisons qui se forme entre les monolignols : sept types de liaisons labiles (faible énergie), dont les proportions sont variables selon les espèces, et des liaisons résistantes covalentes. La structure complexe résultant de sa biosynthèse offre cependant une barrière mécanique protectrice à la plante en imperméabilisant les vaisseaux conducteurs et protégeant la plante contre les agresseurs (Lapierre, 2010). La lignine joue également un rôle de soutien pour la plante lui permettant de s’ériger et d’atteindre plusieurs dizaines de mètres de hauteur pour certaines espèces (Fromm, 2013).
Le pouvoir calorifique de la lignine est plus élevé que les autres polymères (27 – 29kJ/g contre 14kJ/g pour la cellulose),ce qui présente un intérêt pour une valorisation en combustion et en cogénération (Lapierre, 2010; Stolarski et al, 2013). N’étant pas un polysaccharide, la lignine n’est pas convertissable en bioéthanol contrairement à la cellulose et aux hémicelluloses. Cependant, dans le but de générer des revenus additionnels à l’industrie des biocarburants, de nombreuses voies sont à l’étude pour la valorisation de la lignine comme agent liant, adsorbant ou copolymères par exemple (Diop et al, 2014).
- 16 -
Fig.1.1 : Architecture de la paroi secondaire de la cellule végétale
1.2. d) Les polyphénols
Issus du métabolisme secondaire des plantes, les composés phénoliques font partie des molécules mineures contenues dans la biomasse lignocellulosique. Des milliers de molécules phénoliques existent mais cinq sous-groupes se dégagent de par leur importance dans la physiologie de la plante et dans notre économie : les acides hydroxybenzoïques, les acides hydroxycinnamiques, les flavonoïdes, les tannins et la lignine (Macheix et al, 2005a).
Depuis l’industrie du tannage, les composés phénoliques ont trouvé leur importance dans l’économie mondiale et peuvent être valorisés dans de nombreux secteurs de l’économie et pourraient trouver leur place dans une industrie comme les biocarburants (Demirbas, 2009). Les polyphénols sont tout d’abord connus pour leurs bénéfices sur la santé humaine grâce à leur pouvoir antioxydant (Rice-Evans et al, 1997). À titre d’exemple, la vitamine E (tocophérol) résulte de l’union d’un phénol avec un terpénoïde (Cadenas et al, 1984). En médecine, ils sont principalement utilisés pour leur activité anti-inflammatoire (par exemple l’acide acétylsalicylique – découvert dans l’extrait d’écorce de saule – et les flavonoïdes) (Preston et
al, 1989). Ils sont également recherchés pour leurs qualités sensorielles en industrie agroalimentaire et horticole. Les anthocyanes du groupe des flavonoïdes, sont les pigments
- 17 -
majeurs des fleurs et des fruits conférant des couleurs variées (Goto and Kondo1, 1991). En agroalimentaire, les composés phénoliques interviennent dans le gout des végétaux : astringence (tannins), amertume (glycosides de flavanones) et arôme (oxydation de l’acide vanillique) (Macheix et al, 2005b).
Au niveau physiologique, les composés phénoliques sont essentiels dans la réponse de la plante aux stress environnementaux. Ils participent tout particulièrement à la défense de la plante contre les parasites par une barrière mécanique protectrice (lignine) et par la stimulation de la biosynthèse de phénols ou des phytoalexines (antibiotique) (Bennett and Wallsgrove, 1994). En outre, les anthocyanes et flavonoïdes protègent la plante contre les rayonnements UV tandis que d’autres composés phénoliques interviennent dans l’alléopathie et la mycorhization (Popaa et
al, 2008).
Les composés phénoliques vont donc varier en fonction des facteurs biotiques ou abiotiques. La présence d’insectes et d’herbivores est proportionnelle à l’accumulation de certains composés phénoliques dans la plantecomme les salicylates et l’acide cinnamique (Glynn et al, 2004). En présence de stress hydrique les plantes peuvent privilégier le cycle carboné pour leur développement pouvant affecter la biosynthèse des composés phénoliques (Orians et al, 2001). Les radiations UV vont également favoriser la synthèse de certains composés phénoliques (quercétine, acides phénoliques) (Tegelberg et al, 2003). Leurs teneurs varient également en fonction d’un individu à l’autre comme une caractéristique spécifique au génotype mais influençable par l’environnement. Ceci a été rapporté chez le saule par exemple (Glynn et al, 2004; Orians et al, 2001).
1.3. Sources lignocellulosiques
Il existe de nombreuses sources lignocellulosiques pouvant être utilisées pour la production de biocarburants (Limayem and Ricke, 2012) comme les résidus forestiers ou agricoles. S’ajoute également des cultures dédiées d’espèces végétales à croissance rapide avec les espèces herbacées (miscanthus, panic érigé) ou ligneuses (peuplier, saule).
- 18 -
Au Québec, le saule a montré un intéressant potentiel pour la production de quantités importantes de biomasse de bonne qualité tout en pouvant s’adapter à des terres marginales (Labrecque and Teodorescu, 2003). De plus, sa culture requiert de faibles coûts d’opération et peut être réalisée avec des équipements agricoles conventionnels (Guidi et al. 2013). Le potentiel des saules comme ressource en bioénergie est exploité au Québec depuis le début des années 1990 (Labrecque M. et al. 1993; Grislis and Labrecque 2009). Ces travaux antérieurs ont permis d’optimiser les techniques de culture de saule: préparation du site, technique de récolte de la biomasse, gestion des maladies, amendement du sol, densité de la plantation, etc. (Guidi et al. 2013). Les préférences pédoclimatiques du saule ont aussi été caractérisées (Guidi
et al. 2013). Le saule nécessite un milieu ayant une bonne rétention d’eau comme les sols limon-argileux (Dawson, 2007). Sa culture peut atteindre des rendements exceptionnels dans des conditions de culture et de maintenance optimales. Il a été montré, qu’à partir d’une simple bouture plantée à même le sol, des rendements de production dépassant 60 tonnes de biomasse par hectare ont été obtenus après un cycle de 3 ans. Toutefois, en moyenne, la production annuelle par hectare sous les conditions pédoclimatiques du sud du Québec est d’environ de 12 à 15 tonnes (Guidi et al. 2013). Le saule présente aussi l’avantage d’être valorisable dans de nombreux secteurs outre la bioénergie comme la protection des berges, la fabrication de murs anti-bruit, la remédiation de sites contaminés ou le compostage. Les plantations de saules peuvent aussi être une voie de valorisation des boues agricoles ou d’eaux usées, riches en azote et phosphore. Par exemple, l’épandage de 60m3 de lisier de porc à l’hectare a permis d’augmenter la biomasse de Salix miyabeana de 18% (Cavanagh et al. 2011). Le même constat a été fait lorsque deux cultivars de saules, Salix viminalis et Salix discolor, ont été alimentés en boues d’épuration (Labrecque and Teodorescu, 2001). La biomasse des cultivars a augmenté quel que soit la densité de plantation testée et le type de sol présent (Labrecque et al. 1997). Des différences de rendement en biomasse ont été observées entre les génotypes de saule plantés dans les mêmes conditions (Tharakan et al. 2005). Chaque génotype répondant différemment à l’environnement, une sélection des plus performants s’est ainsi faite en Europe et en Amérique du Nord pour améliorer le rendement de productivité à l’hectare (Larsson 1998; Labrecque and Teodorescu, 2005).
- 19 -
Le potentiel de production de biomasse par surface de culture est désormais assez bien répertorié selon les conditions de culture et le génotype considéré (Kopp et al. 2001; Volk et al. 2011). Par contre, pour évaluer le potentiel d’une plantation en bioénergie, il est nécessaire de connaître les facteurs affectant la composition chimique et anatomique du bois. Dans la présente étude, l’influence des facteurs environnementaux sur les propriétés du bois a été évaluée pour cinq cultivars de saule sur quatre sites contrastés de par leurs conditions pédoclimatiques.
- 20 -
Chapitre 2 – Objectifs et hypothèses
2.1 Objectifs
1- Analyser les extractibles, les composés phénoliques et la lignine de différents génotypes de saules cultivés sous des conditions pédoclimatiques différentes.
2- Déterminer les conséquences de ces conditions au niveau d’un génotype de saule sur les caractéristiques des fibres et vaisseaux du bois ainsi que la proportion des fibres gélatineuses.
3- Caractériser le lien qui pourrait exister entre les changements dans les caractéristiques du bois et les conditions de culture (pédoclimatiques).
2.2. Hypothèses
1- La hauteur et le diamètre de la tige augmentent selon le génotype considéré avec des conditions environnementales de croissance favorables contrairement à la densité du bois ainsi qu’aux teneurs en lignine et en polyphénols
2- Les stress abiotiques affectent l’anatomie du bois en diminuant la taille des fibres et en augmentant celle des vaisseaux et le taux de fibres gélatineuses.
- 21 -
Chapitre 3 – Contexte méthodologique
3.1. Zone d’étude
En 2011, le Réseau de plantes bio-industrielles du Québec (RPBQ) a été mis en place pour étudier le potentiel de rendement de plusieurs espèces végétales dont le saule. Pour la filière du saule, huit plantations ont été établies à différents endroits au Québec de la Gaspésie à l’Abitibi. Quatre de ces sites ont été sélectionnés dans le cadre de nos recherches : Saint-Roch de-l’Achigan, Beloeil, La Pocatière et Saint-Siméon (Fig.3.1). Leurs localisations géographiques représentent un gradient Est-Ouest de conditions environnementales distinctes sur une distance de plus de 900km le long du Saint Laurent jusqu’à l’océan Atlantique.
Fig.3.1 : Carte des sites sélectionnés
3.2. Dispositif expérimental
Cinq cultivars de saule (Salix viminalis 5027, S. dasyclados SV1, S. miyabeana SX61, S. miyabeana SX64, S. miyabeana SX67) ont été plantés sur chaque site suivant les principes de la culture intensive sur courtes rotations (CICR) et ont été maintenus selon un protocole bien
- 22 -
précis et similaire pour chacun des sites. Un dispositif expérimental en bloc aléatoire complet a été établi sur chacun des sites. Chaque bloc comportant les cinq cultivars regroupés en cinq parcelles distinctes aléatoirement distribuées dans le bloc. Chaque parcelle d’un cultivar donné comportait cinq rangées de saules avec un espacement de 30cm entre les plants sur les rangs espacés de 1,80 m. Dans chacun des rangs, vingt boutures ont été mises en terre, pour un total de 100 plants par cultivar par bloc (soit 400 plants par cultivar par site). Mis en terre au printemps 2011, tous les plants ont été recépés à la fin de leur première saison de croissance en respect des pratiques de culture.
Fig.3.2 : Répartition des cultivars sur le site de Saint Siméon
3.3 Caractéristiques et suivi des sites
Au démarrage du projet, les conditions climatiques de chaque site ont été caractérisées : température annuelle moyenne, précipitation annuelle moyenne, température et précipitations totales annuelles ainsi que le degrés-jour annuel. Les caractéristiques des sols ont également été analysées pour les paramètres suivants : pH, matière organique, phosphore, potassium, calcium, magnésium et aluminium. La texture du sol a aussi été prise en compte.
Un suivi impliquant l’évaluation du taux de survie des plants a été fait à chaque année. La présence et l’identification des insectes potentiellement nuisibles ainsi que le pourcentage de
SX64
5027 SX61
SV1
Bloc 1 Bloc 2 Bloc 3 Bloc 4
- 23 -
défoliation des plants ont été relevés chaque été. Aucune attaque majeure d’insectes n’a été cependant signalée sur les plantations. Enfin, la croissance en hauteur et en diamètre a été mesurée chaque fin d’année pendant la période octobre / novembre.
Fig.3.3 : Vue de la plantation de saules à la Pocatière – Été 2013
3.4 Analyses des propriétés du bois
Durant l’été 2013, des échantillons ont été prélevés sur chacun des blocs des quatre sites afin de caractériser la composition du bois par analyse du taux d’extractibles et des teneurs en lignine et polyphénols. La densité du bois a également été déterminée. Les caractéristiques anatomiques d’un cultivar (SX64) provenant de deux sites (Saint-Roch de-l’Achigan et La Pocatière) ont été évaluées par le nombre de vaisseaux par mm2, le diamètre des fibres et la proportion des fibres gélatineuses riche en cellulose sur l’ensemble de la section de la tige sur des échantillons collectés durant l’été 2014.
Les résultats de cette étude sont présentés au chapitre suivant (Chapitre 4) qui correspond à l’article scientifique élaboré dans le cadre de ce projet. Dans cet article, plus de détails sur les méthodes, notamment les méthodes analytiques, sont également présentées. Le manuscrit sera soumis sous peu à BioEnergy Research.
- 24 -
Chapitre 4 – Résultats
Five willow varieties cultivated across diverse field environments
reveals high stem density variation with an association to high tension
wood abundance
Nicolas Berthod, Nicolas Brereton, Frédéric E. Pitre and Michel Labrecque
Institut de Recherche en Biologie Végétale, 4101 Sherbrooke East, Montreal Quebec, Canada, H1X 2B2
4.1. Introduction
Renewable energy, such as lignocellulosic biofuel derived from sustainably sourced biomass, could play an important role in offsetting the deleterious global impacts of fossil fuel use. Biomass combustion has long been used to produce heat and electricity, and already accounts for more than 10% of global energy consumption [1]. Plant species with the potential for particularly high biomass yields in temperate climates include short rotation coppice (SRC) willow [2]. While being high biomass yielding, SRC willow also has a number of advantageous properties in terms of sustainability and environmental impact, such as low fertilizer requirements, high stress tolerance (surviving on marginal or even polluted land) as well as positive effects on biodiversity [3-4].
Wood is the majority of harvested biomass and is composed of xylem rich in fibre cells with thick secondary cell walls. These secondary cell walls are composed of a complex cross-linked polymer matrix including: lignin, cellulose and hemicelluloses; together endowing the plant with properties such as: strength and protection against pathogens. Easy access to the sugar monomers within the cell wall matrix to be used for fermentation into ethanol is necessary to make biofuel production feasible, but represents a challenge [5-7]. Lignin is not the targeted polymer in either the pulp and paper or biofuel industries, so reducing its content without
- 25 -
compromising tree integrity is often thought to be important to increase process efficiency [8]. However, in addition to reducing lignin content, improvement to the accessibility of cellulose would also benefit such industries by reducing processing energy requirements. Mechanical stimuli, such as wind, have been shown to induce modification of wood anatomy in willow, which creates a unique type of xylem tissue (tension wood) aligned with the direction of the mechanical force. Recently, this tension wood has been found to be rich in accessible cellulose [9-11].
Willows show substantial genotypic variability in regard to biomass production [12-13]. However, when the fate of biomass is biofuel, the ability to release cell wall sugar is also of great importance as well as biomass yield alone [10-11]. Moreover, the impact of environmental factors such as stress (drought, salinity, pollution) or stimuli (wind, radiation) on growth and developmental strategy may also vary by genotype [14-16].
Wood density is an important factor to consider in the context of biomass production for bioenergy as high density biomass can translate into high heating value [17]. Less is known about the importance of density relating to biofuel potential. Wood composition and architecture both influence density [18-19]. A number of developmental factors could individually or collectively influence wood architecture: cell division, cell expansion as well as tissue patterning [20]. Density could therefore represents multiple and varying responses to a specific environment, that manifest differently within each genotype. However, to date only a few studies have examined wood density in relation to wood composition and architecture in fast growing woody species (Populus, Salix) from contrasting environments [11, 21].
The aim of this study was to investigate the density variability of five genotypes of two-year old willows on four sites in the province of Québec (Canada), the differential impact of the environment on genotypes in regard to this characteristic, and its association with wood composition and anatomy.
- 26 -
4.2. Material & Methods
4.2 a) Experimental sites
The willow plantations were established in the spring of 2011 by the Réseau des Plantes Bio-industrielles du Québec (RPBQ), a network to develop bio-industrial crops in the Province of Québec (Canada). The experiments were carried out at four sites representing a range of environmental conditions along the Saint Lawrence River near the communities of Beloeil (B) 45°35’32.8 N - 73°14’46.7 W, Saint-Roch-de-l’Achigan (SR) 45°48’56.5 N - 73°39’08.8 W, La Pocatière (LP) 47°21’05.1 N - 70°01’35.6 W. and Saint-Siméon (SS) 48°05’11.2 N - 65°35’11.1 W (Fig. 4.1).
Five high biomass yielding [12, 22] willow genotypes were established in four randomised blocks: Salix viminalis 5027, S. dasyclados SV1, S. miyabeana SX61, S. miyabeana SX64, S. miyabeana SX67. Soil from each site was sampled in 2011 by RPBQ whereas climate data was collected from Environment Canada weather stations in 2013 (Table IV.I). Fertilizer high in nitrogen was applied to all sites to buffer site variation (100 kg N per hectare).
4.2 b) Tree morphology and density
Six trees per cultivar, in the second year of their harvest cycle, were sampled randomly within a single block. Stem number, the tallest stem and largest stem base diameter was measured for each tree.
Two classical methods for determining stem density were compared using water displacement to assess stem volume; basic density and oven dry specific gravity [23] using biomass from two of the sites, B and SS. Density, which varied substantially between sites, reflected the same pattern regardless of method type. Basic density was 15-23 % lower than oven dry specific gravity in absolute amount in all cases. Oven dry specific gravity alone was used for the remainder of the samples.
- 27 -
4.2 c) Wood composition
Wood samples were air dried before being ground through a 40-mesh (<525µm). Extractives were determined following the standard procedures ASTM D1107-16 and ASTM D1110-84. Ten grams of wood were extracted first with toluene/ethanol and then with water over a period of 7h using Soxhlet apparatus.
Lignin content was determined following standard Klason procedures ASTM D1106-96 for acid insoluble lignin and NREL LAP-004 for acid soluble lignin. Briefly, 300mg of extractives free sample was hydrolysed in 72% sulfuric acid for 2h at 30°C before dilution with 84mL water and autoclaving at 120°C for 1h. Samples were then filtered; acid insoluble lignin being determined by weight whereas acid soluble lignin was determined via spectrometry. Phenolic content was extracted by sonication of 500mg of sample in methanol, and separation by centrifuged for 15min at 4800rpm repeated three times. Phenolics were then quantified using the modified Prussian blue colorimetric method [24-25], using UV spectrophotometer absorbance at 700nm compared to a gallic acid standard.
4.2 d) Microscopy
Stem samples of Salix miyabeana SX64 were collected in the summer of 2014 at La Pocatière (the site with lowest wood density values) and at Saint-Roch de-l’Achigan (highest density values). Samples were fixed in FAA (Formaldehyde – Acetic Acid – Ethanol) and sectioned at 40µm using a sledge microtome. Sections were then stained with 1% aqueous Safranin O (staining lignified cell wall) and 1% Chlorazol Black E in methoxyethanol (staining cellulose). Image analysis was conducted using QCAD drawing software and Image J image analysis software using triplicate biological samples for each site.
Transverse section g-fibres coverage was measured using four different methods. Method A (manual) involved manual drawing of stained g-fibre area using QCAD. Method B (pixel distribution) quantified the number of pixels binned by grayscale (an intensity scale of 0 to 254; zero being black, 254 being white) in a bin chosen based on observed pixel distribution (0 to 100), of transverse wood sections from 3 trees per site using Image J. Method C (blind
- 28 -
distribution) quantified the number of pixels in the same manner, binned by grayscale (0 to 254) in a bin chosen blindly as half the scale intensity (0 to 127). Method D (black and white) was used to count black pixels, stained with chlorazol black, of monochrome (Black/White) transverse wood images, again using Image J.
4.2 e) Statistics analysis
Analyses of variance (ANOVA) followed by Tukey’s honestly significant difference (α < 0.05) were performed to determine statistical differences of diameter, height, density, wood composition and anatomical data. JMP (SAS Institute, Inc.) was used to analyze correlation coefficients between wood traits by site.
4.3 Results
4.3 a) Tree morphology and composition
The environmental climate of each of the four sites varied (Table IV.I) in regard to temperature, precipitation, wind and growing degree days (GDD correspond to days with temperatures higher than 5°C) [26]. B and SR had the largest number of GDD and warmer annual temperatures than LP and SS. Such variation resulted in differences in a number of growth traits in the five Salix cultivars tested. At La Pocatière (LP) and Beloeil (B), trees were significantly (p<0.05) taller (420cm and 413cm, respectively) than those at Saint-Roch-de-l’Achigan (SR) (312cm) and Saint-Siméon (SS) (257cm) when all trees were averaged regardless of genotype (Fig. 4.2a). Stem diameter at B and LP was also significantly (p<0.05) larger (31mm and 28mm, respectively) than at SR (22mm) and SS (16mm) (Fig. 4.2b). There was a general trend between genotypes across the four sites: genotype SX61 had larger stem diameters (27.7mm SE 3.7) and heights (405.7cm SE 37.2) than the other cultivars. However, comparing genotypes within site, this pattern did not always persist. For example, at SR, no significant variation was observed between genotypes for diameter or for height, except in 5027 (Fig. 4.2).
- 29 -
Wood extractives content varied significantly (p < 0.05, ANOVA F-test) between genotypes and sites. Extractives were higher in all trees cultivated at SS (14.5% SE 0.5) and SR (13.1% SE 0.1) (Fig. 4.3a), almost double that of B and LP, which had 7.1% and 8.7% extractives, respectively. Within extractable compounds, substantially more polyphenols were produced from a single site (SR) than any other, and by a single genotype (SX67), with 4.28 mg (total for the 5 cultivars at SR) and 7.39 mg (SX67 average at SR) g-1 gallic acid equivalent respectively (Fig. 4.3c). Significant differences in total lignin content were not observed between or within the sites (Fig. 4.3b).
4.3 b) Density
When all the genotypes in a site were averaged, trees cultivated at SR and SS had significantly (p < 0.05, ANOVA F-test) denser wood stems, with means of 0.607g/cm3 and 0.580g/cm3 respectively, compared to B and LP, with means of 0.543g/cm3 and 0.516g/cm3 (Fig. 4.4). The same genotype rank order (1- SV1; 2- SX64; 3/4- 5027/SX67; 5- SX61) was consistent at every site but there was substantial variation in density between sites. Considering only those sites with the highest and lowest densities, SR ranged from 0.71 g/cm3 (SV1) to 0.54 g/cm3 (SX61), whereas at LP they ranged from 0.59 g/cm3 (SV1) to 0.44 g/cm3 (SX61) revealing some genotypes, grown under different conditions, had at least the capacity to increase by 60% in density.
4.3 c) Wood anatomy
Wood anatomy was characterized from three trees of a single genotype, SX64, from each of two sites: LP (lowest density site) and SR (highest density site). The genotype was chosen as it varied the most in terms of density between these two sites (Fig. 4.4). The pith to secondary xylem ratio of the SX64 stems at LP were over five times larger (20.7 % SE 1.12, of the transverse area) than those of SR (3.6% SE 0.23) (Fig. 4.5a). There were more vessels per surface area unit (1mm2) at SR (193, compared to 136 at LP), whereas fibres had a larger average diameter at LP, 13.8µm as opposed to 12µm at SR.
- 30 -
We determined gelatinous fibre (g-fibre) abundance (a characteristic of tension wood) through specific staining of the gelatinous layer (g-layer) and image analysis of the biologically replicated samples (n = 3). As this type of site comparison of proportional (net stem) g-fibre quantification is relatively novel for mature field-grown trees (to our knowledge, most having been pot studies to date), four different methods were assessed to ensure confidence in quantification. Based on the results of these four methods, wood grown in SR had significantly and substantially more g-fibres than LP (Fig. 4.5b). Based on method A, SR had twice as many observed g-fibres, with 50% of the tissue being g-fibre containing compared to 25% at LP. Using method C, transverse polarization (ie. Tissue patterning) of the g-fibres were determined by dividing the wood stem section into two parts (Fig. 4.6a). Significant and substantial variation in tissue patterning was observed between sites, with TW always being produced somewhere across the stem at SR but with no clear polarization (no clear “upper” or “lower” side of the stem from a transverse perspective) (Fig. 4.6b). At the LP site (which uniformly produced less dense wood as well as substantially less TW), clear polarization was observed with no TW produced during some points of the growing season, no significant TW polarisation was observed in the high density wood from the SR site
4.4 Discussion
4.4 a) Site influence on growth and wood composition
Tree development alters in response to the surrounding environment. Multiple abiotic and biotic factors can affect this response in woody plants, including nutrient availability, soil, climate, competitors, predators and available space [27]. In our trials, B and LP showed induced similar morphological growth, with trees on these sites becoming taller and greater in diameter than those at SS and SR. The number of GDD has been correlated (positively) to biomass production in Finland by Tahvanainen and Rytkönen [28]. However, here, if we consider height and diameter to be predictors of biomass yield, such a relationship is not obvious as SS and SR represent the different extremes of the spectrum for GDD. Located near the Saint Lawrence River, LP is reported to be a comparatively windy site. As wind has been shown to sometimes
- 31 -
affect tree morphology, inducing development of shorter and stronger trees in a process called thigmomorphogenesis [29], LP could be expected to display such morphology, surprisingly this was not the case. Since fast growing willows have high water requirements [30], the lower amount of precipitation recorded on the LP site may reflect inadequate water supply. However, precipitation during this growing season should have been sufficient for willow’s needs (> 430mm) according to data reported by Lindroth and Cienciala [31] whilst such climatic differences between sites are clear, in terms of variation in genotype development, the single most influential environmental factor could not be separated here.
B and SR present similar climatic conditions but distinct soil properties. SR soil contained comparatively less potassium and magnesium than B and LP, two elements important in plant physiology [32-33]. SR is located on former agricultural land where a large amount of calcium carbonate was added to the soil to reduce aluminum toxicity associated with acidity [34]. Calcium was therefore found to be much more abundant on this site than on the others. While this nutrient is beneficial for plants, playing a role in intracellular signal and wood formation [35], it is potentially cytotoxic in excess, affecting roots in soil and reducing growth rates [36]. Comparing sites LP and B, the former had a phosphorus level (essential in many compound molecules such as nucleotides, phospholipids and sugar phosphates [37] three times that of B. Both potassium and phosphorus can have an impact on tree growth; Hytönen and Kaunisto [38] reported that combined phosphorus and potassium fertilisation can increase willow biomass yields by 64%. With smaller diameter and shorter trees comparatively, SS was also found to have acidic soil, with less organic content, potassium, phosphorus and magnesium, which suggests a deleterious impact of the nutrients at these concentrations on growth.
Surprisingly, lignin values were not significantly different between the four sites (Fig 4.3b), suggesting the cell wall response to environment here may not be driven by variation in lignin content. Swan and Kellogg [39] also found no significant variation in lignin content of poplar collected from three different locations in British Columbia, Canada. Serapiglia et al [16] also found only two out of 17 willow cultivars had significant differences in lignin content between two contrasting environments in New York State (USA). This is in stark contrast to clear variation in lignin content between genotypes, observed here and in other willow studies
- 32 -
[40-43]. It is interesting to note such large changes in wood development and architecture without substantial (net) effects to an important cell wall element such as lignin.
Trees grown at SR had more extractable polyphenols than those grown at other sites. Polyphenol biosynthesis can be induced in trees by stress, such as biotic stress related to herbivore attack [44-46]. Water and nutrient availability in soil have also been shown to affect polyphenol concentrations in such trees; Price et al [47] and Osier and Lindroth [48] observed phenolic glycoside variation in willow was dependant on soil nutrient availability. No extensive insect herbivory was reported during the growing season at SR, it is therefore possible, given the high calcium concentration measured at the site, that the extraordinary abundance in polyphenols could be driven by soil properties or nutrient availability. Variation in extractives was also observed between sites in our trials. Increases in extractives at SR, compared to B and LP, might be explained by the abundance of phenolics. Trees on SS also contained more extractives than those at B and LP, however, phenolic content was not greatly increased (as in SR), implying variation of non-phenolic extractables such as: sugars, proteins, phospholipids or other secondary metabolites.
4.4 b) Genotypic variation among wood traits
Over the two-year cycle from 2012-2013, SX61 grew over 30% taller and greater in diameter than 5027, which suggests that the former genotype should be preferentially selected if diameter and height were used as a proxy for biomass yield. Genotype selection is an important first step for developing high-performing crops suitable for biomass or biofuels. Willow cultivars have previously been shown to exhibit broad differences in biomass productivity [12, 49]. In the field, Serapiglia et al [16] identified a genotype x environment interaction on two contrasting sites. However, height and stem diameter may not be measures that represent biomass most accurately, considering the extreme variation in density.
Extractable polyphenols are a potential source of high value molecules (tannins, salicylic acid) and, once extracted from wood and purified, could generate additional revenues for biomass and biofuel industries [50]. One specific cultivar, SX67, produced larger amounts of
- 33 -
polyphenols than the other genotypes regardless of site (Fig. 4.3c), indicating that genotypes could be selected to increase yields of such high value molecules.
4.4 c) Density variability of wood properties
Wood density is a common measure in the forest industry because it represents a useful parameter for calculations related to biomass transport and feedstock processing. In ecology, it is frequently used as a predictor of carbon allocation and mechanical strength [51-52]. Large differences in wood density were identified among the four study sites. Wood from LP and B was, in general, less dense than that from SR and SS.
Basic density was negatively correlated with the growth traits of stem diameter and height in trees grown at SS, a relationship repeatedly seen in other trials [52-54]. The differences observed in density, both between sites and genotypes (Fig. 4.4); suggest that, in this case, height and diameter would not be accurate indicators for predicting biomass yield in willow. In fact, considering the negative correlation of stem height and diameter with the extreme differences in density, they may actually directly contradict real yields. Destructive harvesting across all genotypes and sites is needed to definitively establish the usefulness of these proxies in predicting biomass yield and these density data suggest such research is necessary.
High-density wood has been associated with pathogen attack resistance [55]. We could therefore potentially expect to find a correlation between density and secondary metabolites used in plant defense, such as phenolics. A similar genotype pattern was observed across all sites: SV1, SX64, 5027, SX67 and SX61. Cultivar variation in wood density has been previously reported in willow [56-57] and in poplar [58] and variability between sites was observed in previous studies [54], suggesting a genotype-specific response in relation to the environment. The strong and consistent behaviour of genotypes observed here for this trait led us to explore anatomy in the hope of revealing the origin of such patterning. One of the major anatomical factors known to greatly affect density in willow is reaction wood formation [18].
- 34 -
4.4 d) Relationship between stress and wood anatomy
The developmental response of trees to mechanical stress by altering wood morphology, called thigmomorphogenesis, has been extensively studied [59-60]. Telewski [61] observed increases in wood density aligned with increased ethylene produced in pines, and associated such increases in ethylene to the trees response to mechanical disturbance [62]. One explanation for the large variation in wood density here could be the difference in pith size found between SR and LP. As well as this, another substantial anatomical difference was observed (Fig. 4.6a). Wind is thought to be one of the principle inducers of mechanical stress in the environment, often mimicked in greenhouse experiments by bending or tipping trees, and results in the production of a specific type of wood, termed reaction wood, often characterised by a cellulose rich tissue layer called tension wood (TW) [10, 11, 29, 63].
The site at LP, defined as a comparatively windy site, was found to have a large and polarized proportion of TW (presumably localised to the “upper” part of the stem), suggesting the influence of “directional” mechanical force (Fig. 4.6a). Although potentially subjected to higher mechanical stress (via increased wind speeds), surprisingly, LP had half the TW of SR. TW was observed in extraordinary amounts in wood from SR, with over 50% of wood on average in all the samples from this high density genotype grown in SR containing the cellulose rich g-fibres. Recent evidence suggests that the cellulose present in gelatinous fibres (g-fibres) of TW is easily accessible to digesting enzymes and may be of high value to the lignocellulosic biofuel industry [11]. Tension wood production has almost exclusively been reported as a response to a mechanical or gravity stimulus. The comparatively low wind speed and lack of clear polarisation at SR (Fig. 4.6b) suggests induction of reaction wood was not wind induced as the classical model would presume. This type of adaptation within wood anatomy, driven by environmental stress, might point to a new source of TW induction: non-mechanical stress.
An increase in the number of vessels and decrease in fibre cells was also found at SR (Fig. 4.5a), a pattern described by Escalante-Perez et al [64] in poplar exposed to salinity stress; their change in wood structure was explained by the effect of K+ on cell expansion. Less expansion can result in smaller fibre cell diameters, imparting greater density in the xylem as a whole. Wood exposed to high salinity environments has been shown to have altered vessel morphology, resulting in their reduced diameters [65] and to result in reinforcement of
- 35 -
secondary cell walls, increasing their thickness [51]. The interdependence of vessel morphology (for hydraulic architecture) and fibre morphology (for mechanical structure) has recently been suggested as potentially linking traits such as water stress and TW production [18]. Altered salt concentrations have also directly been shown to interact with tension wood formation by Janz et al [66] who found that poplars subjected to salt stress formed a novel type of wood, ‘pressure wood’, where genes know to be involved in tension wood formation were down-regulated. The authors also noted up-regulated elements of the phenylpropanoid pathway, in line with the high polyphenol content found at SR and so providing a clue as to the potential origin of such high TW production.
4.5 Conclusions
The environment of willow cultivation had large effects on both tree morphology and internal wood structure. These effects were complicated by genotype-specific responses in traits such as tree height, stem diameters, polyphenolic content as well as substantial differences in density between the four sites investigated. Surprisingly, given the complex genotype-specific variation, wood density seemed a uniquely consistent trait in that the ranking of genotypes remained constant across all the sites, suggesting consistent genetic regulation.
Although net lignin content of wood did not vary to any considerable extent, TW was observed in extraordinary amounts in high density wood of a specific genotype. While the direct benefit to cell wall polysaccharide accessibility needs to be explored, such drastic changes to cellulose construction throughout the entirety of the wood, without any observable detriment to the growth of these fully mature crops, presents an exciting opportunity to exploit natural developmental responses to improve crop selection for biofuel production.
- 36 -
4.6. Tables
Table IV.I – Comparison of site characteristics (single soil sample analyzed in 2011 and climate data collected for 2013 from Environment Canada) at each of the four sites (Saint-Roch-de-l’Achigan, Beloeil, Saint-Siméon and La Pocatière).
- 37 -
4.7. Figures
Figure 4.1 – Site localization in Québec province, Canada: Saint-Roch-de-l’Achigan (SR), Beloeil (B), Saint-Siméon (SS) and La Pocatière (LP).
- 38 -
Figure 4.2 – Tree height (a) and stem diameter (b) from five willow cultivars in their second year of a harvest cycle (Salix viminalis 5027, S. dasyclados SV1, S. miyabeana SX61, S. miyabeana SX64, S. miyabeana SX67) sampled at four field trials in Québec: Saint-Roch-de-l’Achigan, Beloeil, Saint-Siméon and La Pocatière. Error bars represent standard error, n = 4 blocks (6 trees per block). Tukey's Honestly Significant Difference (HSD) pairwise post hoc test (α = 0.05) are represented by letters a - c.
- 39 -
Figure 4.3 – Five willow cultivars in their second year of a harvest cycle (Salix viminalis 5027, S. dasyclados SV1, S. miyabeana SX61, S. miyabeana SX64, S. miyabeana SX67) sampled at four field trials in Québec: Saint-Roch-de-l’Achigan, Beloeil, Saint-Siméon and La Pocatière. a) Variation in extractives (toluene-ethanol/water extraction); b) lignin content expressed as a percentage of dry matter and c) total polyphenolics content (methanol-extractable). Error bars represent standard error, n = 4 blocks (4 trees per block). Tukey's Honestly Significant Difference (HSD) pairwise post hoc test (α = 0.05) are represented by letters a - b.
- 40 -
Figure 4.4 – Stem density was assessed using oven dried specific gravity (grams per cubic centimeters) from five willow cultivars in their second year of a harvest cycle (Salix viminalis 5027, S. dasyclados SV1, S. miyabeana SX61, S. miyabeana SX64, S. miyabeana SX67) sampled at four field trials in Québec: Saint-Roch-de-l’Achigan, Beloeil, Saint-Siméon and La Pocatière. Error bars represent standard error, n = 4 blocks (4 trees per block). Tukey's Honestly Significant Difference (HSD) pairwise post hoc test (α = 0.05) are represented by letters a - d.
- 41 -
Figure 4.5 – SX64 cultivar (S. miyabeana) in its third year of a harvest cycle sampled at two field trials in Québec: Saint-Roch-de-l’Achigan and La Pocatière. a) Measured Anatomical traits: i) pith proportion, ii) fiber cell diameter and iii) vessels number per 1mm2; b) Variation of G fibers determined by different image analytical methods: Method A (Manual) involved manual drawing around stained g-fibre, Method B (Pixel distribution) quantified pixels in a bin from 0 to 100, Method C (Blind distribution) quantified pixels in a bin from 0 to 127 and Method D (Black & White) count black pixels of monochrome. Error bars represent standard error (n = 3 trees). All comparisons between Saint Roch and La Pocatiere presented in this figure are significantly different (t-test, p < 0.05).
- 42 -
Figure 4.6 – a) 40μm transverse section of a stem from SX64 cultivated at Saint-Roch de l’Achigan (left – most dense) and at La Pocatière (right – least dense). Stained in 1% Chlorazol Black E in methoxyethanol and 1% aqueous Safranin O. b) Polarization of G fibers determined by Method C (Blind distribution) from SX64 cultivar (S. miyabeana) in its third year of a harvest cycle sampled at two field trials: Saint-Roch-de-l’Achigan and La Pocatière. Error bars represent standard error (n = 3 trees). All comparisons between Saint Roch and La Pocatiere presented in this figure are significantly different (t-test, p < 0.05).
- 43 -
4.8. References
1. IPCC (2012) Special Report on Renewable Energy Sources and Climate Change Mitigation. Prepared by Working Group III of the Intergovernmental Panel on Climate Change (Edenhofer O. et al.). Cambridge University Press, Cambridge, United Kingdom and New York, NY, USA, 1075 pp.
2. Labrecque M, Teodorescu T (2003) High biomass yield achieved by Salix clones in SRIC following two 3-year coppice rotations on abandoned farmland in southern Quebec, Canada. Biomass Bioenerg 25(2):135–146
3. Labrecque M, Teodorescu T, Cogliastro A, Daigle S (1993) Growth patterns and biomass productivity of two Salix species grown under short-rotation, intensive-culture in south western Quebec. Biomass Bioenerg 4(6):419–425
4. Karp A, Shield I (2008) Bioenergy from plants and the sustainable yield challenge. New Phytologist 179: 15-32
5. Taherzadeh MJ, Karimi K (2008) Pretreatment of Lignocellulosic Wastes to Improve Ethanol and Biogas Production: A Review. Int J Mol Sci 9:1621-1651
6. Zhu JY, Pan X, Zalesny Jr RS (2010) Pretreatment of woody biomass for biofuel production: energy efficiency, technologies, and recalcitrance. Appl Microbiol Biotechnol 87:847–857
7. Limayem A, Ricke SC (2012) Lignocellulosic biomass for bioethanol production: Current perspectives, potential issues and future prospects. Progress in Energy and Combustion Science 38:449-467
8. Simmons BA, Loqué D, Ralph J (2010) Advances in modifying lignin for enhanced biofuel production. Current Opinion in Plant Biology 13:313–320
9. Bowling AJ, Vaughn KC (2008) Immunocytochemical characterization of tension wood: gelatinous fibres contain more than just cellulose. Am J Bot 95:655–663
10. Brereton NJB, Pitre FE, Ray MJ, Karp A, Murphy R (2011) Investigation of tension wood formation and 2,6-dichlorbenzonitrile application in short rotation coppice willow composition and enzymatic saccharification. Biotechnology for Biofuels 4:13
11. Brereton NJB, Ray MJ, Shield I, Martin P, Karp A, Murphy R (2012) Reaction wood – a key cause of variation in cell wall recalcitrance in willow. Biotechnology for Biofuels 5:83