O R I G I N A L A R T I C L E
The potential of major ion chemistry to assess groundwater vulnerability of a regional aquifer in southern Quebec (Canada)
G. Meyzonnat
1•M. Larocque
1•F. Barbecot
1•D. L. Pinti
1•S. Gagne´
1Received: 7 January 2015 / Accepted: 7 July 2015 / Published online: 21 December 2015
ÓSpringer-Verlag Berlin Heidelberg 2015
Abstract Groundwater vulnerability mapping provides useful but limited information for developing protection plans of the resource. Classical vulnerability ranking methods often do not take into account complex hydros- tratigraphy and never consider groundwater flow dynamics.
The objective of this work was to test the potential of major ion chemistry to assess regional-scale intrinsic groundwater vulnerability. Because it reflects water–sediment and water–rock interactions, the new vulnerability index reflects both infiltration processes and groundwater hydrodynamics. The method was applied on a regional fractured bedrock aquifer located in the Becancour region of southern Quebec (Canada). In this region, hydrogeo- chemistry shows that freshly recharged groundwater evolves from (Ca, Mg)–HCO
3and Ca–SO
4to Na–HCO
3type with gradually increasing confinement conditions in the fractured aquifer and tends to Na–Cl type locally by mixing with trapped marine pore-water. The new method identified recharge areas as those of the highest vulnera- bility and gradually decreasing vulnerability as confine- ment of the aquifer increased. It also highlights local discontinuities in confinement that differ from the regional pattern. Results showed a good correlation between groundwater vulnerability estimated with the new method and nitrate occurrence in groundwater. Eighty-two per cent of all samples presenting detectable nitrate concentrations were characterized by a Hydrogeochemical Vulnerability Index greater than 9 (maximum is 10). The ability of the
new vulnerability method to identify areas vulnerable to detectable nitrate concentrations was much higher than that deriving from the DRASTIC method. This work confirms that major ions chemistry contains significant information about groundwater vulnerability and could be used to improve groundwater resource management.
Keywords Groundwater Vulnerability
Hydrogeochemistry Fractured bedrock aquifer Quebec (Canada)
Introduction
In the last decades, worldwide increases in groundwater contamination (UNEP 2003) have brought attention to the concept of groundwater vulnerability and led to the development of specific mapping techniques. Groundwater vulnerability is generally defined as the capacity of a hydrogeological system to transfer a contaminant from the land surface to the saturated zone. This concept is contin- uously evolving, and several definitions have been pro- posed. For example, intrinsic vulnerability (Vrba and Zoporozec 1994) and intrinsic sensitivity (EPA 1993) usually refer to groundwater vulnerability due to the hydrogeological context independently of land use or any information about the spatial distribution of potential sources of contamination. The specific vulnerability (An- drade and Stigter 2009) integrates contaminant-specific parameters, such as half-life or sorption coefficient to soil organic matter when assessing groundwater vulnerability to pesticides. In reference to the source-pathway-target con- cept, the contaminant pathway for ‘‘aquifer vulnerability’’
is the vertical path from the ground surface to the water table. When considering ‘‘well vulnerability’’ (Frind et al.
&
M. Larocque
larocque.marie@uqam.ca
1
De´partement des sciences de la Terre et de l’atmosphe`re and
GEOTOP, Universite´ du Que´bec a` Montre´al, C.P. 8888,
Succursale Centre-Ville, Montreal, QC H3C 3P8, Canada
DOI 10.1007/s12665-015-4793-9
2006), the contaminant pathway is the flow path from an upgradient source at ground surface to a given well.
Many methods are available to estimate intrinsic groundwater vulnerability. Ranking or index-based aquifer vulnerability methods such as DRASTIC (Aller et al.
1987), AQUIPRO (Chowdhury et al. 2003) or LHT (Mansoor et al. 2014) might be the easiest methods to implement using available physical data. These methods are currently widely used in water management as land-use planning tools and often reported in the scientific literature (see Saidi et al. 2010; Tilahun and Merket 2010; Chen et al.
2013; Mansoor et al. 2014 for recent applications of the DRASTIC index). However, index methods raise criticism because they often fail to predict the occurrence of con- taminants in groundwater (Mehnert et al. 2005; Stigter et al. 2008). One reason could be because indexed aquifer vulnerability methods do not take into account groundwa- ter flow dynamics, which may control the lateral migration of contaminants from the land surface to the aquifer (Kozuskanich et al. 2014). The scientific literature holds many examples of modification and adaptation of index methods intended to increase their reliability in specific contexts or to increase their efficiency to correlate with contaminant occurrence (Bojo´rquez-Tapia et al. 2009;
Zhou et al. 2012; Chen et al. 2013).
The estimation of travelling time through the vadose zone could serve as an indicator of aquifer vulnerability (Van Stempvoort et al. 1992), but requires data extrac- ted from geological 3D models which are often unavailable. At the opposite end, numerical models of solute transport through vadose and saturated zones (Yu et al. 2014) aim to represent all relevant processes influencing well vulnerability. These methods integrate flow dynamics and are very useful for assessing the risk of anthropogenic pollution to potable water supplies (Frind et al. 2006), but have large data requirements (Nobre et al. 2007).
Another way to integrate groundwater flow processes is to consider groundwater geochemistry. Major ions water chemistry (Ca, Mg, K, Na, Cl, HCO
3and SO
4) is the product of water–soil and water–rock interactions (e.g.
Barbecot et al. 2000; Saxena and Ahmed 2001). Because they depend on flow paths and on groundwater residence times, major ion facies are often used to determine the natural baseline composition of groundwater (Edmunds et al. 2003) or to distinguish between contrasted hydroge- ological contexts (Cloutier et al. 2008). Hydrogeochem- istry can also be useful to assess groundwater quality through statistical regression of chemical trends (Stigter et al. 2008). Multivariate analyses of geochemical data have been used to build groundwater quality indices and typically include solutes from natural and/or anthropogenic origin (Saeedi et al. 2009).
Hydrogeochemistry closely reflects input from recharge areas, as well as confinement conditions and groundwater travel times. It is therefore a proxy for groundwater vul- nerability. Recharge areas represent direct links between the surface and the saturated zone, characterized by a distinct water signature. Aquifer confinement usually implies a longer rock–water contact time. And, as travel time increases, the possibility of degradation (e.g. denitri- fication; see McMahon et al. 2008), cation adsorption (e.g.
on clay matrix; Andrade and Stigter 2009) and dilution within the regional aquifer flow also increase. Although groundwater quality indices are useful to distinguish more or less vulnerable areas, they mostly portray regional quality of groundwater (Sorichetta et al. 2013). Mendizabal and Stuyfzand (2011) have explicitly defined an intrinsic well vulnerability index by integrating several hydrogeo- chemical parameters (i.e. pH, redox level, alkalinity and groundwater age as pre- or post-tritium bomb peak).
However, this method does not focus on the basic evolution of the major ion composition of groundwater within vari- ous hydrogeological contexts.
Hydrogeochemistry has the potential to represent com- plex influential patterns regarding well vulnerability which otherwise could be extremely difficult to determine at the regional scale with physical approaches. The objective of this work was to test the potential of major ion chemistry to assess regional-scale intrinsic groundwater vulnerability. A new vulnerability index based on the groundwater major ions facies is applied to a regional-scale fractured bedrock aquifer located in the Becancour River watershed in southern Quebec (Canada). The vulnerability index is compared to a regional groundwater vulnerability map drawn with the DRASTIC index, and the capacity of both methods to correlate with measured groundwater nitrate concentrations is assessed.
Geological and hydrogeological setting
The study area is located in south-western Quebec
(Canada), and it covers 2920 km
2in the northern portion of
the Becancour River watershed (Fig. 1). The north-western
part corresponds to the St. Lawrence Lowlands with flat
topography and elevations below 150 masl. The south-
eastern part is located in the Appalachian Mountains and is
marked by an irregular topography reaching maximum
elevations of 500 m asl. The two regions correspond geo-
logically to the St. Lawrence Platform and the Appalachian
Mountains (Fig. 2; Globensky 1993). The Ordovician
geological units of the St. Lawrence Platform outcropping
in the study area are the Nicolet Fm. and the Sainte-Sabine
Fm. which consist of thick successions of mudstones with
subordinate alternating sandstone and siltstone. The
outcropping terrains in the Appalachian Mountains corre- spond to imbricated thrust sheets produced during the Taconian orogeny: green and red shales of the Sillery Group; bedded black weathered shaly matrix containing chaotic blocks of cherts; sandstone of the Etchemin River;
and dolomitic schists of the West Sutton Formation.
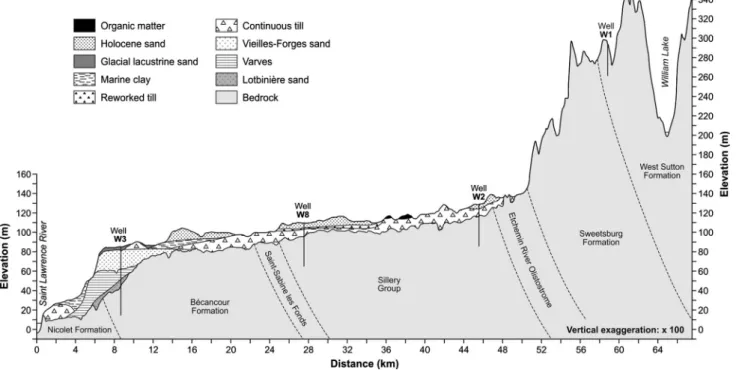
Unconsolidated Quaternary sediments, derived from multiple glaciation–deglaciation cycles, unconformly cover the Cambrian–Ordovician sequence of the St. Lawrence Lowlands (Lamothe 1989). Within the Appalachian Mountains, Quaternary deposits generally consist of rela- tively thin layers of till deposited directly on the bedrock
(Fig. 2). A more complex Quaternary stratigraphy is found in the St. Lawrence Lowlands. A nearly continuous till sheet (Gentilly till) covers most of the area between the overlain discontinuous marine and lacustrine silt (Lamp- silis Lake silts) and clay units of the Champlain Sea (9.8–11.2 ka) and the underlain discontinuous patches of sands deposited during marine regressions (Vieilles Forges and Lotbinie`re sands; Lamothe 1989) with thermolumi- nescence measured ages of 44–50 ka (Godbout et al. 2011).
Granular deposits thick enough to form aquifers are present downstream of the basin, but have limited regional extents.
Marine clay deposits are found below 120 masl where they create increasingly confining conditions for the bedrock aquifer towards the lower portion of the basin (see Fig. 3).
The regional aquifer is located in the fractured bedrock of the St. Lawrence Platform. This aquifer is mainly unconfined in the Appalachian Mountains and in the Appalachian Piedmont, progressively becoming semi- confined, north-westerly. In a 10-km-wide zone bordering the St. Lawrence River, the aquifer is confined by thick marine clays of the Champlain Sea that allow limited recharge (Larocque et al. 2013). The bedrock aquifer within the study area has relatively low hydraulic con- ductivity (*10
-9–10
-7m/s). Wells in the fractured bed- rock aquifers yield enough water to supply single-family dwellings and small municipalities (*500–5000 habi- tants). Higher-yield aquifers (*10
-3–10
-4m
2/s) are found in coarse-grained surficial sediments, such as the Quater- nary glaciofluvial or fluvial sediments. These are often
Fig. 1Becancour watershed with location of the cross section of
Fig.
2Fig. 2
SE–NW geological cross section of the Becancour watershed
separated from the fractured bedrock aquifer by a basal till unit (Becancour till; Lamothe 1989), which acts as an aquitard. Regional groundwater flow is SE–NW and usu- ally follows the topography, with recharge occurring mainly in the Appalachian Mountains and discharge in the main tributaries of the St. Lawrence River. Local recharge areas are also found in the St. Lawrence Lowlands, par- ticularly in the absence of Champlain Sea clays, along a band located just north-west of the Appalachian Piedmont.
Larocque et al. (2013) estimated the average regional recharge to be 159 mm/year.
Land use is mainly forestry (48 %) and agricultural (40 %), with the significant presence of wetlands (8 %) and few urban areas (4 %). Cereals and most intensive crops are found mainly along the St. Lawrence and Becancour rivers, while the Appalachian valleys are associated with pastures and dairy farms (see Larocque et al. 2013 for more information on land use). The average annual temperature is 4.5 °C, and the total precipitation is 1100 mm/year, with 25 % falling as snow between November and March (En- vironment Canada 2012).
Analytical methods and groundwater sampling
A total of 84 open borehole bedrock wells (79 domestic or municipality wells and five observation wells) were sam- pled in July and August 2010. Well depths range from 8 to 144 m, with a median depth of 38 m and only three wells deeper than 100 m (Table 1). This indicates that the upper bedrock is the most productive zone and is probably the bedrock through which most of the groundwater flows. In municipal wells, groundwater was collected directly at the wellhead. For domestic wells, groundwater was collected at the closest water faucet, taking precaution to avoid intermediate treatment installations. At each sampling site, purge time was set by monitoring the groundwater chemo-
physical parameters (conductivity, pH, Eh and tempera- ture) using a flow-through cell, until they stabilize.
Groundwater was sampled in 250-mL PE bottles and fil- tered in situ using disposable 0.45-lm nitrocellulose filters on 60 mL PE syringes. Samples for cation analyses were acidified with HNO
3. The samples were kept at 4 °C until their analysis at the Maxxam Laboratory in Montreal (Quebec, Canada). Major cations (Ca, Mg, Na) were analysed with ICP-MS, major anions (Cl and SO
4) were analysed by ionic chromatography, and alkalinity as CaCO
3was measured by titration method at pH 4.5.
Finally, nitrate concentration was measured with the hydrazine reduction method. Details of these analytical methods can be found in CEAEQ (2014).
DRASTIC index computation
The DRASTIC index (Aller et al. 1987) was computed using the usual seven parameters and associated parametric weights and ratings:
DRASTIC index ¼ D W
Dþ R W
Rþ A W
Aþ S W
Sþ T W
Tþ I W
Iþ C W
Cð1Þ Where D is the depth to the water table, R is recharge, A is the aquifer lithology, S is the soil type, T is the topography, I represents the impact of the vadose zone, and C is the hydraulic conductivity. Parameter weights are from Aller et al. (1987), i.e. W
D= 5, W
R= 4, W
A= 3, W
S= 2, W
T= 1, W
I= 5, W
C= 3.
The DRASTIC index was computed as suggested by Aller et al. (1987) without any adaptation of the usual method to the geological context or contaminant occur- rence in groundwater in order to neutrally apply the method. Depth to groundwater (D) was estimated by sub- tracting piezometric levels from the digital elevation model (MRNF 2008). Where the bedrock aquifer is confined, D was set equal to the bedrock depth below unconsolidated sediments. Recharge (R) was determined with a spatially distributed water balance model with a 500 x 500 m res- olution. Regional piezometric surface and spatially dis- tributed recharge to the bedrock were established by Larocque et al. (2013). The bedrock aquifer lithology (A) was determined following Globensky (1987, 1993) who reports detailed local stratigraphy of the Cambro-Ordovi- cian St. Lawrence Platform and the Appalachian Moun- tains. Soil type (S) was obtained from pedologic maps from IRDA (2012) which provides information about soil granulometry and drainage capacity to be classified with the usual DRASTIC ratings. The slope (T) was determined using a GIS treatment of a 10-m-cell resolution digital elevation model (MRNF 2008). The impact of the vadose zone (I) was determined from detailed Quaternary deposits
Fig. 3Groundwater types and bedrock aquifer confinement
conditions
Table 1
Hydrogeochemical data Sample
name
Total well depth (m)
Ca (mg/L)
Mg (mg/L)
K (mg/L)
Na (mg/L)
HCO
3(mg/L)
Cl (mg/L)
SO
4(mg/L)
N–NO
3(mg/L)
BEC001 51.8 5.9 0.9 0.4 130.0 316.8 13.0 63.0 0.0
BEC002 17.1 94.0 21.0 3.4 31.0 353.7 52.0 40.0 0.0
BEC003 22.9 72.0 6.8 3.6 16.0 219.5 37.0 21.0 0.0
BEC005 18.3 3.5 0.7 4.1 210.0 414.7 47.0 100.0 0.0
BEC007 44.0 8.4 3.1 2.0 87.0 241.7 19.0 15.0 0.0
BEC008 17.0 2.2 0.7 1.5 320.0 411.5 280.0 24.0 0.0
BEC009 50.3 32.0 3.1 2.9 9.9 146.3 1.8 0.0 0.0
BEC010 37.0 32.0 6.6 2.0 4.9 121.9 0.9 24.0 0.0
BEC011 22.0 13.0 1.7 2.0 55.0 182.7 0.7 23.0 0.0
BEC012 32.6 58.0 7.7 2.7 5.1 158.5 52.0 6.3 0.0
BEC014 41.1 2.2 0.7 1.3 250.0 389.9 190.0 3.1 0.0
BEC015 33.5 3.0 1.0 1.5 63.0 181.6 0.6 14.0 0.0
BEC016 26.0 15.0 2.6 2.7 61.0 182.7 32.0 0.0 0.0
BEC021 25.9 45.0 14.0 2.4 18.0 146.2 46.0 22.0 0.0
BEC022 45.7 3.0 0.5 1.4 110.0 230.6 48.0 0.5 0.0
BEC024 27.4 2.6 0.4 1.0 96.0 230.6 0.8 37.0 0.0
BEC026 10.7 130.0 21.0 5.7 51.0 451.3 79.0 28.0 0.0
BEC027 21.0 20.0 2.2 2.0 86.0 231.6 16.0 33.0 0.0
BEC028 30.5 26.0 2.6 3.3 95.0 170.7 85.0 41.0 0.0
BEC029 27.4 57.0 6.2 3.7 9.6 146.3 37.0 24.0 0.0
BEC030 27.7 2.3 0.1 2.9 85.0 182.6 0.7 46.0 0.0
BEC031 18.3 23.0 6.7 6.4 43.0 195.1 12.0 17.0 0.0
BEC032 21.0 130.0 9.9 3.9 8.8 402.5 14.0 26.0 1.0
BEC033 49.4 7.9 1.2 3.8 84.0 206.9 2.4 44.0 0.0
BEC034 24.4 27.0 3.9 1.9 16.0 121.9 2.7 18.0 0.0
BEC035 38.1 9.7 1.3 2.4 94.0 158.1 64.0 25.0 0.0
BEC036 58.5 100.0 34.0 1.6 30.0 353.7 75.0 48.0 0.5
BEC040 14.5 19.0 1.9 1.0 2.3 47.57 3.6 12.0 2.6
BEC041 61.0 55.0 5.4 0.4 1.4 158.5 2.3 24.0 0.9
BEC042 80.8 41.0 1.4 0.4 5.0 120.7 7.2 8.0 0.1
BEC043 44.2 2.5 1.3 2.3 310.0 426.7 310.0 3.4 0.0
BEC044 84.2 97.0 2.9 0.3 5.8 121.9 0.7 180.0 0.0
BEC045 70.1 69.0 3.9 0.9 5.4 207.3 5.7 27.0 0.4
BEC046 68.6 40.0 15.0 0.8 6.8 158.5 18.0 26.0 0.0
BEC050 38.1 40.0 11.0 3.8 11.0 158.5 6.4 42.0 0.0
BEC052 88.4 14.0 2.1 2.4 85.0 243.9 5.8 43.0 0.0
BEC053 39.0 88.0 17.0 3.3 18.0 341.5 18.0 48.0 0.0
BEC055 18.3 54.0 6.3 1.3 7.7 158.5 13.0 34.0 0.0
BEC056 100.6 24.0 9.1 3.2 180.0 353.7 120.0 51.0 0.5
BEC057 20.7 32.0 5.4 2.4 85.0 268.3 55.0 9.9 0.0
BEC100 51.8 8.9 1.0 0.8 38.0 105.0 7.6 20.0 0.7
BEC101 47.2 1.2 0.3 1.1 210.0 413.8 150.0 2.2 0.0
BEC102 21.6 55.0 8.3 2.4 44.0 268.3 37.0 12.0 0.0
BEC103 43.6 73.0 13.0 3.1 40.0 268.3 62.0 41.0 0.0
BEC104 28.0 24.0 2.3 1.0 6.3 76.82 11.0 8.6 0.4
BEC107 36.6 33.0 5.4 0.8 5.8 101.1 9.6 32.0 0.1
BEC110 37.8 43.0 11.0 1.8 29.0 195.1 5.8 60.0 0.0
BEC112 38.1 32.0 11.0 2.0 24.0 207.3 1.7 8.1 0.1
maps from Godbout et al. (2011) which gives the type of granulometry associated with clay, silts, sands and glacial tills. Parameter (I) for the bedrock aquifer was determined from bedrock lithology description of Globensky (1987, 1993). Again, the classification here refers to soils or bedrock type obtained from available maps of the study area, and ratings were directly associated with the typical ratings as defined by Aller et al. (1987). The bedrock hydraulic conductivity (C) was set to the minimal ranking value of 1 for the entire study area since all field-measured
hydraulic conductivities (Larocque et al. 2013) were lower than the threshold for C = 1.
Results and discussion
Regional hydrogeochemistry of the study area
Groundwater chemistry types were determined from the Piper diagram (Fig. 4). Fifty-six per cent of the samples
Table 1continued
Sample name
Total well depth (m)
Ca (mg/L)
Mg (mg/L)
K (mg/L)
Na (mg/L)
HCO
3(mg/L)
Cl (mg/L)
SO
4(mg/L)
N–NO
3(mg/L)
BEC115 68.6 24.0 7.2 0.3 0.8 98.81 0.4 7.6 0.1
BEC116 45.7 26.0 7.2 1.2 3.1 98.81 4.8 9.3 2.4
BEC119 45.7 21.0 6.9 2.6 53.0 170.7 43.0 0.0 0.0
BEC120 68.6 21.0 7.5 2.2 96.0 292.6 34.0 17.0 0.0
BEC121 99.1 3.3 0.9 1.8 270.0 512.2 150.0 0.0 0.0
BEC122 38.1 29.0 13.0 4.4 60.0 317.1 3.3 1.0 0.0
BEC123 54.9 45.0 3.1 1.1 5.3 115.8 5.3 32.0 0.3
BEC126 49.1 25.0 6.2 0.9 27.0 134.1 26.0 7.6 0.0
BEC127 25.9 30.0 1.4 0.4 3.4 79.29 5.4 11.0 1.9
BEC129 61.0 36.0 4.0 1.5 47.0 207.3 23.0 22.0 0.1
BEC130 91.4 150.0 22.0 2.4 16.0 426.9 34.0 93.0 0.0
BEC131 22.9 30.0 8.0 0.4 3.0 117.1 2.2 9.7 2.0
BEC132 38.1 39.0 10.0 1.4 2.1 134.1 3.0 20.0 3.8
BEC134 38.1 97.0 7.0 2.8 6.6 256.1 6.1 63.0 2.0
BEC135 44.2 54.0 6.1 1.0 3.8 170.7 1.9 18.0 1.9
BEC137 23.7 5.1 0.4 1.6 85.0 219.5 9.4 29.0 0.0
BEC138 32.0 42.0 3.3 1.4 6.0 158.5 2.7 2.4 0.0
BEC139 48.8 0.1 0.0 0.1 88.0 95.13 11.0 100.0 6.1
BEC140 33.5 28.0 1.6 1.6 1.0 100.0 0.2 5.0 0.2
BEC142 68.6 44.0 13.0 1.2 8.3 195.1 8.0 16.0 1.6
BEC143 51.2 30.0 2.1 0.4 4.5 108.5 0.5 19.0 0.0
BEC144 8.2 100.0 17.0 6.2 21.0 439.1 11.0 40.0 0.0
BEC145 13.7 35.0 18.0 8.0 71.0 304.9 53.0 22.0 0.0
BEC146 30.5 35.0 9.3 2.3 31.0 219.5 9.0 17.0 0.0
BEC149 54.9 50.0 4.0 2.0 15.0 195.1 5.7 14.0 0.1
BEC160 144.8 41.0 2.1 1.0 4.5 113.4 9.5 7.4 3.7
BEC161 8.5 33.0 3.5 1.6 15.0 146.3 4.1 14.0 0.0
BEC165 106.7 220.0 31.0 3.5 500.0 426.9 1100.0 74.0 0.9
BEC166 73.2 20.0 6.9 3.9 210.0 451.0 120.0 36.0 0.0
ROC01 30.0 13.0 2.0 0.6 3.4 31.71 2.2 9.5 2.5
ROC03 78.3 24.0 9.4 6.8 820.0 340.9 970.0 3.0 0.0
ROC04 36.6 6.8 3.3 0.8 85.0 206.5 2.4 33.0 0.0
ROC05 47.2 1.9 0.5 1.6 140.0 365.2 3.0 16.0 0.0
ROC06 42.7 1.6 0.9 2.3 60.0 133.0 0.7 22.0 0.0
ROC08 43.5 3.8 0.6 0.8 64.0 157.9 0.5 6.6 0.0
ROC09 35.7 3.1 2.6 3.4 590.0 828.8 420.0 7.5 0.0
belong to the (Ca, Mg)–HCO
3, Ca–HCO
3and Ca–SO
4water types, mainly present in the Appalachian region where unconfined conditions prevail (see Fig. 3). Thirty- nine per cent of the samples belong to the Na–HCO
3water type, representing semi-confined conditions in the flat, central part of the study area to captive conditions in the downstream portion. Five per cent of the samples belong to the Na–Cl water type located in the lower portion of the aquifer. The Na–Cl water type represents confined condi- tions and is associated with a mixing with trapped marine pore-water. Charron (1978), Cloutier et al. (2008, 2010), Beaudry (2013) and Benoit et al. (2014) described similar hydrogeochemical facies for other southern Quebec bed- rock aquifers.
In the recharge area, groundwater chemistry is first con- trolled by the dissolution of carbonates present in calcareous Quaternary deposits such as tills (Cloutier et al. 2010) and through the first few metres of the fractured bedrock aquifer (Edmunds et al. 2003) which is here dominated by calcareous shaly and silty deposits of Ordovician age (Globensky 1987).
In the study area, groundwater typically evolves from (Ca, Mg)–HCO
3water types with low but nearly equal propor- tions of Na
?and Cl
-(representing an initial load of Na–Cl from precipitation) and with equal proportions of Ca
2??- Mg
2?and HCO
3þ SO
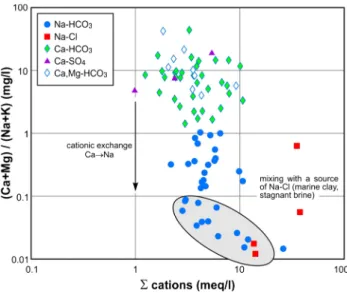
24(from the initial congruent dis- solution of calcareous and dolomitic materials). Slower and deeper circulation, involving long-term water–rock inter- actions in fractured aquifers, generally involves other pro- cesses such as incongruent dissolution of carbonates and cation exchange (Edmunds et al. 1987). For most of the samples taken in the Becancour bedrock aquifer, cation exchange (Ca
2??Na
?) appears to be the controlling process
(Fig. 5), leading to the relative enrichment of Na
?versus Cl
-and relative depletion of Ca
2?? Mg
2?versus HCO
3þ SO
24towards the evolution of groundwater to the Na–HCO
3type (Cloutier et al. 2010). Na
?is released in groundwater by cationic exchange from the clay fraction, whereas Ca
2?is depleted from groundwater. For samples with lower (Ca ? Mg)/(Na ? K) ratios, located in captive groundwater flow conditions, a shift (grey circle Fig. 5) in the total cation content probably indicates a mixing with the seawater end- member. In the study area, Na–Cl is released from marine clays or trapped Champlain Sea seawater (Cloutier et al.
2010), and groundwater evolves to Na–Cl type.
Nitrate concentrations are relatively low, with a maxi- mum value of 6.1 mg N–NO
3/L (drinking water limit 10 mg N–NO
3/L; MDDEFP 2013) and not related to the well depth (Table 1). These concentrations are similar to those reported in other studies from southern Quebec (MENV 2004). Eleven wells (12.9 %) mainly located in the Appalachian foothills have concentrations exceeding 1 mg/L N–NO
3, i.e. the anthropogenic background (Dubrovsky et al. 2010). Low nitrate concentrations in the study area could be attributed to the high recharge rates (159 mm/year, Larocque et al. 2013) which might induce significant dilution within the aquifer (Andrade and Stigter 2009). They could also be due to the interception of nitrate- rich infiltrated water by agricultural drains (Qi et al. 2011) and to denitrification (see further discussion below).
Hydrogeochemical Vulnerability Index
Considering the hydrogeochemical processes occurring in the study area, plotting the relative differences of Na
?–Cl
-against (Ca
2?? Mg
2?) - (HCO
3þ SO
24) illustrates how groundwater composition evolves from a (Ca, Mg)–
Fig. 4
Piper trilinear plot of groundwater samples
Fig. 5
Cationic exchange evidence in groundwater
HCO
3type in the recharge area to a Na–HCO
3type downgradient with gradually increasing confinement con- ditions (R
2= 0.97; Fig. 6). A Hydrogeochemical Vulner- ability Index (HVI) from 1 to 10 was attributed to each of the water samples from its orthogonal projection on the linear regression. The HVI identifies the highest vulnera- bility scores for groundwater samples near the recharge area ((Ca, Mg)–HCO
3, Ca–HCO
3and Ca–SO
4types). It gradually decreases with increasing confinement conditions of the bedrock aquifer, thus changing to Na–HCO
3type and eventually to Na–Cl type. A HVI map was interpolated (inverse distance weighting) using all the sampled wells (Fig. 7). The highest values of HVI are found in the Appalachian Mountains (HVI above 8) and gradually decrease with the regional groundwater flow, as the Qua- ternary deposits become thicker and/or more impermeable.
Approaching the St. Lawrence River, the least vulnerable areas (HVI between 1 and 5) correspond to the location of thick clay deposits which confine the bedrock aquifer. The HVI generally reflects the bedrock aquifer confinement conditions (see Fig. 3), but also locally highlights the dis- continuities in confinement that differ from the regional pattern. For example, the HVI shows probable local recharge areas within dominantly confined conditions (HVI above 8), particularly downstream, in the north-eastern part of the basin and in the Appalachian Piedmont.
The HVI can be derived similarly for other hydrogeo- logical contexts where calcareous dissolution from
recharge and Ca
2?–Na
?cation exchange dominate the water chemistry. This is a common pattern regarding the evolution of groundwater geochemistry composition along the flow paths (Edmunds et al. 2003; Appelo and Postma 2005). The HVI is expected to be particularly suitable in glacial hydrogeomorphological contexts, i.e. with the presence of calcareous materials found in tills, in sedi- mentary bedrock rich in clay minerals, and under gradual confinement conditions of the fractured aquifer with mar- ine clays. The HVI was tested in other regions of the St.
Lawrence Lowlands in southern Quebec, taking advantage of newly available hydrogeochemical datasets from the Nicolet and lower Saint-Franc¸ois watersheds (Larocque et al. 2015) and in the Monteregie region (Carrier et al.
2013). For these regions, the HVI was built using the same ranges of Na–Cl (y-axis) and Ca ? Mg–HCO
3–SO
4(x- axis) than for the current study area. HVI values larger than 9 were found, respectively, for 83 % and 89 % of wells with detectable nitrate (above 0.1 mg N–NO
3/L) (results not illustrated). In other geological and climatic contexts, it might be necessary to modify the axes ranges in Fig. 6 to adjust to site-specific conditions.
The HVI provides integrative information on well vul- nerability while being relatively inexpensive to implement and easily computed. Similarly to other types of interpo- lated maps (e.g. maps of hydrogeological contexts inter- polated from local drilling data), the uncertainty related to the interpolated surface is directly linked to data point density. For example, because municipal and private wells are rare near the St. Lawrence River (due to high-salinity groundwater), the vulnerability map in the lower portion of the study area is more uncertain. In the case of local groundwater contamination, the method may show heterogeneities related to anthropogenic sources (e.g. Na–
Cl pollution from deicing road salts, surface water infil- tration into a poorly maintained well cap) rather than to the natural hydrogeological context. A preliminary check was
Fig. 6Hydrogeochemical Vulnerability Index (HVI)
Fig. 7
Vulnerability map obtained using the Hydrogeochemical
Vulnerability Index (HVI)
performed to discard results from samples impacted by deicing road salt.
DRASTIC vulnerability map
The calculated DRASTIC indices range from 33 to 179 (Fig. 8). This scope is comparable with existing DRASTIC maps obtained in similar geomorphological contexts in southern Quebec (Champagne 1990; Murat 2000). In the current study, the DRASTIC index in the Appalachians indicates the simultaneous presence of medium (between 76 and 100) and high (between 126 and 150) aquifer vul- nerability areas. Low groundwater levels on topographic ridges counterbalance high recharge rates. Areas where the aquifer vulnerability is very high (higher than 150) are characterized by the presence of granular glaciofluvial deposits where the groundwater depth is shallow. These are found in the valley bottom of the Becancour River in the eastern part of the study area. The index is high (between 126 and 150) to very high (higher than 150) in the central part of study area due to high groundwater levels in a flat topographic context, as well as to the presence of regres- sive and aeolian sand deposits. In this part of the study area, recharge rates can be high but are counterbalanced by the presence of silty deposits and peatlands (between 76 and 100) which lowers parameters S (soils) and I (im- pact of the vadose zone). Low aquifer vulnerability areas (between 33 and 75) are located in the lower part of the basin where thick clay deposits are present.
It is not possible to integrate complex sequences of overlying Quaternary deposits when using the DRASTIC index to estimate the vulnerability of a bedrock aquifer.
This is due to the fact that it uses only two parameters for the overlying unconsolidated sediments, i.e. one parameter for soil type (S) and another parameter for the impact of the vadose zone (I). Recharge is usually the main vector for solute transport through the vadose zone, as highlighted in other studies the importance of recharge in aquifer
vulnerability estimation (e.g. Rupert 2001; Nobre et al.
2007). This is reflected in the index, where four out of seven parameters relate to infiltration and recharge pro- cesses (R, S, T and I). On the DRASTIC map (Fig. 8), the most extended and vulnerable aquifer zones are found in the Appalachian Piedmont, while hydrogeochemistry sug- gests that recharge areas are predominantly located in the Appalachian Mountains. High aquifer vulnerability in this area is caused by high S and I parameters in the presence of sandy soils. However, these regressive and aeolian sands are often superficial deposits covering thick till deposits considered as aquitards. This underlying till probably offers a good protection for the underlying bedrock aquifer, which is not taken into account by the DRASTIC index.
Comparing HVI and DRASTIC indices
The two vulnerability indices (Figs. 7, 8) do not show the same spatial distribution because they do not integrate the same parameters and processes. The HVI reflects a cumu- lative sequence of hydrochemical processes, from the recharge area to the aquifer domain where renewal rates are low. It can be considered as an integrated representation of the flow lines from the recharge area to the pumped well and reflects borehole vulnerability. The DRASTIC index is mostly based on parameters responsible for vertical flows from the surface to the aquifer. It maps areas of potential groundwater contamination and does not consider flow line distribution or convergence of diffuse pollution to a well, nor does it take into account groundwater flow dynamics. For instance, an area covered with impermeable sediment will be associated with a low DRASTIC index, but groundwater at this site may be affected by contamination from neighbour- ing upstream vulnerable areas where recharge occurs.
Nitrate is highly leachable in groundwater and is often chosen to trace anthropogenic impacts on groundwater resource at regional scales (Rodriguez-Galiano et al. 2014).
It is also the contaminant that most frequently exceeds drinking water standard (e.g. MENV 2004; US Environ- mental Protection Agency 2005; Stuart et al. 2007).
However, because it is subject to denitrification, nitrate is not a perfect tracer. Previous studies detailed the processes involved for denitrification due to oxic/anoxic conditions (Korom 1992; McMahon et al. 2004) which are associated with microbial (McMahon et al. 2008) or pyrite reduction (Bo¨hlke et al. 2002) in groundwater. In the current study, denitrification rates were not estimated because of the density of sampling locations and because of the relatively low nitrate concentrations measured.
The HVI and DRASTIC indices were compared against
measured nitrate concentrations to estimate the predicting
capacity of the vulnerability method (note: the HVI com-
putation does not include nitrate). The occurrence of nitrate
Fig. 8Vulnerability map obtained using the DRASTIC index (DI)
in groundwater depends (1) on the spatial distribution of non-point sources of contamination at the land surface, (2) on the capacity of nitrogen to be mineralized and migrate vertically through the unsaturated zone towards the aquifer and (3) on groundwater flow paths within the saturated zone. Since the DRASTIC index reflects (2) while the HVI reflects (2) and (3), comparing the HVI and DRASTIC vulnerability scores with the occurrence of nitrate provides a means to evaluate how each of these three mechanisms influences nitrate concentrations at a given well. To com- pare the two vulnerability indices with the nitrate and within a single range, DRASTIC indices (from 33 to 179) were linearized to values between 1 and 10 (Fig. 9). For samples with detected nitrate, the linearized DRASTIC index ranges between 4.5 and 8.7, but does not show a gradual increase pattern with nitrate concentrations. This result suggests that the DRASTIC index is relatively ineffective for evaluating more and less vulnerable areas in the study area. In sharp contrast, the HVI shows a consis- tent trend with the occurrence of nitrate within the Becancour area, with 82 % of all wells having detectable nitrate concentrations (above 0.1 mg N–NO
3/L) having a vulnerability score of greater than 9.
Because both methods estimate the intrinsic vulnera- bility, neither considers the presence of a contaminant source at the surface and the difference between their capacities to identify the presence of nitrate in groundwater is linked to one of the other two causes. The better nitrate/
vulnerability index correspondence for the HVI method is probably explained by the fact that major ions geochem- istry reflects groundwater flow dynamics which are not considered in DRASTIC. The inclusion of parameters considered representative of water and contaminant flow through the unsaturated zone (i.e. A and C parameters) is not sufficient for DRASTIC to correlate better with nitrate
concentrations. Using concentrations from other anthro- pogenic contaminants, performing tracer tests or ground- water flow modelling on the studied aquifer would provide a more complete test of the HVI method capacity to identify regional-scale groundwater vulnerability.
Conclusions
The objective of this work was to test the potential of major ion chemistry to assess groundwater vulnerability of a regional aquifer. A Hydrogeochemical Vulnerability Index (HVI) was developed and applied to a southern Quebec fractured bedrock aquifer, and results were compared to those of the classical DRASTIC method, and to measured nitrate concentrations.
Major ion of groundwater samples evolve from (Ca, Mg)–HCO
3type in recharge areas to Na–HCO
3and Na–Cl type downgradient in the aquifer. Although relatively low, nitrate concentrations in nearly 13 % of the sampled wells show anthropogenic impacts from agricultural activities.
The proposed HVI integrates processes from both infiltra- tion and groundwater flow dynamics and shows scores consistent with the occurrence of nitrate in groundwater. It also highlights local discontinuities in confinement that differ from the regional pattern. Eighty-two per cent of all groundwater samples with detectable nitrate groundwater show a HVI close to the maximum value of 10, a perfor- mance significantly better than that of the DRASTIC index.
The poor correlation between the DRASTIC index and the nitrate concentration in groundwater is probably due to the fact that the DRASTIC method does not include ground- water flow dynamics.
This work suggests that major ion geochemistry con- tains significant information about intrinsic well vulnera- bility. This inexpensive and easily implemented method is transferrable to similar geological contexts, but would need to be adapted if carbonate dissolution and cation exchange are not the main hydrogeochemical processes which con- trol the groundwater composition locally and regionally. It would also need to be tested using concentrations of other anthropogenic contaminants and confronted to other vul- nerability methods. Combining the hydrogeochemical vulnerability method with the mapping of non-point sour- ces of anthropogenic pollution at the land surface may contribute a real support tool for groundwater integrated resource-protecting policies.
Acknowledgments
We wish to thank an anonymous reviewer for his careful review and suggestions that greatly improved the manu- script. The authors thank the Quebec Ministry of Environment (Ministe`re du De´veloppement durable, de l’Environnement et de la
Lutte contre les changements climatiques), the Becancour RiverWatershed organization (organisme de bassin versant GROBEC) and
Fig. 9Comparison of vulnerability maps with measured nitrate
concentrations
the municipalities that have participated in financing and supporting this research.
References
Aller L, Bennett T, Lehr JH, Petty RJ, Hackett G (1987) DRASTIC: a standardized system for evaluating groundwater pollution poten- tial using hydrogeologic settings. EPA-600/2-87-035, 20 p Andrade AIASS, Stigter TY (2009) Multi-method assessment of
nitrates and pesticides contamination in shallow alluvial ground- water as a function of hydrogeologic setting and land use. Agric Water Manag 96:1751–1765
Appelo CAJ, Postma D (2005) Geochemistry, groundwater and pollution, 2nd edn. A.A. Balkema Publishers, Leiden
Barbecot F, Marlin C, Gibert E, Dever L (2000) Hydrochemical and isotopic characterisation of the Bathonian and Bajocian coastal aquifer of the Caen area (northern France). Appl Geochem 15(6):791–805
Beaudry C (2013) Hydroge´ochimie de l’aquife`re rocheux re´gional en Monte´re´gie est, Que´bec. MSc thesis, INRS-ETE, Universite´ du Que´bec, Que´bec, Canada, 210 p. Access to the geochemical dataset online:
http://sdis.inrs.ca/(in French)Benoit N, Nastev M, Blanchette D, Molson J (2014) Hydrogeology and hydrogeochemistry of the Chaudie`re River watershed aquifers, Quebec, Canada. Can Water Resour J 39(1):32–48 Bo¨hlke JK, Wanty R, Tuttle M, Delin G, Landon M (2002)
Denitrification in the recharge area and discharge area of a transient agricultural nitrate plume in a glacial outwash sand aquifer, Minnesota. Water Resour Res 38:7. doi:10.1029/
2001WR000663
Bojo´rquez-Tapia A, Cruz-Bello GM, Luna-Gonza´lez L, Jua´rez L, Ortiz-Pe´rez MA (2009) V-DRASTIC: using visualization to engage policymakers in groundwater vulnerability assessment.
J Hydrol 373:242–255
Carrier MA, Lefebvre R, Rivard C, Parent M, Ballard JM, Benoit N, Vigneault H, Beaudry C, Malet X, Laurencelle M, Gosselin JS, Ladeve`ze P, The´riault R, Beaudin I, Michaud A, Pugin A, Morin R, Crow H, Gloaguen E, Bleser J, Martin A, Lavoie D (2013) Portrait des ressources en eau souterraine en Monte´re´gie Est, Que´bec, Canada. Projet re´alise´ conjointement par l’INRS, la CGC, l’OBV Yamaska et l’IRDA dans le cadre du Programme d’acquisition de connaissances sur les eaux souterraines, rapport final INRS R-1433, soumis en juin 2013, 312 p.
(in French)CEAEQ (Centre d’expertise en analyse environnementale du Que´bec)
(2014) Les me´thodes d’analyses en usage au Centre d’expertise en analyse environnementale. On-line:
http://www.ceaeq.gouv.qc.ca/methodes/methode_index.htm
Champagne L (1990) Vulne´rabilite´ des eaux souterraines a` la pollution: M.R.C. de Montcalm. MSc thesis, Universite´ de Montre´al, Que´bec, Canada, 80 p
(in French)Charron JE (1978) Hydrogeochemical study of groundwater flow in the interstream area between the Ottawa and St. Lawrence Rivers. Environment Canada, Water Resource Branch, Scientific series No. 76, 45 p
Chen SK, Jang CS, Peng YP (2013) Developing a probability-based model of aquifer vulnerability in an agricultural region. J Hydrol 486:494–504
Chowdhury SH, Kehew AE, Passero RN (2003) Correlation between nitrates contamination and groundwater pollution potential.
Groundwater 41:735–745
Cloutier V, Lefebvre R, Therrien R, Savard MM (2008) Multivariate statistical analysis of geochemical data as indicative of the hydrogeochemical evolution of groundwater in a sedimentary rock aquifer system. J Hydrol 353:294–313
Cloutier V, Lefebvre R, Therrien R, Savard MM (2010) Desalination of a sedimentary rock aquifer system invaded by Pleistocene Champlain Sea water and processes controlling groundwater geochemistry. Environ Earth Sci 59:977–994
Dubrovsky NM, Burow KR, Clark GM, Gronberg JM, Hamilton PA, Hitt KJ, Mueller DK, Munn MD, Nolan BT, Puckett LJ, Rupert MG, Short TM, Spahr NE, Sprague LA, Wilber WG (2010) The quality of our Nation’s waters—nutrients in the Nation’s streams and groundwater, 1992–2004. U.S. Geological Survey Circular, vol 1350, 174 p
Edmunds WM, Cook JM, Darling WG, Kinniburgh DG, Miles DL, Bath AH, Morganjones M, Andrews JN (1987) Baseline geochemical conditions in the Chalk aquifer, Berkshire, U.K: a basis for groundwater quality management. Appl Geochem 2:251–274
Edmunds WM, Shand P, Hart P, Ward RS (2003) The natural (baseline) quality of groundwater: a UK pilot study. Sci Total Environ 310:25–35
Environment Canada (2012) Canadian climate normals 1971–2000 for Laurierville, Que´bec.
http://climate.weather.gc.ca/climate_normals/index_e.html