Structures de glace des cours d’eau à forte pente :
cristallographie et processus de croissance
Mémoire
Mathieu Dubé
Maîtrise en génie des eaux
Maître ès sciences (M. Sc.)
Québec, Canada
III
Résumé
Réunissant une série de trois articles scientifiques, ce mémoire offre une description et une quantification des processus dynamiques de glace dans les cours d‟eau à forte pente. Menée sur trois cours d‟eau du bassin versant de la rivière Montmorency (à proximité de Québec, QC, Canada), cette recherche démontre grâce à l‟analyse par CAT scan que la glace de fond et les barrages de glace se développent principalement par croissance in-situ des cristaux de frasil-fixé. La porosité des structures de frasil-fixé varie entre 23% et 52% alors que celle de des structures de glace colonnaire, uniquement retrouvées dans les barrages de glace, varie entre 0% et 1,5%. De plus, les taux de croissance et de fonte des barrages de glace varient de façon importante autour d‟une moyenne d‟environ 1 cm/h. Le développement complet d‟un barrage de glace a été simulé avec succès à l‟aide d‟un modèle physique comportant plusieurs degrés de liberté.
V
Abstract
Uniting three scientific papers, this thesis offers a description and a quantification of dynamic ice processes taking place in steep channels. This research was led on three channels located in the Montmorency River watershed near Quebec City, Canada. CAT scan analyses showed that the development of anchor ice and ice dams is mainly caused by in-situ growth of fixed-frazil ice crystals. Porosity of fixed-frazil ice structures ranges between 23% and 52% while porosity of columnar ice structures, only found in ice dams, ranges from 0% to 1.5%. Moreover, ice dam growth and decay rates greatly vary around the mean value of about 1 cm/h. The complete development of a single ice dam was successfully simulated using a physical model that demonstrated the large number of degrees of freedom inherent in the process.
VII
Table des matières
RÉSUMÉ ... III
ABSTRACT ... V
TABLE DES MATIÈRES ... VII LISTE DES TABLEAUX ... IX
LISTE DES FIGURES ... XI
REMERCIEMENTS ... XV
AVANT-PROPOS ... XVII
1. INTRODUCTION ... 1
1.1 Mise en contexte ... 1
1.2 Objectifs ... 3
Références ... 4
2. FORMATION AND INNER STRUCTURE OF ICE DAMS IN STEEP CHANNELS ... 7
Résumé ... 7
Abstract ... 8
2.1 Introduction ... 9
2.2 Background ... 9
2.3 Sampled sites ... 10
2.4 Hydrological and weather conditions during ice formation ... 12
2.5 Sampling methodology ... 14
2.6 CAT scan analysis ... 16
2.7 Results interpretation ... 17
2.7.1 Emerged sample (E1)... 17
2.7.2 Lepine Creek breached ice dam (L1) ... 21
2.7.3 Submerged sample (S1)... 23
2.8 Discussion ... 25
References ... 26
3. INNER STRUCTURE OF ANCHOR ICE AND ICE DAMS IN STEEP CHANNELS... 29
Résumé ... 29
Abstract ... 30
3.1 Introduction ... 31
3.2 Sampled sites, sample categories and methods ... 33
3.2.1 Sampled sites ... 33
3.2.2 Ice sample categories... 36
3.2.3 Sampling methodology and CAT scan analysis ... 37
3.3 Hydrological and weather conditions during ice formation ... 38
3.4 Ice crystal types ... 39
VIII
3.4.2 Fixed-frazil ice crystals ... 40
3.5 Ice structures‟ properties ... 45
3.5.1 Porosity ... 45
3.5.2 Size of fixed-frazil ice crystals ... 47
3.5.3 Orientation of fixed-frazil ice crystals ... 48
3.5.4 Dendrite structures development ... 50
3.6 Discussion ... 51
3.7 Conclusion ... 52
Acknowledgments ... 53
References ... 54
4. STEEP CHANNEL FREEZEUP PROCESSES: UNDERSTANDING COMPLEXITY WITH STATISTICAL AND PHYSICAL MODELS ... 57 Résumé ... 57 Abstract ... 58 4.1 Introduction ... 59 4.2 Objective ... 60 4.3 Methodology ... 60
4.4 Ice dam development rates ... 61
4.4.1 Data overview ... 61
4.4.2 Ice dam buildup and breaching rates ... 63
4.5 Ice dam modeling: heat budget method ... 66
4.5.1 Short wave radiation (Esw) ... 66
4.5.2 Long wave radiation (Elw) ... 66
4.5.3 Evaporation (Eevap) and convection (Econv) ... 67
4.5.4 Conductive energy from the bed (Ebed) ... 68
4.5.5 Energy from the groundwater (Egw)... 68
4.5.6 Energy from friction (Efr) ... 69
4.5.7 Suspended ice cover insulation ... 70
4.5.8 Total energy and ice formation ... 71
4.6 Model parameterization ... 72
4.6.1 Ice dam characteristics ... 72
4.6.2 Water depth simulation parameters ... 74
4.7 Model calibration and results ... 75
4.7.1 Heat fluxes and air temperature vs. growth rates ... 79
4.8 Discussion ... 80 4.9 Conclusion ... 81 List of symbols ... 82 Acknowledgments ... 83 References ... 83 5. CONCLUSION... 87
IX
Liste des tableaux
Table 3.1. Ice sample identifications and characteristics. ... 36 Table 3.2. Fixed-frazil ice porosity of anchor ice and ice dams. ... 46 Table 4.1. Site-averaged and sites‟ maximum rates during activation, reactivation and breaching events. ... 64
XI
Liste des figures
Figure 1.1. Accumulation de glace de fond sur un lit graveleux. L‟écoulement est dans la direction de la
caméra. ... 2
Figure 1.2. Barrage de glace composé de glace de fond et recouvert de glaçage. L'écoulement est dans la direction de la caméra. ... 3
Figure 2.1. Research region and sampling sites, Montmorency River watershed, Quebec, Canada... 10
Figure 2.2. Study site, Montmorency River, Quebec, Canada. The channel is 50 m-wide. The white arrow indicates flow direction. ... 11
Figure 2.3. Looking across the channel where the emerged ice dam sample (E1) was collected. Note the ice dam extension in the background. ... 11
Figure 2.4. Sampled ice dam on Lepine Creek. Note the development of ice dams in the background. The white arrow indicates flow direction and the channel width is about 4 m. ... 12
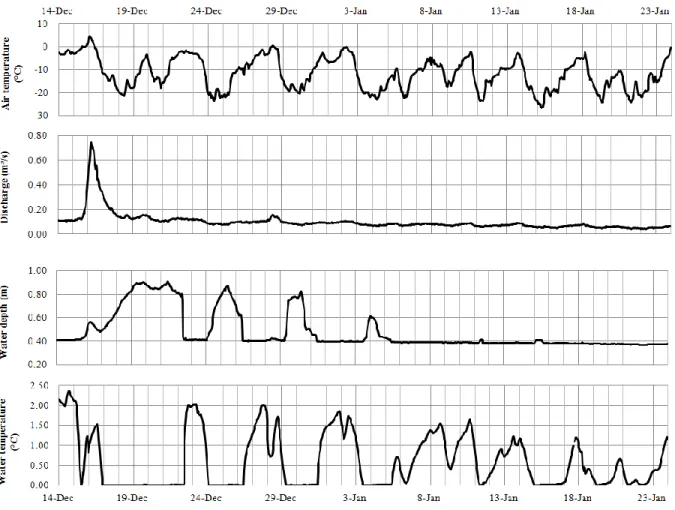
Figure 2.5. Montmorency River data (Jan. 2012): water depth, water temperature and air temperature were recorded 1,3 km upstream of sampled ice dams E1 and S1. The River discharge was obtained from the Provincial Government (CEHQ) hydrometric station located about 20 km downstream... 13
Figure 2.6. Lepine Creek data (Dec. 2011 - Jan. 2012): air temperature, discharge, water depth and water temperature were recorded 50 m upstream of the sampled ice dam L1. ... 14
Figure 2.7. The submerged ice dam sample (S1) being collected. ... 15
Figure 2.8. Ice dam sample E1 drained with layer of solid ice visible on the upper surface. ... 15
Figure 2.9. Sampled ice dam on Lepine Creek. The flow is toward the camera. ... 16
Figure 2.10. Inner structure and porosity values of sample E1 – The flow is from left to right the sample is oriented vertically as found in the field... 18
Figure 2.11. CAT scan (a) of sample E1 showing crystal orientations and porosity (grayscale) and (b) thin section using X polarizers (identified in 11a) showing the crystallography of an anchor ice sub-area. .... 19
Figure 2.12. CAT scan (a) of sample E1 showing crystal orientations and density (gray scale) and (b) thin section using X polarizers (identified in 12a) showing the crystallography of the ice cap and of the anchor ice immediately below. ... 19
Figure 2.13. (a) Horizontal CAT scan slice of sample E1 showing the ball-shaped solid ice and general porosity (grayscale) and (b) thin section using X polarizers (identified in 13a) showing the crystallography of the ball-shaped solid ice separated by relatively porous anchor ice. ... 20
Figure 2.14. Inner structure and porosity values of sample L1 –flow is from left to right. The sample is tilted about 30° to the left from its vertical position. ... 22
Figure 2.15. (a) Vertival CAT scan slice of sample L1 showing snow ice (bottom of the sample) and general porosity (grayscale) and (b) thin section using X polarizers (identified in 15a) showing the crystallography of the snow ice. ... 23
Figure 2.16. Flooded snow accumulation on the sampled ice dam‟s crest (L1) on Dec. 20th 2012. The arrow is indicates the flow direction. ... 23
Figure 2.17. Inner structure and porosity values of submerged sample S1. Cut made through the sample perpendicularly to the flow direction. The sample is oriented vertically as found in the field. ... 24
Figure 2.18. a) CAT scan of sample S1 showing crystal orientation and density (grayscale) and (b) thin section using X polarizers (identified in 18a) showing the crystallography of alternating solid-anchor ice layers. 25 Figure 3.1. (A) Underwater photograph of an anchor ice accumulation in a pool section of the Stream and (B) photograph of a partially emergent ice dam in the Stream. White arrows indicate the flow direction. ... 31
XII
Figure 3.2. (A) Research region and (B) sampled channels (grey area) in the Montmorency River watershed, Quebec, Canada. ... 33 Figure 3.3. Instrumentation layout in the Stream and the Creek and sampling sites identification (black boxes).
... 34 Figure 3.4. CAT scans of collected ice samples. Arrows indicate the scale with a distance of 10 cm along the
flow direction. Saw tooth lines show where ice was broken away. Double white lines indicate the rock substrata surface. (Note that sample C1 was broken in two). ... 35 Figure 3.5. Typical ice dam profile showing upstream and downstream sampling locations. ... 37 Figure 3.6.Stream and Creek environmental data (TA, Y and TW) for the entire sampling period (Nov. 25th,
2012 to Feb. 13th, 2013). ... 38 Figure 3.7. (A) Vertical CAT scan slice of sample S6 showing crystal orientations and porosity (grayscale) and
(B) thin section (identified in 7A) showing the crystallography of the ice cap. The flow is from left to right and the sample is oriented vertically as found in the Stream. ... 40 Figure 3.8. (A) Horizontal CAT scan slice showing crystal orientations and porosity (grayscale) and (B) thin
section of the zone identified in 8A showing the crystallography of the ball-shaped ice. The flow is from right to left. (Adapted from Dubé et al., 2013). ... 41 Figure 3.9. (A) Vertical CAT scan slice of sample S6 showing crystal orientations and porosity (grayscale) and
(B) thin section showing the crystallography of fixed-frazil ice of the zone identified in 9A. The flow is from left to right and the sample is oriented vertically as found in the field. ... 42 Figure 3.10. (A) Underwater photograph in the Creek of a waterproof glove showing (B) disc-shaped frazil ice
in the spacing between two fingers. ... 43 Figure 3.11. (A) Underwater photograph of anchor ice mass in the Creek and (B) close-up section showing
transparent disc-shaped frazil ice particles actively growing (pointed by arrows). ... 43 Figure 3.12. Spatial tracking of a single plate-like fixed-frazil ice crystal (enclosed in ellipse) using CAT scan
analysis of sample S6. Straight lines indicate the location of the three perpendicular slices and their intersection point to the same fixed-frazil ice crystal. ... 44 Figure 3.13. Vertical CAT scan slice of sample S6 showing inner structure and porosity values for sub-areas
(including columnar ice and fixed-frazil ice). The flow is from left to right and the sample is oriented as found in the Stream. ... 45 Figure 3.14. Cumulative frequency, maximum and mean values of crystal-segment size of fixed-frazil ice
structures found in anchor ice and ice dams samples. ... 47 Figure 3.15. Distribution of the longest ice crystals measured in each anchor ice and ice dam sample. Vertical
lines represent the measured size ranges and horizontal lines represent the mean values. ... 48 Figure 3.16. Vertical CAT scan slice of sample C2. Note ice crystal growth orientation (solid lines in sub-areas
1 and 2) and estimated evolution of the water depth over the sample (white dashed lines in sub-areas 1 and 2)... 49 Figure 3.17. (A) Vertical CAT scan slice of sample S6 showing the dendritic growth of fixed-frazil ice crystals
and (B) a close-up view. ... 50 Figure 4.1. Land surveys of channel bed, open water surface (May 8th, 2013), and suspended ice cover
surface (Feb. 18th, 2013) in two step-pool reaches. Arrows indicate location of steps (S) and pools (P). Flow is toward the camera in B and D. Site 4 (A & B) and sites 1 and 2 (C & D) are study sites presented in this work. ... 59 Figure 4.2. Deployed instrumentation in the Lépine Creek, Quebec (Canada). ... 61 Figure 4.3. (A) Meteorological station and (B) net radiometer at Site 4. ... 62
XIII Figure 4.4. Environmental data (Nov. 25th to Dec. 4th, 2012) showing a freezeup cycle in the Creek at Site 3.
... 62 Figure 4.5. Ice dam activation (Δh+ ; total of 653 hours for the 6 sites), reactivation (Δh++; 1,363 hours) buildup
rates and breaching (Δh-; 1,714 hours) rates (max, min, 75%, 50% and 25% quartiles) for each site from Nov. 26th, 2012 to Apr. 8th, 2013 (note the log scale). ... 64 Figure 4.6. Ice dam activation (Δh+), reactivation (Δh++) and breaching (Δh-) rates for 3 consecutive winters
over 24 sites in channels of order 2, 3 and 4. ... 65 Figure 4.7. Ice dam activation (Δh+), reactivation (Δh++) and breaching (Δh-) rates for 3 consecutive winters at
Creek‟s Site 3. ... 65 Figure 4.8. Hourly wind speed comparison between Environment Canada weather station and forested study
Site 4 (comparison of 2874 measurements). ... 67 Figure 4.9. Approximate cross-section and ice development geometry at Site 4. ... 70 Figure 4.10. Air temperatures measured below the suspended ice cover compared to those above from Feb.
7th to Mar. 7th, 2013 (1,320 measurements)... 71 Figure 4.11. Modeled ice dam geometry at Site 4. (A) Profile view and (B) overhead view in stream wise
direction. ... 73 Figure 4.12. Measured air temperature (Tair), heat fluxes (in W/m²) from short wave radiation (Esw) and long
wave radiation (Elw), simulated heat fluxes from evaporation (Eevap), convection (Econv), groundwater (Egw) and friction (Efr), observed channel ice coverage (Ic) and simulated net heat flux (Enet) from Feb. 1st to Feb. 4th, 2013 at Site 4. ... 76 Figure 4.13. Measured water depth (Y), simulated Y, l and Wi sensitivity trends and total energy per unit length (Ω/l) at Site 4 (Feb. 1st to Feb. 4th, 2013). ... 77 Figure 4.14. Sensitivity analysis on simulated maximum Y value. ... 78 Figure 4.15. Measured ice dam buildup rates (Δh+) versus simulated net heat flux (Enet) and measured
XV
Remerciements
La réalisation d‟un projet de maîtrise nous amène à acquérir et perfectionner différentes compétences et qualités, non seulement des points de vue technique et scientifique mais également sur le plan personnel. Mener à bien cette étude de terrain hivernale m‟a demandé patience, détermination et ténacité. Le support de mes proches a été une source de motivation tout au long du projet. Je tiens particulièrement à remercier ma copine Marie-Pier d‟avoir été si compréhensive durant ces deux années. Merci à mes parents, Marc et Lise, de m‟avoir encouragé à persévérer tout au long de ce cheminement.
Je remercie également les personnes et les instances suivantes pour leur contribution significative à ce projet de maîtrise :
Brian Morse, mon directeur de recherche, pour son humilité, ses idées infinies, sa vision, son expérience, sa patience, son sens de l‟humour, sa grande disponibilité et sa générosité. Il a été un véritable guide et m‟a permis de constamment me dépasser.
Benoit Turcotte, mon fidèle collaborateur, pour son aide précieuse, son temps, son écoute et pour avoir partagé de nombreuses données. Nos sorties de terrain et nos discussions étaient à chaque fois aussi intéressantes qu‟instructives.
Dany Crépault pour son aide à construire et réparer les équipements et les outils de terrain. Son savoir-faire et sa rapidité d‟exécution ont grandement facilité mon travail.
Marlyne Fergusson pour avoir préparé mes nombreux relevés de dépenses de terrain et pour sa bonne humeur contagieuse.
Les propriétaires riverains qui m‟ont si gentiment donné accès à leur terrain durant 8 mois. Merci à Lise, Claude et Denis.
Le conseil de recherches en sciences naturelles et en génie du Canada (CRSNG) et la Fondation canadienne pour l‟innovation (FCI) pour leur support financier à ce projet.
XVII
Avant-propos
L‟introduction et la conclusion de ce mémoire, soit les chapitres 1 et 5, ont été entièrement rédigés par l‟auteur du mémoire.
L‟article présenté au chapitre 2 a été coécrit par Benoit Turcotte (candidat au doctorat), Brian Morse (directeur de recherche) et Edward Stander (professeur à SUNY Cobleskill). L‟auteur de ce mémoire est l‟auteur principal de l‟article tel que présenté à la conférence du CRIPE (Committee on River Ice Processes and the
Environment).
L‟article présenté au chapitre 3 a été coécrit par Benoit Turcotte (candidat au doctorat) et Brian Morse (directeur de recherche). L‟auteur de ce mémoire est l‟auteur principal de l‟article tel que publié dans la revue scientifique Cold Regions Science and Technology en 2014.
L‟article présenté au chapitre 4 a été coécrit par Benoit Turcotte (scientifique de recherche) et Brian Morse (directeur de recherche). L‟auteur de ce mémoire est l‟auteur principal de l‟article tel que soumis à la revue scientifique Canadian Journal of Civil Engineering en 2014.
1
1. Introduction
1.1 Mise en contexte
La formation de la glace dans les cours d‟eau à forte pente en milieu nordique repose sur une série de processus dynamiques qui interagissent entre eux et qui sculptent le paysage fluvial en période hivernale. Principalement répertoriés dans les chenaux à lit graveleux ayant une pente de plus de 0.3%, ces processus de glace causent notamment l‟augmentation des niveaux d‟eau (e.g. Tesaker, 1996; Turcotte et al., 2013) et la modification des conditions d‟écoulement (e.g. débit, vitesse), donnant ainsi lieu à la formation d‟une couverture de glace suspendue (e.g. Tesaker, 1994; Turcotte et al., 2011) propre à ces cours d‟eau.
Ces processus représentent le résultat d‟une série de réactions en chaîne basée sur deux conditions devant obligatoirement être rencontrées : un niveau de turbulence de l‟écoulement suffisamment élevé et des températures de l‟air suffisamment sous le point de congélation occasionnant la surfusion de l’eau (supercooling). Ces deux conditions permettent la formation de cristaux de frasil, soit de fins disques de glace se déplaçant dans la colonne d‟eau. Pouvant être formés (ou encore nucléés) selon différents processus (Michel, 1978), ces cristaux adoptent, au premier stade de leur développement, une morphologie discoïde (Tsang, 1982). Leur croissance est possible tant et aussi longtemps que la température de l‟eau demeure sous le point de congélation (surfusion). À ce moment considérés dans une phase active (e.g. Tesaker, 1994), les disques de frasil on la propriété de s‟agglomérer entre eux ou encore d‟adhérer sur les surfaces submergées ayant une température de 0°C ou moins.
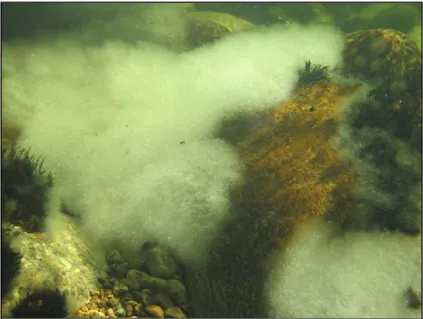
Toute accumulation de glace formée sur une surface submergée est appelée glace de fond (anchor ice). Dans les cours d‟eau à forte pente, la glace de fond présente une structure poreuse plus ou moins dense prenant la plupart du temps une apparence nuageuse (Figure 1.1). Elle peut se former de façon sporadique ou encore recouvrir le lit du chenal d‟une large et épaisse couverture de glace (e.g. Stickler and Alfredsen, 2009). Depuis les premières publications sur le sujet (e.g. Barnes, 1906; Altberg, 1936) elle a été étudiée sur le terrain (Hirayama et al., 1997; Kempema and Ettema, 2011; Terada et al., 1998) et en laboratoire (e.g. Clark and Doering, 2004; 2006; Qu and Doering, 2007). Plusieurs chercheurs ont tenté d‟expliquer les caractéristiques de la glace de fond (masse volumique, forme, répartition spatiale) en utilisant les caractéristiques d‟écoulement représentées par les nombres de Froude et de Reynolds (e.g. Kerr et al., 2002; Stickler and Alfredsen, 2009). Toutefois, alors que certaines études révèlent une relation claire (e.g. Doering et al., 2001), d‟autres ne révèlent aucun lien ou encore une relation faible (e.g. Yamazaki et al., 1996).
2
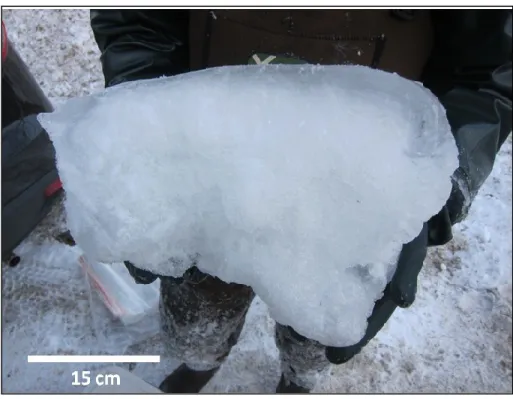
Figure 1.1. Accumulation de glace de fond sur un lit graveleux. L’écoulement est dans la direction de la caméra.
De plus, les processus d‟initiation et de développement de la glace de fond sont encore débattus à ce jour. En effet, les chercheurs ne sont pas unanimes à savoir si la glace de fond est « uniquement » formée par l‟attachement des cristaux de frasil (Kerr et al., 2002), « principalement » formée par l‟attachement des cristaux de frasil (e.g. Qu and Doering, 2007; Yamazaki et al., 1996), formée par croissance en place (in situ) de cristaux de glace (e.g. Tesaker, 1994) ou encore formée par une combinaison de ces deux processus (e.g. Kempema and Ettema, 2009; Tsang, 1982).
De façon générale, les seuils et des rapides représentent deux unités géomorphologiques (Montgomery and Buffington, 1997) où la glace de fond se développe rapidement dans le temps et connait une croissance verticale importante, contrôlant ainsi les niveaux d‟eau dans les sections mouille (pool) entre les seuils et les rapides. Lorsqu‟une accumulation de glace de fond émerge, partiellement ou sur toute la largeur du seuil (ou du rapide), elle devient par définition (e.g. Turcotte et al., 2013) un barrage de glace (ice dam). Composés à la fois de glace de fond poreuse et de glace dense formée par cristallisation successive de fines couches d‟eau appelée glaçage (icing), les barrages de glace (Figure 1.2) sont historiquement moins documentés que la glace de fond et ce, malgré leur impact important sur les conditions d‟écoulement. Étant souvent considérés comme une condition particulière du développement de la glace de fond, rares sont les études qui mettent l‟emphase sur les caractéristiques propres aux barrages de glace (e.g. Tesaker, 1994; 1996). De plus, aucune publication n‟a, jusqu‟à présent, permis de d‟identifier des distinctions entre la structure interne et les propriétés cristallographiques de la glace de fond et celles des barrages de glace.
3
Figure 1.2. Barrage de glace composé de glace de fond et recouvert de glaçage. L'écoulement est dans la direction de la caméra.
Plus récemment, certaines publications ont mis en lumière l‟influence des barrages de glace sur l‟hydrologie et l‟hydraulique des cours d‟eau (e.g. Stickler et al., 2010). L‟une de ces études (Turcotte et al., 2013) présente notamment les taux de croissance de barrages de glace situés dans différents chenaux à l‟intérieur d‟un bassin versant. Les résultats montrent une variabilité inter-chenal marquée et laissent entrevoir un niveau de variabilité à l‟échelle d‟un même chenal. De plus, cet article présente un modèle basé sur un bilan thermique adapté aux particularités des échanges thermiques dans les cours d‟eau à forte pente. La simulation réalisée permet de prédire les événements de surfusion de l‟eau ainsi que la durée des périodes de développement des barrages de glace. Le modèle n‟est toutefois pas conçu pour simuler la hauteur d‟eau stockée (backwater) à l‟amont d‟un barrage de glace en fonction des conditions environnementales locales.
1.2 Objectifs
Ce projet de recherche a pour but de non seulement combler certaines lacunes retrouvées dans la littérature sur la glace de fond et les barrages de glace, mais également d‟approfondir la compréhension des processus de formation de ces deux types de glace par l‟utilisation d‟outils d‟analyse et de modélisation innovateurs. De façon plus spécifique, ce projet de maîtrise en deux étapes vise dans un premier temps à 1) documenter et caractériser la structure interne et la cristallographie des barrages de glace et de la glace de fond, 2) quantifier les caractéristiques structurales propres à ces deux types de glace et 3) déterminer le(s) processus responsable(s) de leur développement. Cette première étape est donc consacrée à l‟étude microscopique de la formation de la glace dans les cours d‟eau à forte pente. Le champ de recherche est ensuite étendu au niveau macroscopique avec le second volet qui a pour objectifs de 4) quantifier la variabilité du taux de croissance des barrages de glace à l‟échelle d‟un chenal et 5) d‟expliquer cette variabilité en quantifiant l‟influence des paramètres environnementaux sur le développement des barrages de glace.
4
Cette recherche a été menée dans le bassin versant de la rivière Montmorency au nord de la région de Québec durant quelques semaines de l‟hiver 2011-2012 et durant la totalité de l‟hiver 2012-2013. Les sorties de terrain réalisées lors du premier hiver (2011-2012) ont permis de récolter des échantillons de barrage de glace qui ont ensuite été analysés à l‟aide d‟un tomodensitomètre (CAT scan). La méthodologie employée et les résultats obtenus sont présentés dans un premier article (Chapitre 2) tel que présenté à la conférence du CRIPE (Committee on River Ice Processes and the Environment) tenue à Edmonton en Alberta en juillet 2013. Lors du deuxième hiver (2012-2013), une nouvelle série d‟échantillons de glace a été récoltée et encore une fois analysée à l‟aide du CAT scan. Cette fois, la glace de fond a également été échantillonnée et des méthodes d‟analyse plus sophistiquées ont été employées. Les résultats sont présentés dans un second article (Chapitre 3) tel que publié en 2014 dans la revue scientifique Cold Regions Science and Technology. En plus des nombreux échantillons recueillis, l‟hiver 2012-2013 a permis de récolter une grande quantité de données hydrauliques, hydrologiques et météorologiques durant une période de 242 jours (23 octobre 2012 au 22 juin 2013). Parmi ces données, les taux de formation et de fonte des barrages de glace ont été comparés à six différents sites répartis sur près de 800 mètres à l‟intérieur du même cours d‟eau. De plus, l‟environnement d‟un barrage de glace spécifique a été intensément instrumenté, permettant ainsi d‟en modéliser son développement. Ces différentes données et ce modèle sont présentés dans un troisième article (Chapitre 4) tel que soumis à la revue scientifique Canadian Journal of Civil Engineering en septembre 2014. Chacun des chapitres (articles) de ce mémoire présente un ouvrage complet en soit qui comprend une revue de littérature, une description de la méthodologie employée, une présentation et une analyse des résultats, une discussion et une bibliographie. Ces chapitres représentent une suite logique de caractérisation, de quantification et de modélisation des processus développement de la glace de fond et des barrages de glace, s‟étendant de l‟échelle micro-locale jusqu‟à l‟échelle du cours d‟eau.
Références
Altberg, WJ. 1936. Twenty years of work in the domain of underwater ice formation, 1915-35. International Union of Geodesy and Geophysics, International Association of Scientific Hydrology 23: 373-407. Barnes, HT. 1906. Ice Formation with Special Reference to Anchor-Ice and Frazil. John Wiley & Sons: New
York, 257 pp.
Clark, S., Doering, J.C., 2004. A laboratory study of frazil ice size distributions. Proceedings of the 17th International IAHR Ice Symposium, Saint Petersburg, Russia, 291-297.
Clark, S., Doering, J. C., 2006. Effect of turbulence intensity on frazil formation. Proceedings of the 18th International IAHR Ice Symposium, 267-275.
Doering, J.C., Bekeris, L.E., Morris, M.P., Dow, K.E., Girling, W.C. 2001. Laboratory Study of Anchor Ice Growth. Journal of Cold Regions Engineering, March 2011, p. 60-66.
5 Hirayama K, Terada K, Sato M, Hirayama K, Sasamoto M, Yamazaki M. 1997. Field measurements of anchor
ice and frazil ice. In: Proceedings of the 9th CGU-HS CRIPE Workshop on the Hydraulics of Ice Covered Rivers, Fredericton, NB, Canada.
Kempema, E. W., Ettema, R. 2009. Variations in anchor-ice crystal morphology related to river flow characteristics. Proceedings of the 15th CGU-HS CRIPE Workshop on River Ice, St. John‟s, Newfoundland and Labrador, Canada.
Kempema, E. W., Ettema, R. 2011. Anchor ice rafting: observations from the Laramie River, River research and applications, Volume 27, Issue 9, p. 1126-1135
Kerr DJ, Shen HT, Daly SF. 2002. Evolution and hydraulics of anchor ice on gravel bed. Cold Reg. Sci. Technol. 35: 101–114.
Montgomery, D.R., Buffington, J.M., 1997. Channel-reach morphology in mountain drainage basins. GSA Bulletin 109 (5), 596-611.
Michel, B., 1978. Ice Mechanics, Les Presses de l‟Université Laval, Québec.
Qu, Y.X., Doering, J., 2007. Laboratory study of anchor ice evolution around rocks and on gravel beds. Canadian Journal of Civil Engineering 34, 46–55.
Stickler M, Alfredsen KT. 2009. Anchor ice formation in streams: a field study. Hydrol. Process. 23: 2307– 2315. DOI: 10.1002/hyp.7349.
Stickler M, Alfredsen KT, Linnansaari T, Fjeldstad H-P. 2010. The influence of dynamic ice formation on hydraulic heterogeneity in steep streams. River Res. Applic. 26: 1187–1197. DOI: 10.1002/rra.1331. Tesaker E. 1994. Ice formation in steep rivers. In: Proceedings of the 12th International IAHR Ice Symposium. Tesaker E. 1996. Interaction between ice and water flow in rapids. In: Proceedings of the 13th International
IAHR Ice Symposium.
Terada K, Hirayama K, Sasamoto M. 1998. Field measurement of anchor and frazil ice. In: Proceedings of 14th International IAHR Ice Symposium.
Tsang, G. 1982. Frazil and Anchor ice: A Monograph. National Research Council of Canada, Associate Committee on Hydrology, Subcommittee on Hydraulics of Ice Covered Rivers.
Turcotte B, Morse B, Anctil F. 2011. Steep channels freezeup processes. Proceedings of the 16th CGU-HS CRIPE Workshop on the Hydraulics of Ice Covered Rivers, Winnipeg, MB, Canada.
Turcotte, B., Morse, B., Dubé, M., Anctil, F., 2013. Quantifying steep channel freezeup processes, Cold Regions Science and Technology 94, 21-36.
Yamazaki, M., Hirayama, K., Sakai, S., Sasmoto, M., Kiyohara, M., Takiguichi, H., 1996. Formation of frazil and anchor ice. Proceedings of the IAHR Ice Symposium, pp. 488–496.
6 .
7
2. Formation and inner structure of ice dams in
steep channels
Mathieu Dubé1, Benoit Turcotte2, Brian Morse3 and Edward Stander4
1,2,3Université Laval, 1065, av. de la Médecine, Québec City, QC/Can, G1V 0A6
1[email protected]; 2[email protected]; 3[email protected]
4SUNY Cobleskill, Department of Natural Sciences, Cobleskill, New York, 12043
Résumé
Les barrages de glace sont des structures fascinantes qui se forment spontanément dans les cours d‟eau à forte pente durant la période de prise de glace. Ils augmentent dramatiquement les niveaux d‟eau à l‟amont et peuvent causer des inondations. Lorsqu‟ils se forment à l‟aval de stations hydroélectriques, ils peuvent réduire significativement la hauteur de chute et donc l‟énergie produite. Jusqu‟à présent, leur structure interne et leur porosité moyenne n‟ont pas été documentées. Cette étude vise à comprendre la formation des barrages de glace en répondant à quatre questions spécifiques : Quels processus cryologiques expliquent leur développement? De quels types de cristaux sont-ils faits? Quelle est leur porosité? Quel est leur profil typique?
Cet article présente des données originales recueillies sur deux chenaux du bassin versant de la rivière Montmorency où le développement des barrages de glace est connu pour son intensité. Les différentes mesures regroupent des photographies à intervalle, l‟évolution du niveau d‟eau ainsi que les températures de l‟eau et de l‟air. Le tout a été recueilli lors de deux événements de prise de glace durant l‟hiver 2011-2012. Des échantillons de barrage de glace on été analysés à l‟aide de la technologie CAT scan et de l‟analyse par sections minces. Les résultats du CAT scan ont révélé la composition interne et la porosité des échantillons de barrages de glace et ont été interprétés pour comprendre leur développement. Les sections minces ont permis de confirmer ce que le CAT scan a mesuré. En plus de l‟originalité des résultats présentés, ce projet est innovateur, car il utilise la technologie du CAT scan comme une méthode d‟analyse non destructrice des structures complexes et multidimensionnelles des barrages de glace.
8
Abstract
Ice dams are fascinating structures that spontaneously form across steep channels during the freezeup period. They dramatically increase the water level upstream and can cause overbank flooding. When they form downstream of hydroelectric dams, they can significantly reduce the available head and hence energy production. So far, their internal structure and overall porosity have not been documented. This study aims at understanding the formation of ice dams by answering four specific questions: What cryologic processes explain their development? What type of ice crystals are they made of? What is their porosity? What is their typical profile?
This paper presents original data from two channels of the Montmorency River watershed known for their intense ice dam development activity. Measurements include time-lapse photographs, water level records, and water and air temperatures collected during two freezeup events of the 2011-2012 winter. Ice dam samples were analyzed using CAT scan technology and thin sections. CAT scans revealed the inner composition and the porosity of ice dam samples and were interpreted to understand their development. Thin sections aided to understand what the CAT data quantified. Beyond the originality of the results presented in this work, this project is innovative because it uses CAT scan technology as a non-destructive method to analyze complex, multi-dimensional ice structures.
9
2.1 Introduction
Ice dams are fascinating ice structures that form in steep creeks, streams and rivers affected by subfreezing air temperatures. Despite their dominant presence in most cold regions gravel bed channels, ice dams remain poorly documented in the river ice literature. Recent studies have shown that they generate important channel blockage, they drastically raise water levels (e.g., Tesaker, 1994; Turcotte et al., 2013a), they affect flow patterns and water velocities that affect the conditions for ice cover formation (e.g., Stickler et al., 2010; Turcotte and Morse, 2010), they store a significant amount of water, thereby affecting downstream hydrological conditions (Turcotte et al., 2013b), and they lead to the development a unique, suspended ice cover that is supported by emerging rocks and banks (e.g., Tesaker, 1994; Turcotte et al., 2011). Ice dams seem to initially develop primarily under supercooling conditions but also buildup when the water temperature is at zero degree. Under a protracted period of cold air temperature, ice dams continue to grow and can eventually occupy the entire channel section despite a very small flow rate (Turcotte et al., 2013a).
In January 2012, ice dams were sampled in order to explore their internal structure and better understand their buildup dynamics. This paper presents a first attempt to classify their internal geometries, crystallography, and quantify their porosities. It will also describe the development processes as a function of air temperatures and local water levels.
2.2 Background
Ice processes taking place along low-gradient rivers have received substantial research attention over the last few decades. This research effort ultimately led to mitigation techniques that can prevent or minimize damage to infrastructures and improve local residents‟ safety (e.g. Ashton, 1986 and Prowse, 1955). In contrast, relatively few research efforts have specifically addressed steep channels ice processes.
Anchor ice represents the most documented steep channel ice form. It has been studied in the field (Bisaillon and Bergeron, 2009; Hirayama et al., 1997; Kempema and Ettema, 2011; Parkinson, 1984; Terada et al., 1998; Yamakazi et al., 1996) and in the lab (Clark and Doering, 2004; 2006; Kerr et al., 2002; Qu and Doering, 2007). Most anchor ice studies reported anchor ice release at sunrise or assumed that anchor ice was ephemeral. Relatively recently, complex, stable, anchored ice features such as ice dams have been described in detail (Stickler et al. 2010; Stickler and Alfredsen, 2009; Tesaker, 1994; 1996, Turcotte and Morse, 2010; Turcotte et al., 2011) and their thermal and hydrological impacts have been documented (Turcotte et al., 2012, 2013a,b). However, so far, no study has focused on the physical structure and unique buildup process of ice dams.
10
The characterization of ice structures is usually performed by analysing thin sections of ice under crossed polarizers (Michel 1978). Through crystallographic analysis (thin sections), one can define the growth properties of ice samples, as well as their deformational history. A detailed description of the technique can be found in Michel (1978), who separated low gradient freshwater ice into seven classes based on microstructure. More recently, ice structures have been characterized through the use of non invasive techniques such as Computed Axial Tomography (CAT). In a recent study, Gherboudj et al. (2007) used CAT scans to characterize air inclusions in river ice cores. This technology allows the visualization of the shape and size of air inclusions, and provides a method to quantify ice porosity.
2.3 Sampled sites
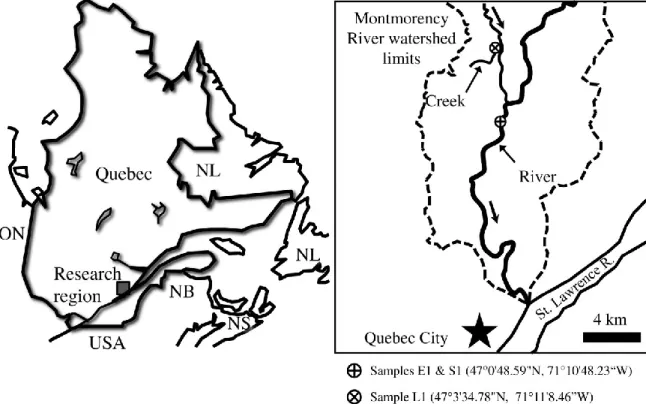
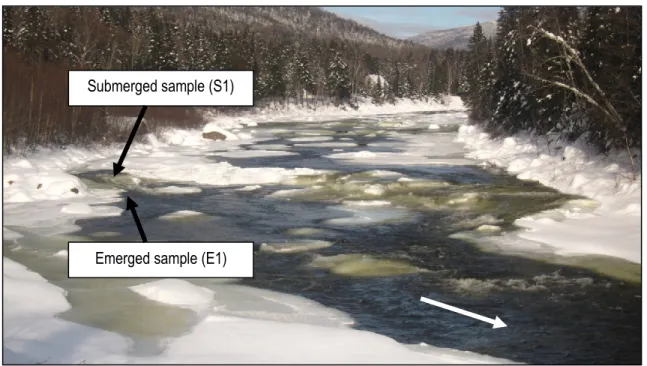
The Montmorency River drains 1100 km² of hilly forested terrain north of Quebec City, Canada (Fig. 2.1). Ice dam samples were collected from two different reaches: in the River itself and in the much smaller (watershed of 8 km2) Lepine Creek. The sampled River reach is 50 m-wide, presents a slope of 1%, and consists of rapids with numerous emergent boulders at low flow. At freezeup, the reach develops successive ice dams (Figs. 2.2 & 2.3), some of which have been observed to buildup to the floodplain level (1.5 m or so). Two ice samples (submerged [S1] and emerged [E1]; Fig. 2.2) were collected from an active (building up, water flowing on the dam crest) ice dam on Jan. 16th 2012.
11
Figure 2.2. Study site, Montmorency River, Quebec, Canada. The channel is 50 m-wide. The white arrow indicates flow direction.
Figure 2.3. Looking across the channel where the emerged ice dam sample (E1) was collected. Note the ice dam extension in the background.
Submerged sample (S1) (E1)
Emerged sample (E1)
12
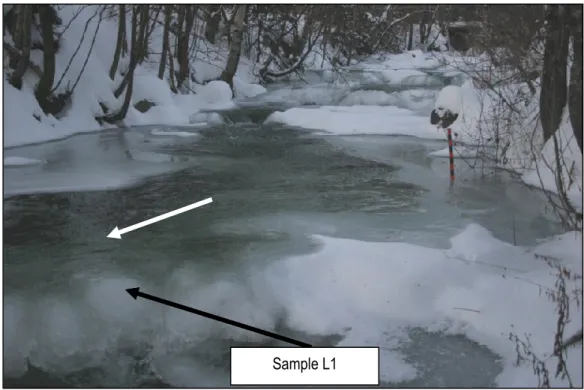
The sampled step-pool Creek reach is 4 m-wide and presents a slope of 2%. At freezeup, ice dams develop on each step. Some dams grow faster, drowning one or few upstream steps. One ice sample (L1; Fig. 2.4) was collected from a breached ice dam on Jan. 23rd 2012.
Figure 2.4. Sampled ice dam on Lepine Creek. Note the development of ice dams in the background. The white arrow indicates flow direction and the channel width is about 4 m.
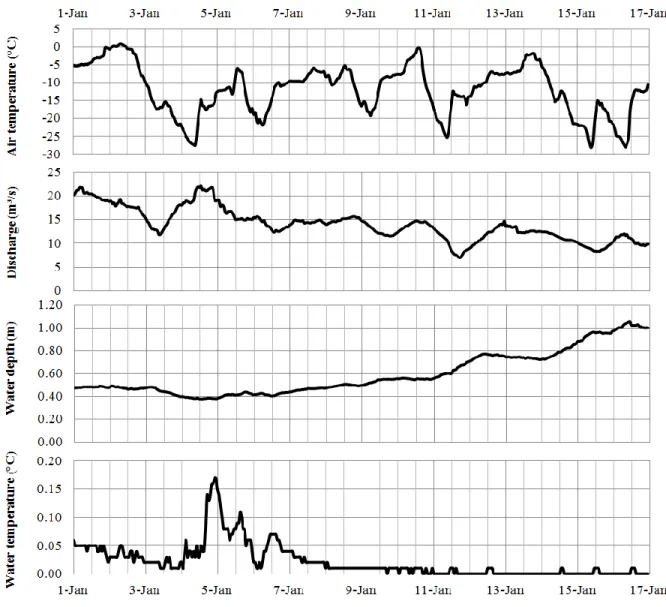
2.4 Hydrological and weather conditions during ice formation
Figure 2.5 presents the measured air temperature, discharge (Obtained from the Quebec Government), water depth, and water temperature data for the Montmorency River during the weeks prior to sampling. The water depth and water temperature data were recorded on an hourly basis using a YSI 6600 probe located 1.3 km upstream of the sampling site. Despite the two short cold spells that occurred between Jan. 1st and Jan. 7th,the water temperature in the River only dropped to 0°C after Jan. 8th. From that date, the water depth gradually increased while the discharge was decreasing (Fig. 2.5). Photographs taken by a fixed camera confirm that anchor ice and ice dam development began on Jan. 8th to 9th. On Jan. 16th (sampling date), ice dams were still building up, a process that ended few days later.Figure 2.6 presents the weather (air temperature) and hydrological (discharge, water depth and temperature) conditions at the Creek site during the weeks prior to sampling. The discharge was obtained from an upstream hydrometric station that was not affected by ice (Turcotte et al., 2013b) whereas the water depth and temperature were recorded on an hourly basis using a YSI 6600 probe located about 50 m upstream of the sampled ice dam. The structure of the sampled dam was formed by four distinct buildup events, each one
13 characterized by a rise and a subsequent drop in the measured water depth and by a water temperature equal to 0°C (Fig. 2.6).
Figure 2.5. Montmorency River data (Jan. 2012): water depth, water temperature and air temperature were recorded 1,3 km upstream of sampled ice dams E1 and S1. The River discharge was obtained from the Provincial Government (CEHQ) hydrometric station located about 20 km downstream.
14
Figure 2.6. Lepine Creek data (Dec. 2011 - Jan. 2012): air temperature, discharge, water depth and water temperature were recorded 50 m upstream of the sampled ice dam L1.
2.5 Sampling methodology
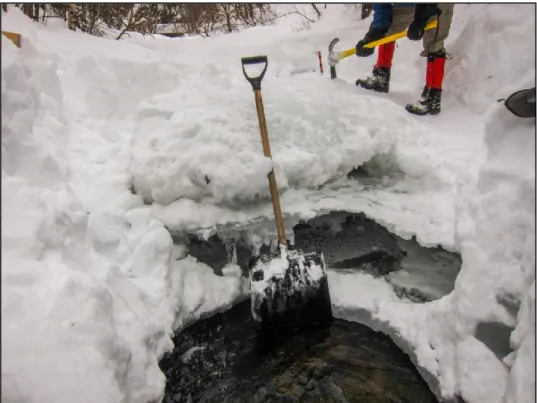
The two ice samples (E1: 15 x 26 x 27 cm & S1: 22 x 27 x 16 cm) were collected from a well-developed ice dam of the Montmorency River using a pickaxe. The structure of the samples was not altered by the axe strike as its rupture was sudden and fragile. The submerged sample S1 appeared to consist exclusively of anchor ice (Fig. 2.7), while the second sample E1 appeared to be composed of both anchor ice and solid ice. This sample was collected in a low-turbulence zone beside the main flow (Fig. 2.3). Once retrieved (Fig. 2.8), both samples were gravity-drained in order to remove as much interstitial water as possible and stored in sealed plastic bags at -10°C to prevent internal structure alteration.
The ice dam sample from Lepine Creek (L1: 18 x 18 x 29 cm) was collected from the surface part of a breached ice dam. Figure 2.9 clearly shows the impressive height of this ice dam (roughly 1.5 m). This figure also shows that this ice structure was completely dry at the moment of sampling, unlike E1 and S1 samples. Sample L1 was also collected using a pickaxe and stored in a sealed plastic bag at -10°C.
15
Figure 2.7. The submerged ice dam sample (S1) being collected.
16
Figure 2.9. Sampled ice dam on Lepine Creek. The flow is toward the camera.
2.6 CAT scan analysis
The internal structure of all samples was analyzed using a medical CAT scan (Siemens SOMATOM Sensation
64). As the CAT scanning was necessarily conducted at room temperature, the operations were limited to less
than 5 minutes for each sample to prevent significant melting. The resulting output for each sample was hundreds of DICOM images, each of which corresponded to one vertical slice (0.6 mm thick) through the sample formed of pixels of 0.55 x 0.55 mm in a 512 x 512 matrix. These images were analysed using Fiji free software.
DICOM files consist of 16-bit grayscale images. Brightness is defined by the pixel value, and ranges from -1024 to over 500. The higher the pixel value, the denser is the material. A value of 0 corresponds to pure water. By applying Fiji‟s selection tools, it is possible to create a histogram and a statistical report (max, min, mean, standard deviation) of the brightness variation within a selected sub-area. Calibration of the pixel values to obtain ice porosity was done by comparing the solid ice value (zero porosity) to that of air (100% porosity). Sub-areas were then analysed and the resulting porosity value was calculated using the following equation:
(%)
Mean pixel value Solid ice pixel value
100
Porosity
x
Air pixel value Solid ice pixel value
17
2.7 Results interpretation
The CAT scan data were used to visualize the inner components of each sampled ice dam and to determine the porosity of specific ice structures within those dams. Since sample E1 and L1 display similar ice structures, they are interpreted first, followed by the sample S1.
2.7.1 Emerged sample (E1)
Figure 2.10 presents a vertical slice of sample E1 showing multiple ice structures of variable porosity values (sub-areas are numbered with increasing porosity values). The entire lower structure (sub-areas 3 & 6) is anchor ice as typically described in the literature. It is composed of acicular crystals up to 10 mm in length (Fig. 2.11), apparently oriented randomly. This supports the possibility that anchor ice can form by the adhesion of frazil ice particles drifting in the water column and intercepted by a porous ice matrix (e.g., Kerr et al., 2002; Qu and Doering, 2007). Figure 2.11 further suggests that some frazil particles (as pointed by arrows) continued to grow in place after being intercepted by the anchor ice mass. Those crystals probably achieved a longer size than others because local, micro hydraulic conditions were favorable to their growth orientation.
The CAT scan data also reveal that the anchor ice portion of sample E1 have an overall porosity of 28-36%. This value lies between the low turbulence (Type I) and high turbulence (Type II) anchor ice types identified by Stickler and Alfredsen (2009), but it represent a fairly low porosity range compared with what has been reported by Parkinson (1984; 71-84%). This range is also dramatically different from the porosity values typically measured from a floating, frazil ice cover, whose porosity value tends to range from 1 to 18% (Gherboudj et al., 2007). This suggests that the anchor ice mass was submerged during the first stage of the ice dam buildup process, which impeded heat loss to the atmosphere and thus the freezing of interstitial water. By comparison, interstitial spaces within floating frazil ice pans exposed to cold air temperatures can freeze as they readily lose heat to the atmosphere.
As expected, the solid ice cap covering the sample (Fig. 2.10, sub-area 1) presents a very low porosity value (0.6%) and essentially consists of pure ice. Sub-area 2 (one of many ball-shaped structures) presents another pure ice structure with a porosity value close to 0%. The ice cap developed by progressive flooding and freezing (icing) and presents the same crystal characteristics (Fig. 2.12) as thermal ice (S2 in Michel, 1978) commonly found within floating ice covers. The solid ice in sub-areas 1 and 2 consists of long, thick crystals oriented perpendicularly to the surface from which they developed. However, unlike typical thermal ice forming downward at the undersurface of an existing floating ice cover, this thermal ice grew upward from the submerged ice dam surface into the water flowing on top. This growth mechanism also applies to the ball-shaped structures as suggested by the horizontal thin section presented in Figure 2.13. The large crystals diameters suggest that thermal growth was indeed the dominant mechanism and their orientation suggests
18
that they also formed upward in a relatively thin water layer (possibly sprayed water droplets on emerged ice) that allowed full freezing.
Sub-area 1 2 3 4 5 6 7 8
Porosity value 0.6% 1.5% 28% 28% 34% 36% 43% 48%
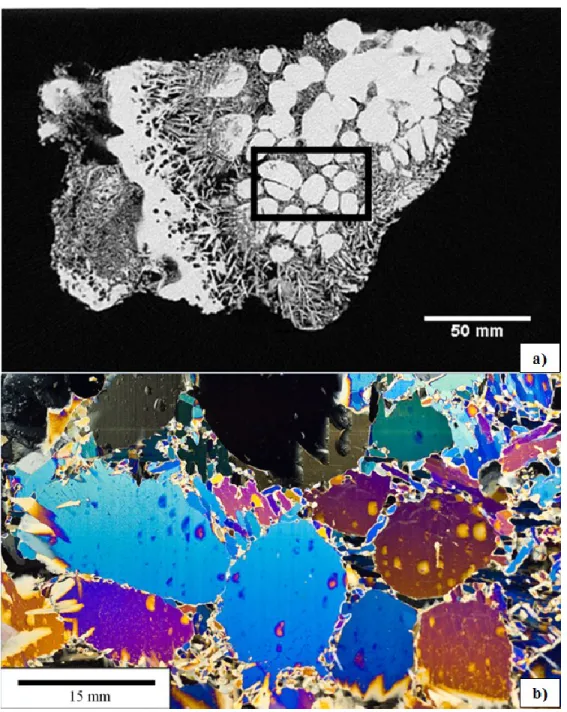
Figure 2.10. Inner structure and porosity values of sample E1 – The flow is from left to right the sample is oriented vertically as found in the field.
19
Figure 2.11. CAT scan (a) of sample E1 showing crystal orientations and porosity (grayscale) and (b) thin section using X polarizers (identified in 11a) showing the crystallography of an anchor ice sub-area.
Figure 2.12. CAT scan (a) of sample E1 showing crystal orientations and density (gray scale) and (b) thin section using X polarizers (identified in 12a) showing the crystallography of the ice cap and of the anchor ice immediately below.
At a later development stage, the ball-shaped ice structures probably became flooded. This would explain why a majority of ice crystals growing in the water preferentially oriented themselves perpendicularly to the surface of each ball. Since the favorable growth orientation of ice crystals is parallel to the heat flow (Michel, 1978), in this case upward toward the water surface, crystals that were initially favorably oriented progressively
a)
b)
20
consumed the unfavorably oriented ones. Thus, the preferential orientation became perpendicular to the water surface as the ice dam developed over the ball-shaped solid ice (Fig. 2.10).
Figure 2.13. (a) Horizontal CAT scan slice of sample E1 showing the ball-shaped solid ice and general porosity (grayscale) and (b) thin section using X polarizers (identified in 13a) showing the crystallography of the ball-shaped solid ice separated by relatively porous anchor ice.
The entire sample portion located between the solid ice balls and the solid ice cap is composed of layers with different porosities (sub-areas 4, 5, 7 & 8). There are three possible conditions or combinations of conditions that could explain these ice structures: (1) this layering could develop as a result of variations in ice growth: rapid crystal growth resulted in a greater amount of air entrainment, while slower crystal growth allowed the air
21 to escape while the crystals were developing. (2) The observed layering can also be explained by the water depth flowing over the ice dam during its development. A shallow flow results in a denser ice structure (icing) while a deeper flow lead to the development of a more porous structure corresponding to typical anchor ice. (3) Since these crystals present preferred orientations and relatively high porosity values (28-48%), it is believed that they nucleated on and grew upward from deposited layers of fine frazil ice. Snow entrained in the water and snow falling directly on the ice dam crest (the site received about 15 cm of snow between Jan. 12th and Jan. 14th) might also have provided nuclei for the formation of these ice layers.
It is important to note that the ice dam sample E1 does not represent the entire vertical dam section. In fact, the lower part of the dam could not be collected due to the strong adhesion to the bed and to the hazardous conditions of the site. This also applies to sample S1 presented in section 2.7.3.
2.7.2 Lepine Creek breached ice dam (L1)
Sample L1 presents multiple inner structures (Fig. 2.14) that are similar to those found in sample E1. First of all, sub-areas 1, 2 & 3 show porosity values close to 0% and therefore represent pure ice formed by the same icing process as described above. Moreover, sub-areas 4 and 5 present ice structures with porosity values comparable to that of anchor ice as presented in Fig. 2.10. The random orientation of the ice particles in those sub areas supports the possibility of frazil ice interception. On the other hand, the largest crystals stress the possibility of subsequent in situ growth in a deep, cold water environment.
The lower part of the sample (sub-areas 7 & 8) is composed of small round-shaped particles that are not observed in sample E1. This structure presents a much higher porosity (59-70%) than the anchor ice of sub-areas 4, 5 & 6 (31-45%) and the anchor ice of sample E1 (28-36%; Fig. 2.10, sub-sub-areas 3 & 6). The thin section of this part of the sample (Fig. 2.15) suggests that it is composed of frozen snowflakes. The bottommost part (sub-area 8) presents a higher porosity value than the part located immediately underneath (sub-area 7) a thin, solid ice layer. An analysis of the time-lapse photographs (Fig. 2.16) confirmed that the lower part of sample L1 was formed after a snowfall that took place between two ice dam buildup phases. Two freezeup processes might explain the variable porosity of this ice structure: (1) the flooding of the snow surface (as the water level began to increase) resulted in the fast development of a thin solid ice layer before the entire snow column (sub-areas 7 and 8) could get drowned. The porous ice in sub-area 8 would therefore be considered as dry-frozen snow whereas the development of normal snow ice implies slushing before complete freezing. (2) The entire snow column was indeed completely drowned as the water level increased but the air temperature was not cold enough to freeze the entire slush depth (sub-areas 7 and 8). As a result, some water remained unfrozen as the ice dam kept building up and this water was drained from the ice dam core when it got breached under milder air temperatures. Additional ice dam samples analysis combined with
22
complementary data should contribute in identifying the most probable freezeup process for this type of ice structure.
Sub-area 1 2 3 4 5 6 7 8
Porosity value 0% 1% 1% 31% 35% 45% 59% 70%
Figure 2.14. Inner structure and porosity values of sample L1 –flow is from left to right. The sample is tilted about 30° to the left from its vertical position.
23
Figure 2.15. (a) Vertival CAT scan slice of sample L1 showing snow ice (bottom of the sample) and general porosity (grayscale) and (b) thin section using X polarizers (identified in 15a) showing the crystallography of the snow ice.
Figure 2.16. Flooded snow accumulation on the sampled ice dam’s crest (L1) on Dec. 20th 2012. The arrow is indicates the flow direction.
2.7.3 Submerged sample (S1)
Figure 2.17 presents the internal structure and porosity values of different selected sub-areas found in sample S1. Similarly to samples E1 and L1, sample S1 is composed of ice structures with porosity values close to that
24
of pure ice (sub-areas 1, 2 & 3). It is likely that these layers formed by progressive flooding and freezing of thin water layers (icing process) during a freezeup phase characterized by the partial emergence of this ice dam portion. Nearer the surface of the sample, the pure ice (sub-area 2; slow flooding rate allowing all the water to freeze) give way to repeated horizontal solid ice layers separated by thin, porous anchor ice layers (sub-area 6; moderate flooding rate). Figure 2.18 shows a thin section of this type of alternating layers. The layers then evolve upward into long (25 mm in length), thick crystals with no horizontal stratification (Fig. 2.17, sub-area 7;
in situ crystal growth in a largely submerged, possibly supercooled environment). The ice crystal growth rate in
sub-area 7 was therefore slower than the flooding rate (controlled by downstream ice development).
Sub-area 1 2 3 4 5 6 7 8
Porosity value 0.3% 0.6% 1.1% 23% 35% 37% 37% 47%
Figure 2.17. Inner structure and porosity values of submerged sample S1. Cut made through the sample perpendicularly to the flow direction. The sample is oriented vertically as found in the field.
25
Figure 2.18. a) CAT scan of sample S1 showing crystal orientation and density (grayscale) and (b) thin section using X polarizers (identified in 18a) showing the crystallography of alternating solid-anchor ice layers.
2.8 Discussion
The combination of traditional thin section techniques and CAT scan analyses has proven to be a powerful tool to reveal the inner structure of ice dam samples. It allowed determining the porosity of ice dams, and provided detailed information on both crystal size distribution and orientation as well as on the different structures that can be found within ice dams. Interestingly, no typical ice dam profile was found throughout this analysis. This suggests that the inner composition of ice dams is most likely defined by local hydraulic and environmental conditions. As a consequence, two ice dams that develop on consecutive steps can display very different inner structures. Sixteen additional samples were retrieved during winter 2012-2013. Some, collected only a few meters apart showed important ice structure variations.
The Montmorency River and Lepine Creek ice dam samples consisted of both anchor ice and solid ice (icing). The porosity of the anchor ice structures varied between 28% and 45%. As a result, it is believed that, in the absence of preferential water conduits within the ice dam core and if buildup has not been interrupted by melting periods, only a small ratio of the channel discharge could flow through ice dams‟ core. This would further explain the constant flooding and freezing as well as the upward development of ice dams under cold air temperatures.
26
Results presented here suggest that classic anchor ice structures found within ice dams initially form by the deposition and interception of frazil ice particles. This is based on the fact that anchor ice sub-areas displayed nearly identical crystal sizes and shapes everywhere in the samples, with no initial preferential orientation. Afterward, favorably oriented crystals can grow to achieve impressive sizes. In turn, the solid ice structures were produced (1) when thin water layers were overtopping the dam surface and freezing afterward and (2) when water was sprayed on existing, emerged ice accumulations. The porosity of these structures was typically between 0% and 1.5% (effectively pure ice).
Ice dam development is a very dynamic freezeup process which takes place in steep channels. The buildup rates, known to range from 0.5 to 3.0 cm/hr (Turcotte et al., 2013 a), depends primarily on weather conditions and a feedback loop exists between growth rates and varying water levels (water storage reducing the discharge and water level). If the water level rises rapidly, some ice dam sections become submerged. In turn, slowly rising, stable, or ephemerally dropping water levels can lead to the emergence of anchor ice accumulations and to the development of denser ice structures. These ice structures will likely contribute to increase the strength of ice dams. This suggests that an ice dam that forms faster during one intense, cold spells could be more fragile than an ice dam that forms during multiple, successive cold spells alternating with partial melting periods. Further research on the topic is underway.
References
Bisaillon, J-F., Bergeron, N.E. 2009. Modeling anchor ice presence-absence in gravel bed rivers. Cold Regions Science and Technology, 55, p. 195-201.
Clark, S., Doering, J.C., 2004. A laboratory study of frazil ice size distributions. Proceedings of the 17th International IAHR Ice Symposium, Saint Petersburg, Russia, 291-297.
Clark, S., Doering, J.C., 2006. Effect of turbulence intensity on frazil formation. Proceedings of the 18th International IAHR Ice Symposium, 267-275.
Gherboudj, I., Bernier, M., Hicks, F., & Leconte, R. 2007. Physical characterization of air inclusions in river ice. Cold Regions Science and Technology, 49(3), p. 179–194.
Hirayama K, Terada K, Sato M, Hirayama K, Sasamoto M, Yamazaki M. 1997. Field measurements of anchor ice and frazil ice. In: Proceedings of the 9th CGU-HS CRIPE Workshop on the Hydraulics of Ice Covered Rivers, Fredericton, NB, Canada.
Kempema, E. W., & Ettema, R. (2011). Anchor ice rafting: observations from the Laramie River, River research and applications, Volume 27, Issue 9, p. 1126-1135
Kerr DJ, Shen HT, Daly SF. 2002. Evolution and hydraulics of anchor ice on gravel bed. Cold Reg. Sci. Technol. 35: 101–114.
27 Parkinson FE. 1984. Anchor ice effects on water levels in Lake St. Louis, St-Lawrence River at Montreal. In:
Proceedings of the 3rd CGU-HS CRIPE Workshop on the Hydraulics of River ice, Fredericton, NB, Canada.
Qu, Y.X., Doering, J., 2007. Laboratory study of anchor ice evolution around rocks and on gravel beds. Canadian Journal of Civil Engineering 34, 46–55.
Stickler M, Alfredsen KT. 2009. Anchor ice formation in streams: a field study. Hydrol. Process. 23: 2307– 2315. DOI: 10.1002/hyp.7349.
Stickler M, Alfredsen KT, Linnansaari T, Fjeldstad H-P. 2010. The influence of dynamic ice formation on hydraulic heterogeneity in steep streams. River Res. Applic. 26: 1187–1197. DOI: 10.1002/rra.1331. Tesaker E. 1994. Ice formation in steep rivers. In: Proceedings of the 12th International IAHR Ice Symposium. Tesaker E. 1996. Interaction between ice and water flow in rapids. In: Proceedings of the 13th International
IAHR Ice Symposium.
Terada K, Hirayama K, Sasamoto M. 1998. Field measurement of anchor and frazil ice. In: Proceedings of 14th International IAHR Ice Symposium.
Turcotte B, Morse B. 2011. Ice processes in a steep river basin. Cold Reg. Sci. Technol. 67: 146-156. DOI:10.1016/j.coldregions.2011.04.002.
Turcotte B, Morse B, Anctil F. 2011. Steep channels freezeup processes. Proceedings of the 16th CGU-HS CRIPE Workshop on the Hydraulics of Ice Covered Rivers, Winnipeg, MB, Canada.
Turcotte, B., Morse, B., Anctil, F., 2012. Cryologic continuum of a steep watershed. Hydrol. Process. In press. Turcotte, B., Morse, B., Dubé, M., Anctil, F., 2013a. Quantifying steep channel freezeup processes, Cold
Regions Science and Technology, in press.
Turcotte, B., Morse, B., Anctil, F., 2013b. The hydro-cryologic continuum of a steep watershed at freezeup. Journal of hydrology, under review.
Yamazaki, M., Hirayama, K., Sakai, S., Sasmoto, M., Kiyohara, M., Takiguichi, H., 1996. Formation of frazil and anchor ice. Proceedings of the IAHRIce Symposium, pp. 488–496.
29
3. Inner structure of anchor ice and ice dams in
steep channels
Mathieu Dubé1*, Benoit Turcotte2, Brian Morse3
1,2,3Université Laval, 1065, av. de la Médecine, Québec City, QC/Can, G1V 0A6 1[email protected]; 2[email protected]; 3[email protected]
Résumé
La formation dynamique de la glace, regroupant la glace de fond et des barrages de glace, est le processus dominant dans les cours d‟eau à forte pente (> 0.3%) durant la période hivernale. Elle a pour effet de contrôler les niveaux d‟eau, la résistance à l‟écoulement, la bathymétrie, le débit, la qualité de l‟eau et les habitats de poisson. Des modèles empiriques de ces processus sont disponibles mais dans l‟optique de développer des modèles plus physiques, il est nécessaire d‟approfondir les connaissances sur la nature de la glace retrouvée dans ces cours d‟eau. Cet article présente des données originales recueillies sur deux chenaux du bassin versant de la rivière Montmorency où le développement des barrages de glace est connu pour son intensité. Les différentes mesures prises durant l‟hiver 2012-2013 regroupent des photographies à intervalle, des photographies sous-marines, l‟évolution du niveau d‟eau ainsi que les températures de l‟eau et de l‟air. Des échantillons de glace de fond et de barrage de glace on été analysés à l‟aide de la technologie CAT scan et de l‟analyse par sections minces. Cette étude vise à comprendre les processus de développement de la glace de fond et des barrages de glace en s‟attardant aux types et à la taille de cristaux qui les composent, à leurs mécanismes de croissance, à leur orientation et à leur porosité.
Deux principaux types de cristaux ont été observés : cristaux de glace colonnaire et cristaux de frasil-fixé. De larges cristaux de glace colonnaire ayant crû vers le haut, de façon perpendiculaire à la surface de l‟écoulement ont seulement été observés dans les échantillons de barrages de glace. Les cristaux de frasil-fixé proviennent de la déposition ou l‟interception de particules de frasil dérivant dans la colonne d‟eau qui se sont fixé au lit et aux accumulations de glace existantes. Les résultats suggèrent que la croissance en place
(in-situ) des cristaux de frasil-fixé est le processus de formation dominant pour la glace de fond et les barrages de
glace. Les accumulations de frasil-fixé consistent en une masse de cristaux en forme de plaques interconnectés ayant une orientation préférentielle perpendiculaire au lit et à la surface de l‟eau. Ces accumulations montrent une porosité variable ayant une valeur moyenne de 41%. Lorsqu‟analysés en utilisant les images obtenues avec le CAT scan, les cristaux en plaques interconnectés apparaissent comme une structure dendritique en forme d‟arbre. La taille moyenne des segments de cristaux et la taille maximale des cristaux de frasil-fixés sont significativement plus importantes pour les échantillons de barrages de glace que pour les échantillons de glace de fond.
30
Abstract
Dynamic ice growth (composed primarily of anchor ice and ice dams) is the dominant process in steep (slope > 0.3%) channels during winter. The ice growth (in all its manifestations) regulates water levels, flow resistance, bathymetry, flow rate, water quality and fish habitat. Empirical models of the processes are available but in order to develop more physically-based models, more knowledge about the nature of ice in these channels is required. This paper presents original data from two channels of the Montmorency River watershed known for their intense anchor ice and ice dam development activity. The data include time-lapse photographs, underwater photographs, water level records, and water and air temperatures collected during winter 2012-2013. Moreover, anchor ice and ice dam samples were analysed with thin sections and using computed axial tomography (CAT) scan technology. This study aims at understanding the development processes of both anchor ice accumulations and ice dams by investigating their crystal types and sizes, their growth mechanisms, patterns, and orientation, and their porosity.
Two main types of ice crystals were observed: columnar ice crystals and fixed-frazil ice crystals. Relatively large columnar ice crystals grew upwards (away from the bed) perpendicularly to the local flow surface and were only observed in ice dam samples. Fixed-frazil crystals originated from the deposition and/or interception of drifting frazil particles that became “fixed” to the bed and to existing ice accumulations. The data suggest that in-situ growth of fixed-frazil ice crystals was the dominant process (accounted for the most ice development) for both anchor ice and ice dams. Fixed-frazil ice consists of a bonded mass of interlocking plate shaped crystals demonstrating a preference for to be perpendicular to the bed and water surfaces. The mass displays some variability in porosity (mean value 41%). When analysed using CAT scan slices, the interlocking plates appear as a tree-like or dendritic structure. The average size of resulting crystal segments and the maximum size of individual whole crystals within fixed-frazil ice structures were significantly more important for ice dam samples than for anchor ice samples.