E-services and physical fulfillment: How e-loyalty is created
Janjaap Semeijn, Allard C.R. van Riel, Marcel J.H. van Birgelen and
Sandra Streukens
1The authors
Janjaap Semeijn is based at the Department of Management Sciences, Open University,
Heerlen, the Netherlands.
Allard van Riel is based at the Ecole d’Administration des Affaires, University of Liège at
Sart Tilman, Belgium.
Marcel van Birgelen and Sandra Streukens are based at the Department of Marketing,
University of Maastricht, Maastricht, the Netherlands.
E-services and physical fulfillment: How e-loyalty is created
Keywords
E-quality, E-loyalty, E-fulfillment
Abstract
Most transactions initiated online are completed by some form of physical fulfillment, i.e. the delivery of the goods to the customer’s doorstep. In previous studies, website performance or e-service quality was found to be an important antecedent of customer satisfaction and loyalty. In traditional settings, physical fulfillment is considered an important driver of customers’ behavioral intentions. In the present study, combined effects of online and offline service components on customer responses are modeled and tested. A survey of online customers across four industries has generated important insights into the absolute and relative importance of two physical fulfillment dimensions. In the surveyed industries physical fulfillment appears to be at least as important as website performance. The role of third party logistics providers ensuring offline value and joy is substantiated.
Introduction
Loyal customers are crucial to business survival, especially in an electronic commerce
context (Reichheld and Schefter, 2000). Acquiring customers via the Web is costly
and since the competition is just a mouse click away, customer e-loyalty appears
essential in an economic as well as a competitive sense. A better understanding of
e-loyalty, its antecedents and its consequences is underway (e.g. Anderson and
Srinivasan, 2003; Srinivasan et al., 2002). Recent studies have explored the effects of
e-service quality on loyalty of online customers (Srinivasan et al., 2002; Van Riel et
al., 2004) by extending the ideas of Zeithaml et al. (1996) on traditional service
In traditional services, both functional and technical quality evaluations
(Grönroos, 1984) have been shown to influence customer satisfaction and patronage
behavior simultaneously. In an online setting, consumers are thought to base their
repurchase decisions on complex evaluations of the full service offer (Grönroos et al.,
2000; Porter, 2001). Most transactions initiated online are completed by some form of
physical fulfillment. Until now, the unique complementary roles of website
performance and physical fulfillment have been neglected in most empirical studies of
customer e-loyalty (Wolfinbarger and Gilly, 2003). In an online setting the question
can be raised whether online companies should invest in the further development of
online quality functions, or give priority to improving offline fulfillment (Lee and
Whang, 2001). In the present study, effects of online quality and offline fulfillment on
customer responses are modeled by extending existing e-quality models (Liljander et
al., 2002; Zeithaml et al., 2000). Analogous to the distinction made in service
research between measurable efficiency and effectiveness in the eyes of the individual
customer (e.g. Dubé and Menon, 2000; Surprenant and Solomon, 1987), we
differentiate between the dimensions of value and joy, both online and offline. The
extended model, which includes offline fulfillment, is validated with a substantial
cross-national survey of e-customers, in four different online industries.
The paper is structured as follows. First, a conceptual framework is developed.
Hypotheses are formulated on the combined effects of online quality and offline
fulfillment on customer satisfaction and customer loyalty. The empirical study and its
results will be presented next. The paper will conclude with a discussion of
managerial and theoretical implications.
Development of a conceptual framework
user interface which enables them to initiate the desired transactions themselves.
Previous research already identified the user interface to be a key determinant of
online service quality (Grönroos et al., 2000). Two factors that are important in this
respect are website aesthetics and website navigation (Zeithaml et al., 2000). The
aesthetics and looks of a website have been referred to as the ‘e-scape’ (Gummerus et
al., 2004; Van Riel et al., 2004). The e-scape is comparable to the traditional
servicescape (Bitner, 1990, 1992) and reflects how information is presented through
the use of colors, layout, pictures, and font size and style. Websites with adequate
navigation quality consistently enable users to easily find what they want, via a
dependable and well performing search engine, offering fast and logical
maneuverability (Jeong and Lambert, 2001; Liljander et al., 2002; Zeithaml et al.,
2000). An attractive e-scape creates an online environment that is likely to be more
effective in facilitating website navigation. Indeed, early research on text
comprehension showed significant differences between font types (Povlton, 1969).
More recent studies in industrial ergonomics (e.g. Myung, 2003; Wang et al., 2003)
show effects of text-background color combinations and line-spacing on website
comprehension and usability. Therefore, it is hypothesized that an attractive e-scape
contributes to perceptions of website navigation quality:
H1: A positive relationship exists between perceived quality of the website
e-scape and perceived quality of website navigation.
In turn, websites incorporating adequate navigation functionality are likely to provide
more value to customers than websites that are difficult to navigate. This is in line
with previous research indicating that navigational quality is a key facilitator of online
customer satisfaction with e-services (Liljander et al., 2002). Consequently, it is
H2: A positive relationship exists between perceived quality of website
navigation and online value perceptions.
The service quality dimension of reliability is often proposed to be one-dimensional
(Zeithaml et al., 2000). However, it has been difficult to establish a single factor with
sufficient discriminant validity due to the inherent ambiguity in the use of the term
(e.g. Van Riel et al., 2001). In an e-commerce context, reliability is often referring to
a functional quality dimension and at the same time to the reliability of the
information content provided on the site. This problem can be mitigated by covering
functional reliability of the website by navigation, as has been done in this study. The
reliability of the information provided on the website is operationalized as accuracy.
Accurate websites provide visitors with information that is considered useful and
reliable, most likely to occur effectively when the information is provided in an
attractive manner. The relationship between text difficulty and perceived accuracy has
been reported by Weaver III and Bryant (1995). Similar to website navigation, it is
expected that the e-scape can also function as a facilitator of website accuracy
perceptions:
H3: A positive relationship exists between perceived quality of the website
e-scape and perceived website accuracy.
In turn, analogous to offline service quality, e-service accuracy perceptions are likely
to evoke higher value perceptions in the eyes of the customer, as posited in the
following hypothesis:
H4: A positive relationship exists between perceived website accuracy and
online value perceptions.
The ability to customize website appearance and offerings to customer requirements
2000). Similar to the SERVQUAL dimension of empathy, customers expect to be
allowed, or even encouraged to make adaptations based on their personal preferences
and needs (Bitner et al., 2000), increasing the fit between the self and the website.
Customization will likely influence the joy experienced with the e-service. Therefore,
it is hypothesized that:
H5: A positive relationship exists between perceived website customization
and online joy perceptions.
When interacting with an online seller, it is crucial that users receive adequate and
timely support in case of any questions or problems. This corresponds to the
traditional SERVQUAL dimension of responsiveness as identified by Zeithaml et al.
(1996). It is expected that responsiveness to potential requests or problems will
improve perceptions of online joy:
H6: A positive relationship exists between perceived website
responsiveness and online joy perceptions.
The relationship between perceived service quality and customer satisfaction is
perhaps the most studied phenomenon in services research. This relationship is
generally confirmed in traditional service settings (cf. Dabholkar, 1995). Satisfaction
with websites was found to be positively influenced by website quality
(Bhattacherjee, 2001), and website quality attributes (Chen et al., 2002; Chen and
Wells, 1999; Kim and Stoel, 2004; Szymanski and Hise, 2000; Yang et al., 2003;
Yang et al., 2001). In a setting in which a website is one of the principal interfaces
between the customer and the firm, it can be expected that:
H7: A positive relationship exists between perceived online value and
overall customer satisfaction.
H8: A positive relationship exists between perceived online joy and overall
customer satisfaction.
In an e-commerce setting, physical fulfillment was recognized as an important
antecedent of customer response, such as satisfaction and loyalty (Wolfinbarger and
Gilly, 2003; Zeithaml et al., 2000). Traditionally, satisfaction is conceptualized as
consisting of rational as well as emotional components (Oliver, 1996). This
distinction is thought to be equally applicable to transactions that are initiated online
and finalized offline by a physical fulfillment process. Online, rational components
relate to e-quality dimensions such as website navigation and responsiveness. Website
design and feelings evoked are associated with emotions. With respect to physical
fulfillment, rationality pertains to perceptions of timely and adequate delivery of the
product, i.e. offline value. The experience of actually receiving the ordered product is
likely to evoke feelings of joy and pleasure, i.e. offline joy. It is hypothesized that:
H9: A positive relationship exists between perceived offline value and
overall customer satisfaction.
And
H10: A positive relationship exists between perceived offline joy and overall
customer satisfaction.
Customer satisfaction is expected to be positively related to customer loyalty (e.g.
Liljander and Strandvik, 1995; Zeithaml et al., 1996). In a study comparing online
versus offline environments, Shankar et al. (2003) found the positive relationship
between satisfaction and loyalty to be even stronger online than offline.
H11: A positive relationship exists between overall customer satisfaction and
Finally, assurance, or the level to which an organization is able to instigate trust in the
customer, is an important SERVQUAL dimension in offline environments. Online,
assurance has been found to be a relevant factor as well (Zeithaml et al., 2000),
conceivably more important than offline; online customers are less able to scrutinize
employees or the physical facilities of the organization with which they do business
(Reichheld and Schefter, 2000). Consequently, assurance must be established in other
ways, for example through guarantees and statements of privacy protection (Auh et
al., 2003). It has been argued that trust should be designed into online experiences in
order to make customers loyal (Schneiderman, 2000). Therefore, website assurance
can be expected to promote customer satisfaction and loyalty. It is hypothesized that:
H12: A positive relationship exists between perceived website assurance and
overall customer satisfaction.
And
H13: A positive relationship exists between perceived website assurance and
customer loyalty.
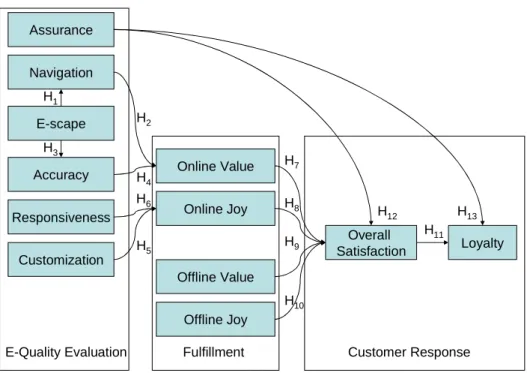
The hypotheses are summarized in the conceptual framework presented in Figure 1.
Further details on the empirical study conducted to validate the framework will be
provided in the next section.
[INSERT FIG. 1 HERE]
Empirical study
Research setting and sample design
To validate the conceptual framework, cross-sectional data were collected through an
online survey, focusing on four different online industries; books & CD’s, computer
hardware & electronics, computer software, and airline travel tickets. Around 400
included a request for further distribution. In order to increase the response rate,
participants were rewarded with a 5 Euro gift voucher. Respondents had 2 weeks time
to participate, generally considered to be a proper timeframe for generating enough
useful responses (Ilieva et al., 2002).
In total, 150 usable responses were generated. Of these responses, 110 came
from male and 40 from female participants. Five respondents were older than 54
years, 8 were between 45 and 54, 8 between 35 and 44, 47 between 25 and 34, and the
remaining 82 respondents were aged under 25. The sample consisted predominantly
of higher educated respondents; 112 participants were university-educated, 19 were
college-educated. The majority (60%) of the responses concerned perceptions about
industries with a strong tangible component (books & CD’s, computer hardware),
while 40% concerned more intangible services (computer software, travel services).
Questionnaire design
The items used to measure the constructs in the conceptual framework were based on
previous research by Liljander et al. (2002), Van Riel et al. (2004), and Gummerus et
al. (2004). Extra questions were included to cover the offline fulfillment dimension.
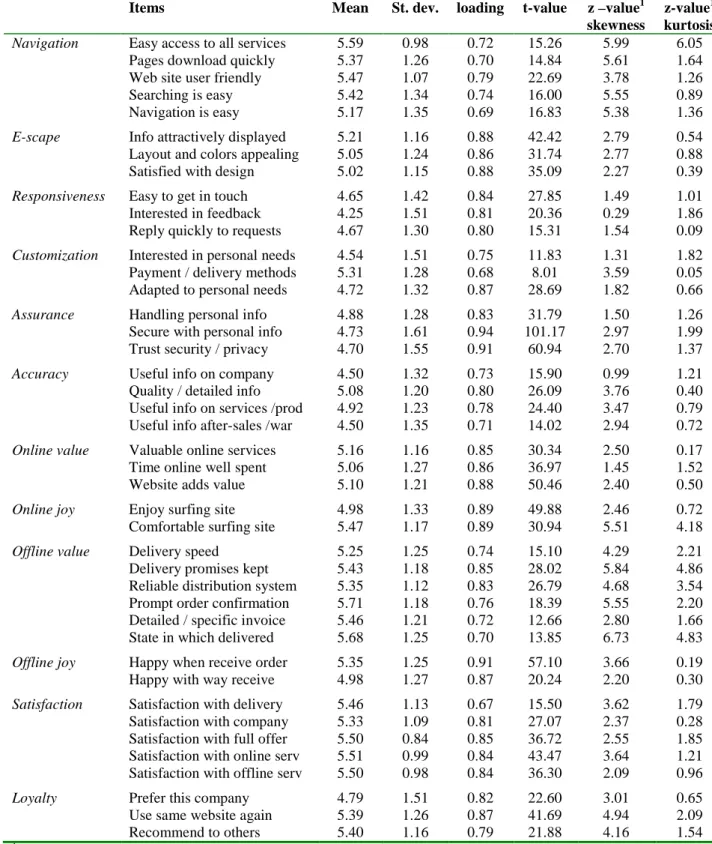
The descriptive statistics and measurement items can be found in Table 1.
[PLEASE INSERT TABLE 1 ABOUT HERE]
Methodology and analytical results
Both the measurement model and the structural model were estimated by means of
Partial Least Squares (PLS) (cf. White et al., 2003). For three reasons PLS is
considered to be the most appropriate analysis technique for the current study. First,
PLS makes no distributional assumptions (Fornell and Cha, 1994). As can be
concluded from Table 1, the distributions of the data are characterized by significant
methods which assume normally distributed data. Second, PLS is particularly suitable
for situations where the parameter-to-sample size is relatively small (Cassel et al.,
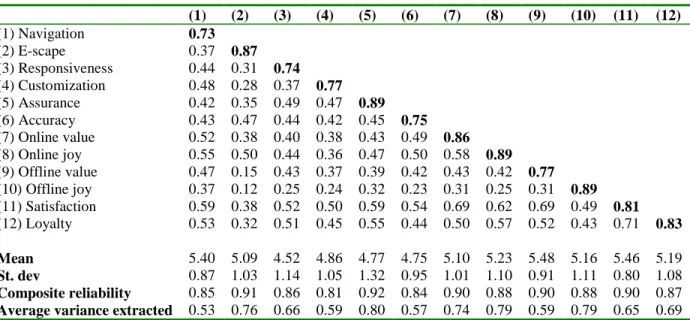
2000). Third, based on the correlations between constructs presented in Table 2,
multicollinearity might form a potential problem in interpreting the estimation results.
The use of PLS avoids this possible problem, as PLS results have been shown to be
very robust against multicollinearity (Cassel et al., 2000).
[PLEASE INSERT TABLE 2 ABOUT HERE]
Although PLS estimates the measurement and structural model simultaneously, a PLS
model is typically analyzed and interpreted sequentially in two stages (Hulland, 1999;
White et al., 2003). First, the measurement or outer model is evaluated in terms of
reliability and validity. Second, the structural or inner model is assessed. This
sequence produces reliable and valid measures of constructs before attempting to
draw conclusions about inter-construct relationships (Plouffe et al., 2001).
Results measurement model
Reliability
Inspection of the individual item loadings presented in Table 1 indicates that all items
load higher than 0.50 on their respective construct, thereby providing support for a
high degree of individual item reliability (Hulland, 1999; White et al., 2003).
Jöreskog’s (1971) measure of composite reliability is used to assess the internal
consistency of items hypothesized to measure a single construct (cf. Fornell and
Larcker, 1981). Table 2 shows that the items measuring the constructs can be
considered internally consistent, as in all instances all composite reliability values
Validity
Within-method convergent validity of the constructs is provided by inspection of each
construct’s average variance extracted figure. As all average variance extracted values
are above 0.50, it can be stated that the within-method convergent validity of the
constructs used in this study is acceptable (Chin and Newsted, 1999). In addition,
discriminant validity is assessed by means of Fornell and Larcker’s (1981) test of
average trait variance extracted. As for all construct pairs the square of the average
variance extracted from the traits exceed the correlation between the two respective
constructs, evidence for the presence of discriminant validity is provided (cf. Chin,
1998).
Results structural model
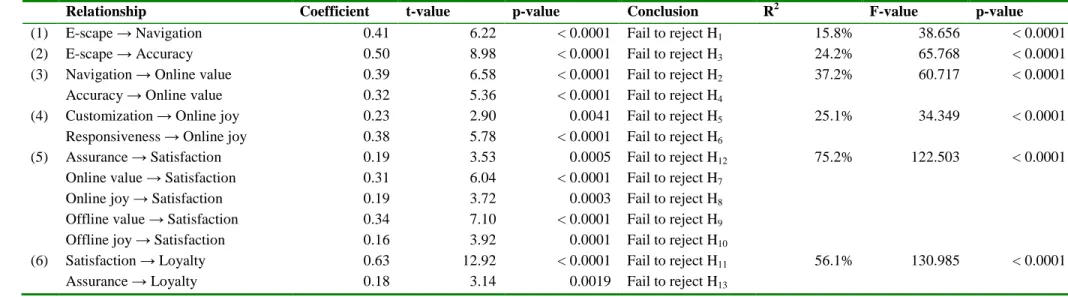
The empirical results for the structural model are presented in Table 3. Overall, our
model shows a good fit to the data as evidenced by the significant F-values. The
t-values accompanying the individual coefficients are obtained via a bootstrap
procedure consisting of 500 runs (White et al., 2003).
[PLEASE INSERT TABLE 3 ABOUT HERE]
The statistical significance of all individual relationships provide strong empirical
support for our conceptual framework. Starting on the left hand side, the design of the
e-scape appears to have a strong positive impact on both navigation (β = 0.41; t = 6.22) and accuracy (β = 0.50; t = 8.98). In turn, navigation and accuracy have a significant influence on perceived online value (navigation: β = 0.39; t = 6.58 / accuracy: β = 0.32; t = 5.36). With regard to online joy, our analysis reveals that online joy is determined by both customization (β = 0.23; t = 2.90) and responsiveness (β = 0.38; t = 5.78). E-quality perceptions with regard to assurance
was found to directly influence overall satisfaction (β = 0.19; t = 3.53) and loyalty (β = 0.18; t = 3.14).
Concerning the effect of the various online and offline performance perceptions on
overall satisfaction, the data support all hypothesized effects. In order of decreasing
importance, variance in overall satisfaction seems to be determined by: offline value
(β = 0.34; t = 7.10), online value (β = 0.31; t = 6.04), online joy (β = 0.19; t = 3.72) and offline joy (β = 0.16; t = 3.92). Overall satisfaction has a strong positive influence on customer loyalty (β = 0.63; t = 12.92).
Conclusion and implications
While expressing concern about "the last mile" (Esper et al., 2003), existing literature
on e-services and logistics has largely neglected the relative importance of the offline
dimension (Lee and Whang, 2001). The objective of this study was to determine the
relative contribution of online quality and offline fulfillment in creating overall
customer satisfaction, and hence loyalty. Our findings regarding e-quality dimensions
were consistent with earlier studies on e-services (e.g. Liljander et al., 2002; Zeithaml
et al., 2000), explaining over 60% of the variance for online value and joy combined.
Secondly, offline fulfillment is at least as important in determining overall satisfaction
as online quality. Specifically, offline value appears to rank slightly higher than online
value, while online joy slightly outranks offline joy. The proposed model combining
online and offline components shows a very good fit and explains 75% of the variance
in customer satisfaction. Thirdly, a significant relationship was found between overall
customer satisfaction and loyalty, confirming earlier work of Liljander and Strandvik
(1995) and Zeithaml et al. (1996). Overall, it appears that offline fulfillment is the
should carefully assess their present approaches, including the use of third party
logistics.
Suggestions for further research
A comprehensive approach is needed and careful evaluation of how value and joy are
created as part of the total e-experience is required. The importance of physical
fulfillment in effecting customer satisfaction and loyalty levels for different online
services certainly needs further investigation. The distinction made between value and
joy for both online quality and offline fulfillment seems a useful approach for future
studies. Measuring joy, whether online or offline, is perhaps more challenging since
joy could change with each consecutive purchase. Further study could generate more
precise indicators, helping companies to address their customers' needs most
effectively. Finally, the role of third party logistics providers ensuring offline value
and joy is another fruitful line of research.
Fig. 1: Conceptual framework Overall Satisfaction Responsiveness Loyalty Offline Joy Offline Value Online Value Accuracy Assurance Customization E-scape Navigation
Fulfillment Customer Response E-Quality Evaluation H11 H7 H12 H8 H1 H6 H4 H3 H2 H5 Online Joy H13 H10 H9
Table 1: Descriptive statistics on item level
Items Mean St. dev. loading t-value z –value1
skewness
z-value1 kurtosis
Navigation Easy access to all services 5.59 0.98 0.72 15.26 5.99 6.05
Pages download quickly 5.37 1.26 0.70 14.84 5.61 1.64
Web site user friendly 5.47 1.07 0.79 22.69 3.78 1.26
Searching is easy 5.42 1.34 0.74 16.00 5.55 0.89
Navigation is easy 5.17 1.35 0.69 16.83 5.38 1.36
E-scape Info attractively displayed 5.21 1.16 0.88 42.42 2.79 0.54
Layout and colors appealing 5.05 1.24 0.86 31.74 2.77 0.88
Satisfied with design 5.02 1.15 0.88 35.09 2.27 0.39
Responsiveness Easy to get in touch 4.65 1.42 0.84 27.85 1.49 1.01
Interested in feedback 4.25 1.51 0.81 20.36 0.29 1.86
Reply quickly to requests 4.67 1.30 0.80 15.31 1.54 0.09
Customization Interested in personal needs 4.54 1.51 0.75 11.83 1.31 1.82
Payment / delivery methods 5.31 1.28 0.68 8.01 3.59 0.05
Adapted to personal needs 4.72 1.32 0.87 28.69 1.82 0.66
Assurance Handling personal info 4.88 1.28 0.83 31.79 1.50 1.26
Secure with personal info 4.73 1.61 0.94 101.17 2.97 1.99
Trust security / privacy 4.70 1.55 0.91 60.94 2.70 1.37
Accuracy Useful info on company 4.50 1.32 0.73 15.90 0.99 1.21
Quality / detailed info 5.08 1.20 0.80 26.09 3.76 0.40
Useful info on services /prod 4.92 1.23 0.78 24.40 3.47 0.79 Useful info after-sales /war 4.50 1.35 0.71 14.02 2.94 0.72
Online value Valuable online services 5.16 1.16 0.85 30.34 2.50 0.17
Time online well spent 5.06 1.27 0.86 36.97 1.45 1.52
Website adds value 5.10 1.21 0.88 50.46 2.40 0.50
Online joy Enjoy surfing site 4.98 1.33 0.89 49.88 2.46 0.72
Comfortable surfing site 5.47 1.17 0.89 30.94 5.51 4.18
Offline value Delivery speed 5.25 1.25 0.74 15.10 4.29 2.21
Delivery promises kept 5.43 1.18 0.85 28.02 5.84 4.86
Reliable distribution system 5.35 1.12 0.83 26.79 4.68 3.54
Prompt order confirmation 5.71 1.18 0.76 18.39 5.55 2.20
Detailed / specific invoice 5.46 1.21 0.72 12.66 2.80 1.66
State in which delivered 5.68 1.25 0.70 13.85 6.73 4.83
Offline joy Happy when receive order 5.35 1.25 0.91 57.10 3.66 0.19
Happy with way receive 4.98 1.27 0.87 20.24 2.20 0.30
Satisfaction Satisfaction with delivery 5.46 1.13 0.67 15.50 3.62 1.79
Satisfaction with company 5.33 1.09 0.81 27.07 2.37 0.28
Satisfaction with full offer 5.50 0.84 0.85 36.72 2.55 1.85 Satisfaction with online serv 5.51 0.99 0.84 43.47 3.64 1.21 Satisfaction with offline serv 5.50 0.98 0.84 36.30 2.09 0.96
Loyalty Prefer this company 4.79 1.51 0.82 22.60 3.01 0.65
Use same website again 5.39 1.26 0.87 41.69 4.94 2.09
Recommend to others 5.40 1.16 0.79 21.88 4.16 1.54
1
Table 2: Descriptive statistics on factor level (1) (2) (3) (4) (5) (6) (7) (8) (9) (10) (11) (12) (1) Navigation 0.73 (2) E-scape 0.37 0.87 (3) Responsiveness 0.44 0.31 0.74 (4) Customization 0.48 0.28 0.37 0.77 (5) Assurance 0.42 0.35 0.49 0.47 0.89 (6) Accuracy 0.43 0.47 0.44 0.42 0.45 0.75 (7) Online value 0.52 0.38 0.40 0.38 0.43 0.49 0.86 (8) Online joy 0.55 0.50 0.44 0.36 0.47 0.50 0.58 0.89 (9) Offline value 0.47 0.15 0.43 0.37 0.39 0.42 0.43 0.42 0.77 (10) Offline joy 0.37 0.12 0.25 0.24 0.32 0.23 0.31 0.25 0.31 0.89 (11) Satisfaction 0.59 0.38 0.52 0.50 0.59 0.54 0.69 0.62 0.69 0.49 0.81 (12) Loyalty 0.53 0.32 0.51 0.45 0.55 0.44 0.50 0.57 0.52 0.43 0.71 0.83 Mean 5.40 5.09 4.52 4.86 4.77 4.75 5.10 5.23 5.48 5.16 5.46 5.19 St. dev 0.87 1.03 1.14 1.05 1.32 0.95 1.01 1.10 0.91 1.11 0.80 1.08 Composite reliability 0.85 0.91 0.86 0.81 0.92 0.84 0.90 0.88 0.90 0.88 0.90 0.87 Average variance extracted 0.53 0.76 0.66 0.59 0.80 0.57 0.74 0.79 0.59 0.79 0.65 0.69 All correlations are significant at the .05 level. Square root values of average variance extracted on the diagonal.
Table 3: Results structural model
Relationship Coefficient t-value p-value Conclusion R2 F-value p-value
(1) E-scape → Navigation 0.41 6.22 < 0.0001 Fail to reject H1 15.8% 38.656 < 0.0001
(2) E-scape → Accuracy 0.50 8.98 < 0.0001 Fail to reject H3 24.2% 65.768 < 0.0001
(3) Navigation → Online value 0.39 6.58 < 0.0001 Fail to reject H2 37.2% 60.717 < 0.0001
Accuracy → Online value 0.32 5.36 < 0.0001 Fail to reject H4
(4) Customization → Online joy 0.23 2.90 0.0041 Fail to reject H5 25.1% 34.349 < 0.0001
Responsiveness → Online joy 0.38 5.78 < 0.0001 Fail to reject H6
(5) Assurance → Satisfaction 0.19 3.53 0.0005 Fail to reject H12 75.2% 122.503 < 0.0001
Online value → Satisfaction 0.31 6.04 < 0.0001 Fail to reject H7
Online joy → Satisfaction 0.19 3.72 0.0003 Fail to reject H8
Offline value → Satisfaction 0.34 7.10 < 0.0001 Fail to reject H9
Offline joy → Satisfaction 0.16 3.92 0.0001 Fail to reject H10
(6) Satisfaction → Loyalty 0.63 12.92 < 0.0001 Fail to reject H11 56.1% 130.985 < 0.0001
References
Anderson, R.E. and Srinivasan, S.S. (2003), "E-satisfaction and e-loyalty: A contingency framework", Psychology and Marketing, Vol. 20 No. 2, pp. 123-38.
Auh, S., Salisbury, L.C., and Johnson, M.D. (2003), "Order effects in customer satisfaction modelling", Journal of Marketing Management, Vol. 19 No. 3/4, pp. 379-401.
Bhattacherjee, A. (2001), "An empirical analysis of the antecedents of electronic commerce service continuance", Decision Support Systems, Vol. 32 No. 2, pp. 201-14.
Bitner, M.J. (1990), "Evaluating service encounters: The effects of physical surroundings and employee responses", Journal of Marketing, Vol. 54 No. 2, pp. 69-82.
Bitner, M.J. (1992), "Servicescapes: The impact of physical surroundings on customers and employees", Journal of Marketing, Vol. 56 No. 2, pp. 57-71.
Bitner, M.J., Brown, S.W., and Meuter, M.L. (2000), "Technology infusion in service
encounters", Journal of the Academy of Marketing Science, Vol. 28 No. 1, pp. 138-49.
Cassel, C.M., Hackl, P., and Westlund, A.H. (2000), "On measurement of intangible assets: A study of robustness of partial least squares", Total Quality Management, Vol. 11 No. 7, pp. S897-S907.
Chen, Q., Clifford, S.J., and Wells, W.D. (2002), "Attitude toward the site II: New information", Journal of Advertising Research, Vol. 42 No. 2, pp. 33-46.
Chen, Q. and Wells, W.D. (1999), "Attitude toward the site", Journal of Advertising
Research, Vol. 39 No. 5, pp. 27-37.
Chin, W.W. (1998), "The partial least squares approach for structural equation modeling," in Marcoulides, G.A. (Ed.), Modern Methods for Business Research, Lawrence Erlbaum Associates, Hillsdale, NJ, pp.
Chin, W.W. and Newsted, P.R. (1999), "Structural equation modeling analysis with small samples using partial least squares," in Hoyle, R.R. (Ed.), Statistical Strategies for
Small Sample Research, Sage, Thousand Oaks, CA, pp. 307-41.
Dabholkar, P.A. (1995), "A contingence framework for predicting causality between customer satisfaction and service quality", Advances in Consumer Research, Vol. 22 No. 1, pp. 101-08.
Dubé, L. and Menon, K. (2000), "Multiple roles of consumption emotions in post-purchase satisfaction with extended service transactions", International Journal of Service
Industry Management, Vol. 11 No. 3, pp. 287-305.
Esper, T.L., Jensen, T.D., Turnipseed, F.L., and Burton, S. (2003), "The last mile: An examination of online retail delivery strategies on consumers", Journal of Business
Fornell, C. and Cha, J. (1994), "Partial least squares," in Bagozzi, R.P. (Ed.), Advanced
Methods of Marketing Research, Blackwell, Oxford, pp. 52-78.
Fornell, C. and Larcker, D.F. (1981), "Evaluating structural equation models with
unobservable variables and measurement error", Journal of Marketing Research, Vol. 18 No. 1, pp. 39-50.
Grönroos, C. (1984), "A service quality model and its marketing implications", European
Journal of Marketing, Vol. 18 No. 4, pp. 36-44.
Grönroos, C., Heinonen, F., Isoniemi, K., and Lindholm, M. (2000), "The netoffer model: A case example from the virtual marketspace", Management Decision, Vol. 38 No. 4, pp. 243-52.
Gummerus, J., Liljander, V., Pura, M., and Van Riel, A. (2004), "Customer loyalty to content-based web-sites. The case of an online health care service." Journal of Services
Marketing, Vol. 18 No. 3, pp. 175-86.
Hulland, J. (1999), "Use of partial least squares (PLS) in strategic management research: A review of four recent studies", Strategic Management Journal, Vol. 20 No. 2, pp. 195-204.
Ilieva, J., Baron, S., and Healy, N.M. (2002), "Online surveys in marketing research: Pros and cons", International Journal of Market Research, Vol. 44 No. 3, pp. 361-76.
Jeong, M. and Lambert, C. (2001), "Adaptation of an information quality framework to measure customers' behavioral intentions to use lodging web sites", International
Journal of Hospitality Management, Vol. 20 No. 2, pp. 129-46.
Jöreskog, K.G. (1971), "Simultaneous factor analysis in several populations", Psychometrika, Vol. 36, pp. 409-26.
Kim, S. and Stoel, L. (2004), "Apparel retailers: Website quality dimensions and satisfaction",
Journal of Retailing and Consumer Services, Vol. 11 No. 2, pp. 109-17.
Lee, H.L. and Whang, S. (2001), "Winning the last mile of e-commerce", Sloan Management
Review, Vol. 42 No. 4, pp. 54-62.
Liljander, V. and Strandvik, T. (1995), "The relation between service quality, satisfaction and intentions," in Kunst, P. and Lemmink, J. (Eds.), Managing Service Quality, Paul Chapman Publishing, London, pp. 45-63.
Liljander, V., Van Riel, A.C.R., and Pura, M. (2002), "Customer satisfaction with e-services: The case of an on-line recruitment portal," in Bruhn, M. and Stauss, B. (Eds.),
Jahrbuch Dienstleistungsmanagement 2002 - Electronic Services -, Gabler,
Wiesbaden, pp. 407-32.
Myung, R. (2003), "Conjoint analysis as a new methodology for Korean typography guideline in web environment", International Journal of Industrial Ergonomics, Vol. 32 No. 5, pp. 341-49
Nunnally, J.C. and Bernstein, I.H. (1994), PsychometricTheory (3rd ed.), McGraw-Hill, New York.
Oliver, R.L. (1996), Satisfaction: A Behavioral Perspective on the Consumer, McGraw-Hill, New York.
Plouffe, C.R., Hulland, J.S., and Vandenbosch, M. (2001), "Research report: Richness versus parsimony in modeling technology adoption decisions--understanding merchant adoption of a smart card-based payment system", Information Systems Research, Vol. 12 No. 2, pp. 208-23.
Porter, M.E. (2001), "Strategy and the internet", Harvard Business Review, Vol. 79 No. 3, pp. 63-78.
Povlton, E.C. (1969), "Asymmetrical transfer in reading texts produced by teleprinter and by typewriter", Journal of Applied Psychology, Vol. 53 No. 3, pp. 244-50.
Reichheld, F.F. and Schefter, P. (2000), "E-loyalty: Your secret weapon on the web",
Harvard Business Review, Vol. 78 No. 4, pp. 105-13.
Schneiderman, B. (2000), "Designing trust into online experiences", Communications of the
ACM, Vol. 43 No. 12, pp. 57-59.
Shankar, V., Smith, A.K., and Rangaswamy, A. (2003), "Customer satisfaction and loyalty in online and offline environments", International Journal of Research in Marketing, Vol. 20 No. 2, pp. 153-75.
Srinivasan, S.S., Anderson, R.E., and Ponnavolu, K. (2002), "Customer loyalty in
e-commerce: An exploration of its antecedents and consequences", Journal of Retailing, Vol. 78 No. 1, pp. 41-51.
Surprenant, C.F. and Solomon, M.R. (1987), "Predictability and personalization in the service encounter", Journal of Marketing, Vol. 51 No. 2, pp. 86-96.
Szymanski, D.M. and Hise, R.T. (2000), "E-satisfaction: An initial examination", Journal of
Retailing, Vol. 76 No. 3, pp. 309-22.
Van Riel, A.C.R., Lemmink, J., Streukens, S., and Liljander, V. (2004), "Boost customer loyalty with online support: The case of mobile telecoms providers", International
Journal of Internet Marketing and Advertising, Vol. 1 No. 1, pp. 4-23.
Van Riel, A.C.R., Liljander, V., and Jurriëns, P. (2001), "Exploring consumer evaluations of e-services: A portal site", International Journal of Service Industry Management, Vol. 12 No. 4, pp. 359-77.
Wang, A.-H., Fang, J.-J., and Chen, C.-H. (2003), "Effects of VDT leading-display design on visual performance of users in handling static and dynamic display information dual-tasks", International Journal of Industrial Ergonomics, Vol. 32 No. 2, pp. 93-104.
Weaver III, C.A. and Bryant, D.S. (1995), "Monitoring of comprehension: The role of text difficulty in metamemory for narrative and..." Memory & Cognition, Vol. 23 No. 1, pp. 12-23.
White, J.C., Varadarajan, P.R., and Dacin, P.A. (2003), "Market situation interpretation and response: The role of cognitive style, organizational culture, and information use."
Journal of Marketing, Vol. 67 No. 3, pp. 63-79.
Wiertz, C., De Ruyter, K., Keen, C., and Streukens, S. (2004), "Cooperating for service excellence in multichannel service systems: An empirical assessment", Journal of
Business Research, Vol. 57 No. 4, pp. 424-37.
Wolfinbarger, M. and Gilly, M.C. (2003), "eTailQ: Dimensionalizing, measuring and predicting etail quality", Journal of Retailing, Vol. 79 No. 3, pp. 183-98.
Yang, Z., Peterson, R.T., and Cai, S. (2003), "Services quality dimension of Internet retailing: An exploratory analysis", Journal of Services Marketing, Vol. 17 No. 6/7, pp. 685-700.
Yang, Z., Peterson, R.T., and Huang, L. (2001), "Taking the pulse of Internet pharmacies",
Marketing Health Services, Vol. 21 No. 2, pp. 5-10.
Zeithaml, V.A., Berry, L.L., and Parasuraman, A. (1996), "The behavioral consequences of service quality", Journal of Marketing, Vol. 60 No. 2, pp. 31-46.
Zeithaml, V.A., Parasuraman, A., and Malhotra, A. (2000), "A conceptual framework for understanding e-service quality: Implications for future research and managerial practice", Working Paper, Report Nr. 00-115, Marketing Science Institute, Cambridge, MA.