MINISTERE DE L’ENSEIGNEMENT SUPERIEUR ET DE LA RECHERCHE SCIENTIFIQUE
UNIVERSITE AKLI MOHAND OULHADJ – BOUIRA
FACULTE DES SCIENCES DE LA NATURE ET DE LA VIE ET DES SCIENCES DE LA TERRE
DEPARTEMENT DE BIOLOGIE
Réf : ……./UAMOB/F.SNV.ST/DEP.BIO/2018
MEMOIRE DE FIN D’ETUDES
EN VUE DE L’OBTENTION DU DIPLOME MASTER
Domaine : SNV Filière : Sciences Biologiques Spécialité : Biochimie appliquée
Présenté par :
CHELOUCHE Razika & DERAR SBAIHI Rima
Thème
Soutenu le : 19 /09/ 2018 Devant le jury composé de :
Nom et Prénom Grade
M. REMINI Hocine MCB Univ. de Bouira Président
M. DAHMOUNE Farid MCA Univ. de Bouira Promoteur
Meme. BERKANI Farida Doctorante Univ. de Bouira Co-Promotrice
M. ADRAR Nabil MAA Univ. de Bouira Examinateur
Année Universitaire : 2017/2018
Optimisation d’extraction par solvent des poly phénols
assistée aux ultrasons et activité antioxydante de fruits de
Summary
Summary
ACKNOWLEDGMENTS
DEDICATION
List of tables
List of figures
List of abbreviations
Introduction
………..……….1Chapter I: Literature Review
I.1.Overview of Jujube plant………...2I.2. Description and botanical classification………..…….……….…..….2
I.3. Biochemical composition of jujube……….……….3
I.4.Phenolic composition……….3
I.5.Pharmacological activities………...………..4
II. Extraction methods of phenolic compounds………..5
II.1. Conventional extraction techniques (CE)……….………..5
II.1.1. Maceration extraction (ME)……….………5
II.1.2. Extraction by mechanical agitation………..………5
II.2. Novel extraction techniques………....5
II.2.1. Ultrasound assisted extraction (UAE)………..5
II.3. Microwave assisted extraction (MAE)……….………..….6
II.4. Advantages and disadvantages of different extraction techniques………..8
Chapter II: Experimental Work
II.1. Chemical reagents and equipment ………..………..………...9II.2. Plant material ……….…..10
II.2.1. Drying and Grinding ………...………..10
II.3. Experiment Design and extraction of phenol compounds……….11
Summary
II.3.2. Fractional Factorial Design (FFD)……….13
II.4. Ultrasound assisted extraction………...16
II.5. Microwave assisted and Conventional extraction………..16
II.6. Analytical determinations………..17
II.6.1.Total phenolic content……….17
II.6.2. Total flavonoids content……….17
II.6.3. phenols index………..17
II.7. Antioxidant activity………...18
II.7.1. Scavenging activity against the DPPH* radical……….18
Chapter III: Results and discussion
I.1. Evaluation of moisture content…….. ……….…………..…..19III.2. Screening study: Plackett and Burman Design (PBD)……….…19
III.2.1. Single factor analysis method for UAE………21
III.3.Optimization of UAE progress in FFD assay………..……….……….…..24
III.3.1. Analysis of variance (ANOVA) optimization process….………...25
III.3.2. Optimal extraction conditions………..……….27
III.3.3. Validation of the models………...28
III.3.4.Analysis of response surface…...…….………..28
III.3.4.1. Effect of interaction of ethanol concentration and liquid to- solid ratio on of TPC and TFC yields………..….29
III.3.4.2. Effect of interaction of ethanol concentration and liquid to- solid ratio on antioxidant activity……….29
III.3.5.Comparison between UAE and MAE and conventional extraction methods (CE)...30
Conclusion……….… 32
Bibiographical references
ACKNOWLEDGMENTS
To the term of this modest work,
we want to express our most earnest
gratitude to our lord, Allah, for giving us courage, health and all the
patience which have been helpful throughout our journey.
Foremost, we would like to express our sincere gratitude to our
advisor Dr.
FARID DAHMOUNEfor their help, invaluable guidance
and elating encouragement throughout the course of this present
work.
We would also like to thank co-advisor M
eme BERKANI .Ffor her
invaluable help, his comments and advice us to coordinate our
project.
We would to thank all members of
biochemistry and biology
department.
We would also to thank
the heads of the biochemistry laboratory of
the University of Bouira in particular: SAMIA and KARIMA
All our teachers who formed us, of the primary school until the
university.
DEDICATION
For those who gave me everything without anything in return,
there are no words to describe how much my parent has meant to me
throughout all my life.
To my parent, my mother and father, who supported me with
love and understanding. Without you, I could never have
reached this current level of
study. Thank you for giving me
life and the joy of living.
To my best brothers,
ABEDENOUR, LYES, SAMIR, ABDEL
MALEK, FARID.
For the most adorable children, my nieces,
RAOUANE, RAOUF, HIBAT ELRAHMENE.
To all my family.
To my Partner RIMA and his family.
To all my friends, NADIA, AMIRA, SONIA,
NAIMA, SELMA.
To all Biochemistry promotion: 2017/2018
DEDICATION
First of all, I dedicate: this persents
My parents: my mother and father, the light of my life; thank
you for all that you have done for me concerning my education
which leads today to the realization of this study. Thank you
for his giving me life and the joy of living.
To my husband: SBAIHI AYOB thank you for his sacrifice, for
their advice, thank you for any encouragement to finish my
studies and my deep feelings.
To my brothers: AMIN and YOUSSEF
To my sisters-in-law: AMINA HADIL and NESSRINE
To all my family
To my partner: RAZIKA and his family.
To all Biochemistry promotion 2017/2018
List of figures
Figures N°
Titles
Pages
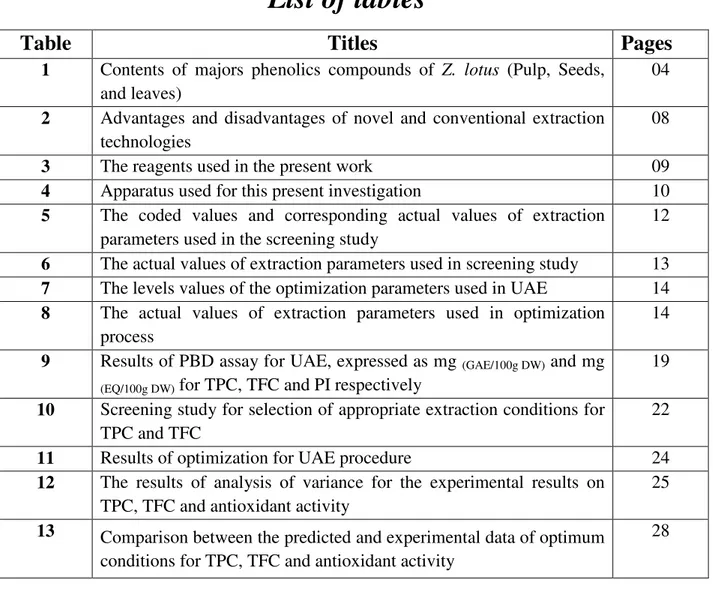
1 Distribution area of Rhamnaceae family in the world 02
2 Photography of Z. lotus 03
3 The principle of acoustic cavitation 05
4 The mechanism of cell wall disruption (a) breaking of cell wall due to cavitation ,(b) diffusion of solvent into the cell structure
06
5 Conventional and microwave heating mechanisms 07
6 Photography of Z. lotus fruit 11
7 UAE equipment used during extraction of phenolic compounds 16
8 Equipment used in MAE and CE 16
9 Scatter plot for TPC, TFC and PI from Z. lotus fruits 20 10 Comparison between experimental and predicted values of UAE
content for TPC, TFC yields and PI
21
11 Comparison between experimental and predicted values of UAE content for TPC, TFC yields and DPPH scavenging
26
12 Profiles for predicted values and desirability function 27 13 Surface plot of the TPC and TFC yields as a function of solvent
and liquid to- solid ratio
29
14 Response surface plot showing interaction between ethanol and liquid to- solid ratio for antioxidant activity
29
15 Comparison of bioactive components (TPC, TFC) yields and antioxidant activity between UAE and MAE and CE from jujube
List of tables
Table
Titles
Pages
1 Contents of majors phenolics compounds of Z. lotus (Pulp, Seeds, and leaves)
04
2 Advantages and disadvantages of novel and conventional extraction technologies
08
3 The reagents used in the present work 09
4 Apparatus used for this present investigation 10
5 The coded values and corresponding actual values of extraction parameters used in the screening study
12
6 The actual values of extraction parameters used in screening study 13 7 The levels values of the optimization parameters used in UAE 14 8 The actual values of extraction parameters used in optimization
process
14
9 Results of PBD assay for UAE, expressed as mg (GAE/100g DW) and mg (EQ/100g DW) for TPC, TFC and PI respectively
19
10 Screening study for selection of appropriate extraction conditions for TPC and TFC
22
11 Results of optimization for UAE procedure 24
12 The results of analysis of variance for the experimental results on TPC, TFC and antioxidant activity
25
13 Comparison between the predicted and experimental data of optimum conditions for TPC, TFC and antioxidant activity
List of
List of abbreviations
ANOVA: Analysis Of Variance Aw: Water activity
CE: Conventional Extraction
DPPH: 2,2-Diphenyl-picrylhydrazyl DW: Dry weight
FFD: Fractional Factorial Design PI:Phenols Index
GAE: Gallic Acid Equivalent
MAE: Microwave Assisted Extraction MC: Moisture Content
PBD: Plackett - Burman Design RMSE: Root Mean Square Error RSA: Radical Scavenging Activity RSM: Response Surface Methodology TPC: Total Phenolic Compounds TFC: Total Flavonoid Compounds UAE: Ultrasound Assisted Extraction
INTRODUCTION
1
Introduction
Algeria is considered among the countries known for their taxonomic diversity given its privileged biogeographical position and its extent between the Mediterranean and sub-Saharan Africa (Cheurfa et al., 2017). The Algerian flora counts nearly 3,000 species belonging to several botanical families (Arab et al., 2014). In recent years the medicinals plants have attracted increasing attention because of their various potential health benefits and pharmacological activities (Chen et al., 2018).
Zizyphus lotus L, wild jujube, is one of the medicinals plants famous in the world, and its production has steadily increased in China in the last ten years. It is very common in North of Algeria. Although, its fruits are very appreciated by the Algerian population for the treatment of several pathologies like gastrointestinal disturbance, liver troubles, urinary infections, skin infections, insomnia, diarrhea, and diabetes (Abdeddaim et al., 2014). Jujube is characterized by its particular flavors and abundant nutrients, such as proteins, dietary fibres, minerals, and vitamins (Yu et al., 2012).
Extraction process is considering the first basic and important stage for separating bioactive compounds from raw materials (Liu et al., 2017). However, several methods are available for extraction of phenolics compounds from Z. lotus, including solvent extraction; maceration, mechanical agitation, ultrasound-assisted extraction, microwave-assisted extraction (Chouaibi et al., 2012, Mkadmini Hammi et al., 2016, Ourzeddine et al., 2017). Among of these methods, ultrasound-assisted extraction (UAE) technology has gained increasing popularity due to its advantageous properties, including high extraction efficiency, good reproducibility, low solvent consumption, speed, low cost,. environmental friendliness and easy scale up for industrial applications (Li et al., 2016). Furthermore, Due to the many factors that influence UAE, optimization of the extraction process parameters is an important step prior to eventual purification and application of the extracts (Carciochi et al., 2015).
Therefore, the main goals of this study were to optimize the ultrasonic-assisted extraction of phenolics compounds from Z. lotus fruits using Plackett and Burman Design (PBD) in order to select the suitable parameters extraction which may maximize the yield of total phenolics and flavonoids to be considered during the optimization process. In other hand, Fractional Factorial Design (FFD) and response surface methodology (RSM) are using to optimize the UAE to obtain maximum yield of TPC, TFC and determined antioxidant activity of UAE extracts.
INTRODUCTION
2
ABDEDDAIM, M., LOMBARKIA, O., BACHA, A., FAHLOUL, D., ABDEDDAIM, D., FARHAT, R., SAADOUDI, M., NOUI, Y. & LEKBIR, A. 2014. Biochemical characterization and nutritional properties of zizyphus lotus l. fruits in aures region, northeastern of Algeria. Annals. Food Science and
Technology, 15, 75-81.
ARAB, K., BOUCHENAK, O. & YAHIAOUI, K. 2014. Phytochemical study and evaluation of the antimicrobial and phenolique compounds of pisticia lentiscus L. Journal of
Fundamental and applied Science, 6, 79-93.
CARCIOCHI, R. A., MANRIQUE, G. D. & DIMITROV, K. 2015. Optimization of antioxidant phenolic compounds extraction from quinoa (Chenopodium quinoa) seeds. J Food Sci Technol, 52, 4396-404.
CHEN, S., ZENG, Z., HU, N., BAI, B., WANG, H. & SUO, Y. 2018. Simultaneous optimization of the ultrasound-assisted extraction for phenolic compounds content and antioxidant activity of Lycium ruthenicum Murr. fruit using response surface methodology. Food Chem, 242, 1-8. CHEURFA , M., ALLEM , R., ZABEL, K., AICHOUNI, W. & MEDJKANE, M. 2017. The Effects of Glycyrrhiza
glabra L. and Zizyphus lotus L. Root Extracts on Some Human Pathogenic Bacteria.
Phytothérapie.
CHOUAIBI, M., REZIG, L., MAHFOUDHI, N., ARAFA, S., DONSÌ, F., FERRARI, G. & HAMDI, S. 2012. Physicochemical Characteristics and Antioxidant Activities ofZizyphus lotusL. Seed Oil. Journal
of Food Biochemistry, n/a-n/a.
LI, H.-Z., ZHANG, Z.-J., XUE, J., CUI, L.-X., HOU, T.-Y., LI, X.-J. & CHEN, T. 2016. Optimization of
ultrasound-assisted extraction of phenolic compounds, antioxidants and rosmarinic acid from perilla leaves using response surface methodology. Food Science and Technology, 36, 686-693.
LIU, Y., SHE, X.-R., HUANG, J.-B., LIU, M.-C. & ZHAN, M.-E. 2017. Ultrasonic-extraction of phenolic compounds from Phyllanthus urinaria: optimization model and antioxidant activity. Food
Science and Technology.
MKADMINI HAMMI, K., HAMMAMI, M., RIHOUEY, C., LE CERF, D., KSOURI, R. & MAJDOUB, H. 2016. Optimization extraction of polysaccharide from Tunisian Zizyphus lotus fruit by response surface methodology: Composition and antioxidant activity. Food Chem, 212, 476-84. OURZEDDINE, W., FADEL, H., MECHEHOUD, Y., CHALCHAT, J.-C., FIGUEREDO, G., CHALARD, P.,
BENAYACHE, F. & BENAYACHE, S. 2017. Chemical Composition and Antioxidant Activity of the Fruit Essential Oil of Zizyphus lotus (L.) Desf. (Rhamnaceae). International Journal of
Pharmacognosy and Phytochemical Research, 9.
YU, Y., ZHANG, S., REN, Y., LI, H., ZHANG, X. & DI, J. 2012. jujube preservation using chitosan film with nano-silicon dioxide. Journal of Food Engineering, 113, 408–414.
ChapterI
Literature
CHAPTER I Literature Review
I.1.Overview of Jujube plant
Ziziphus lotus known as jujube,
Rhamnaceae family (Gorai et al., 2010 Zizyphus. It’s commonly known
called ”nbeg” and it’s dormant from October through March and mature plant flowers in May and June and produces fruits in August
Z. lotus, is widespread in tropical and sub
America, South America, Oceania and Europe with the center of
al., 2014) (Fig.1). Different parts of the plant have found various uses in the food industry, such as, in the cosmetics in several forms;
pharmaceutical industries .It is used in Algerian traditional medicine for treatment of several pathologies such as digestive disorders, obesity, urinary troubles and
(Benammar et al., 2014, Chouaibi et al., 2012
Figure 1: Distribution area of Rhamnaceae family in the world
I.2. Description and botanical classification
Z. lotus (jujube tree) is a deciduous, fruitful thorny shrub with intricately branched stems and smaller flowers and fruits. It forms tufts of a few meters in diameter, up to 2 to 3 meters in high with many ramifications and is found in depressions with deep sandy (Maraghni et al., 2010).The leaves
with entire margins. They are alternately oval in shape and small in size (15 x 10 mm, 1.5 to 2 times longer than wide), accompanied at its base by two stipules transformed into uneven and vulnerable spines (Amara and Benabdeli, 2017
diameter. At maturity, it has a brown skin, a very sweetened and farinaceous ochre flesh, wrapping a small seed with a diameter of 4 to 5 mm
CHAPTER I Literature Review
I.1.Overview of Jujube plant
known as jujube, is a xerophytic shrub, belongs Gorai et al., 2010).This family includes about 135
It’s commonly known by the Algerian population as ”sedra” and the edible fruit and it’s dormant from October through March and mature plant flowers in May and June and produces fruits in August (Maraghni et al., 2010).
is widespread in tropical and sub-tropical regions: Asia, Africa, North America, South America, Oceania and Europe with the center of diversity in Asia
Different parts of the plant have found various uses in the food industry, the cosmetics in several forms; honey, tea, jam, juice, oil, loaf, and cake and It is used in Algerian traditional medicine for treatment of several pathologies such as digestive disorders, obesity, urinary troubles and
Chouaibi et al., 2012).
Distribution area of Rhamnaceae family in the world (Dupont et al., 2012
I.2. Description and botanical classification
(jujube tree) is a deciduous, fruitful thorny shrub with intricately branched stems and smaller flowers and fruits. It forms tufts of a few meters in diameter, up to 2 to 3 meters in high with many ramifications and is found in depressions with deep sandy
The leaves are deciduous, glabrous, coriaceous, shortly petiolate and with entire margins. They are alternately oval in shape and small in size (15 x 10 mm, 1.5 to 2 times longer than wide), accompanied at its base by two stipules transformed into uneven and Amara and Benabdeli, 2017). Its fruits are round from 1 to 2cm in meter. At maturity, it has a brown skin, a very sweetened and farinaceous ochre flesh, wrapping a small seed with a diameter of 4 to 5 mm (Saadoudi et al., 2012
CHAPTER I Literature Review
2
to the angiosperm about 135–170 species of ”sedra” and the edible fruit and it’s dormant from October through March and mature plant flowers in May
Asia, Africa, North diversity in Asia (Ghalem et Different parts of the plant have found various uses in the food industry, honey, tea, jam, juice, oil, loaf, and cake and It is used in Algerian traditional medicine for treatment of several pathologies such as digestive disorders, obesity, urinary troubles and skin infections
Dupont et al., 2012).
(jujube tree) is a deciduous, fruitful thorny shrub with intricately branched stems and smaller flowers and fruits. It forms tufts of a few meters in diameter, up to 2 to 3 meters in high with many ramifications and is found in depressions with deep sandy soil
are deciduous, glabrous, coriaceous, shortly petiolate and with entire margins. They are alternately oval in shape and small in size (15 x 10 mm, 1.5 to 2 times longer than wide), accompanied at its base by two stipules transformed into uneven and are round from 1 to 2cm in meter. At maturity, it has a brown skin, a very sweetened and farinaceous ochre flesh,
Saadoudi et al., 2012), (Fig.2).
Species of Rhamnaceae
CHAPTER I Literature Review
Kingdom: Plantae
Division (Phylum): Tracheophyta Class: Dichotyledoneae
Order: Rhamnoles Family: Rhamnaceae Genus: Ziziphus Species: Ziziphus lotus
Figure 2: Photography of
I.3.Biochemicalcomposition of jujube
Z. lotus has been the subject of considerable studies because it is a source of several
bioactive compounds which hold therapeutic potentialities for human promoting, and disease preventing such as, polypheno
alkaloids, saponins, and other b
Its medicinal properties depend on the part of the plant example, the fruits contain sugar (20 to 32%).
high levels of vitamins: A.C and E. phosphorus. pollysaccharids
2017) .
The fatty acid composition of
compounds with the predominance of linoleic acid (18:2n
the leaves were the richest source of vitamin E and linolenic acid n−3 fatty acids (Benammar et al., 2010
I.4.Phenolic composition
Polyphenols or phenolic compounds are secondary metabolites, ubiquitous widely exist in nature and food-industry by
their structure and molecular
properties. Due to this enormous variety, there are reports of more than 10000 phenolic molecules and the list continues expanding
characterised by the presence of multiple hydroxyl groups on aromatic rings and are
into two main categories, the flavonoids and non flavonoids, based on the number of phenolrings and the way in which these rings interact.
acids and flavonoids (Vauzour, 2017
CHAPTER I Literature Review
Tracheophyta
Photography of Z. lotus (Adelia and Samavatib, 2015
composition of jujube
has been the subject of considerable studies because it is a source of several bioactive compounds which hold therapeutic potentialities for human
promoting, and disease preventing such as, polyphenols, fatty acids, vitamins, and f
alkaloids, saponins, and other bimolecular (Rsaissi et al., 2013, Abdoul-Azize et al., 2013 Its medicinal properties depend on the part of the plant concerned and the extract used. For
ruits contain sugar (20 to 32%). protein (0, 8 to 2,1%). lipid (0,1 C and E. In addition it is rich in minerals; Ca
and amino acids (Abdoul-Azize, 2016, Ourzeddine et al.,
composition of Z. lotus fruits revealed that their oil contained 13 predominance of linoleic acid (18:2n-6) a precursor of n
the leaves were the richest source of vitamin E and linolenic acid (18:3n Benammar et al., 2010, Ghazghazia et al., 2014).
I.4.Phenolic composition
or phenolic compounds are secondary metabolites, ubiquitous widely industry by-products. They are differentiated from one another by molecular weight, and the resulting physicochemi
enormous variety, there are reports of more than 10000 phenolic continues expanding(Vazquez et al., 2015). These compounds are characterised by the presence of multiple hydroxyl groups on aromatic rings and are
nto two main categories, the flavonoids and non flavonoids, based on the number of phenolrings and the way in which these rings interact. The main classes
Vauzour, 2017).
CHAPTER I Literature Review
3
Adelia and Samavatib, 2015).
has been the subject of considerable studies because it is a source of several bioactive compounds which hold therapeutic potentialities for human nutrition, health ls, fatty acids, vitamins, and flavonoids, Azize et al., 2013). concerned and the extract used. For lipid (0,1 to 0,3%) and ; Ca. Mg. Na. K and Ourzeddine et al.,
fruits revealed that their oil contained 13 a precursor of n-6 fatty acids and (18:3n−3), a precursor of
or phenolic compounds are secondary metabolites, ubiquitous widely products. They are differentiated from one another by weight, and the resulting physicochemical and biological enormous variety, there are reports of more than 10000 phenolic These compounds are characterised by the presence of multiple hydroxyl groups on aromatic rings and are divided nto two main categories, the flavonoids and non flavonoids, based on the number of main classes include phenolic
CHAPTER I Literature Review
4
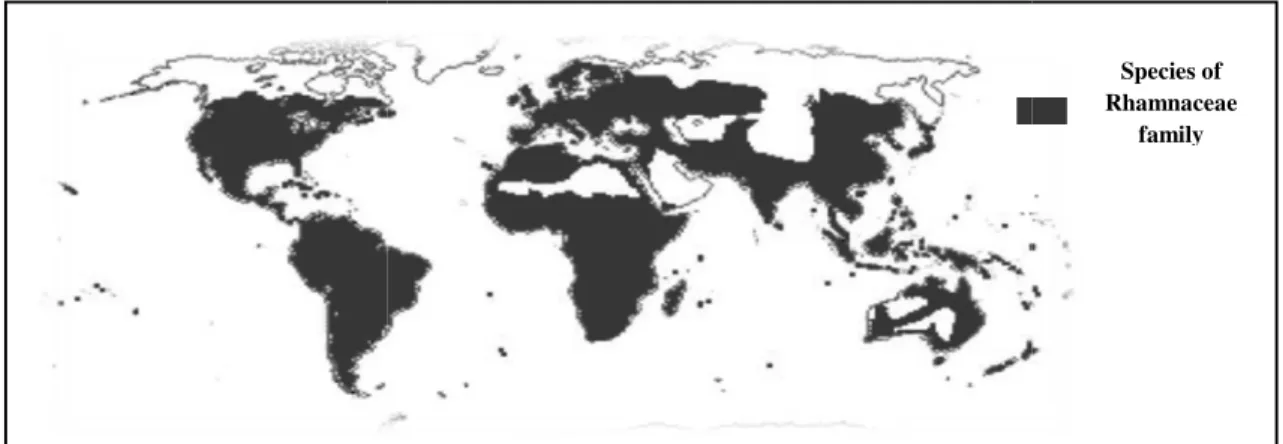
- These phenolic compounds are present in different jujube tissues at various concentrations, as detailed in Table 1
Table 1: Contents of majors phenolics compounds of Z. lotus (Pulp, Seeds, and leaves). Plant tissue Main component
identified
Content in mg/ 100g FM
References
Pulp - Total phenols
- Flavonoids - Tannins - Vitamin C 325 173 922 190,65 (Abdeddaim et al., 2014, Abdoul-Azize et al., 2013, Benammar et al., 2010).
Seeds -Total phenolic acid -Total phenol -Vitamin C 25.24 14.68 170,84 (Abdoul-Azize et al., 2013, Benammar et al., 2010, Chouaibi et al., 2012).
Leaves - Total phenols - Flavonoids - Vitamin C - Tannins 23 – 340 52.101 63,40 39 (Bouaziz et al., 2009, Benammar et al., 2010, Lupea et al., 2008, Ghazghazia et al., 2014).
I.5.Pharmacological activities
Many authors annunciated that the different parts(roots, leaves ,fruits, seeds) of Z.
lotus have a great potential like, plants medicinal, with antimicrobial activities (Bouaziz et
al., 2009, Cheurfa et al., 2017, Ghazghazia et al., 2014, Naili et al., 2010, Rsaissi et al., 2013, Saiaha et al., 2016) litholytic Activities (Khouchlaa et al., 2017) gastro-protective properties (Bakhtaoui et al., 2014) activation of immune system (Abdoul-Azize et al., 2013, Benammar et al., 2010) antidiabetic and antioxidant activities (Benammar et al., 2014, Borgi et al., 2007, Chouaibi et al., 2012, Ghalem et al., 2014, Ghazghazia et al., 2014, Mkadmini hammi et al., 2015, Ourzeddine et al., 2017).
CHAPTER I Literature Review
5
II. Extraction methods of phenolic compounds
Extraction of phenolic compounds from plants is a crucial step for the valorization of these bioactive compounds. They depend on the method and the appropriate solvent that preserves their biological properties (Mahmoudi et al., 2013). Among of these methods:
II.1. Conventional extraction techniques (CE)
II.1.1. Maceration extraction (ME)
Maceration extraction (ME) is a conventional method frequently used in the extraction of phenolic compounds. The procedure consists in putting the sample in a solvent for a certain period of time and at a specific temperature. It is a simple technique, but very often requires long time periods (about 4 to 10 days) (Albuquerque et al., 2017).
II.1.2. Extraction by mechanical agitation
Extraction by mechanical agitation is a simple and low-cost method uses agitation or mixing action to extract the phenolic compounds. It consists of directly contacting a solid matrix in a suitable solvent (water, ethanol, methanol, acetone) under mechanical agitation at a given temperature for a period of time ranging from a few minutes to a week (Lau et al., 2010).
II.2. Novel extraction techniques
Modern extraction techniques are a major factor inflencing the qualité of extract and extraction yield. Among these methods :
II.2.1. Ultrasound assisted extraction (UAE)
Ultrasounds can be considered as the air vibrations of a frequency from 20 kHz to 100 MHz, and also caused by the mechanical waves propagated in solids, liquids and gases other than air. It is defined as sound waves chaving frequency that exceeds the hearing limit of the human ear (20 kHz) (Azmir et al., 2013).UAE is based on the principle of acoustic cavitation where, the propagation of the ultrasonic waves will generate a series of compressions and rarefactions in the molecules of the present solvent causing the formation of bubbles as a result of changes in temperature and pressure (Fig.3) (Vilkhu et al., 2008).
CHAPTER I Literature Review
6
Figure 3: The principle of acoustic cavitation (Medina-Torres et al., 2017).
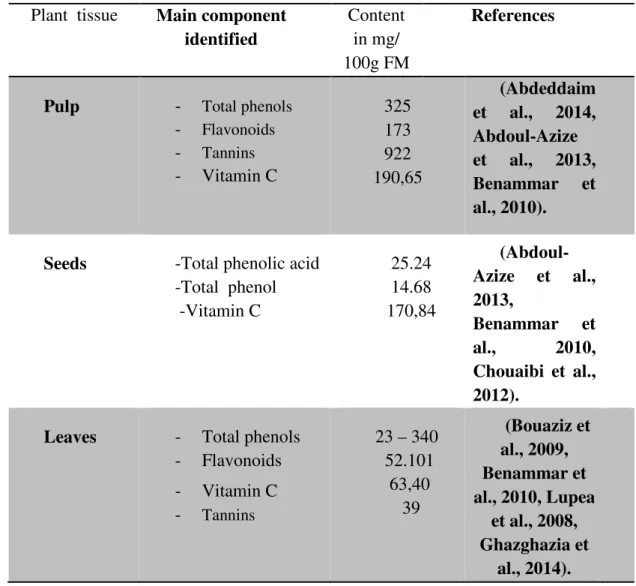
In general, several mechanisms involved in UAE have been identified. One of the positions of our mechanism is the fragmentation attributed to the collisions between particles and ultrasonic waves, which cause a reduction in the particle size, thereby facilitating mass transfer. Another is erosion which helps to improve the accessibility of the solvent by imploding the bubbles on the surface of the plant matrix. Sono-capillarity and Sonoporation, are able to improve the penetration of liquid through the channels produced by the bubble implosion and the alteration of the permeability of the cell membranes, respectively. Finally, the sheer stress mechanism produces the collapse of the cavitation bubble into the fluid, due to the oscillation phenomenon (Fig.4) (Chemat et al., 2017).
(a) (b)
Figure 4: The mechanism of cell wall disruption (a) breaking of cell wall due to cavitation, (b) diffusion of solvent into the cell structure (Medina-Torres et al., 2017).
II.
3. Microwave Assisted Extraction (MAE)Microwaves are non-ionizing electromagnetic waves lie between infrared radiation and radio waves with a frequency range of 300 MHz–300 GHz, belonging to high frequency
CHAPTER I Literature Review
electromagnetic wave. In order to avoid interferences with official communications domestic and industrial or scientific microwave devices
2013).
Microwave-assisted extraction (
utilizes microwave energy to heat the solvent and the sample rate of the solutes from the sample matrix into the solvent
The extraction of bioactive compounds from
subject of considerable works published in scientific journals. solvent-assisted microwave extraction "MAE"
microwave hydrodistillation under vacuum or vacuum microwaves. hydrodistillation "VMHD" and air training (Bouaoudia
al., 2015, Felkai-Haddache et al., 2016
is based on direct impact between polar materials and solvents. It phenomenon’s: ionic conduction and dipole rotation
Compared to conventional heating method, conversion of the energy of
However, in conventional heating, convection heating (Gude et al., 2013
Figure 5: Conventional
CHAPTER I Literature Review
electromagnetic wave. In order to avoid interferences with official communications domestic and industrial or scientific microwave devices generally operate at 2.45 GHz
assisted extraction (MAE) is a relatively new extraction technique, which utilizes microwave energy to heat the solvent and the sample and to increase the mass transfer rate of the solutes from the sample matrix into the solvent (Shukla et al., 2013
bioactive compounds from plants using microwave
works published in scientific journals. Currently, the most widely are assisted microwave extraction "MAE", Microwave Assisted Processing
microwave hydrodistillation under vacuum or vacuum microwaves. hydrodistillation Bouaoudia-Madi et al., 2017, Chan et al., 2011
Haddache et al., 2016).Furthermore, the principle of heating
between polar materials and solvents. It is governed by two phenomenon’s: ionic conduction and dipole rotation (Mandal et al., 2007)
conventional heating method, the microwave heating results of the conversion of the energy of into materials by dipolar polarization, ionic conduction
conventional heating, heat transferred to the sample volume Gude et al., 2013).(Fig.5)
Conventional and microwave heating mechanisms (Gude et al., 2013
CHAPTER I Literature Review
7
electromagnetic wave. In order to avoid interferences with official communications domestic generally operate at 2.45 GHz (Heng et al.,
) is a relatively new extraction technique, which and to increase the mass transfer Shukla et al., 2013).
using microwaves has been the Currently, the most widely are Microwave Assisted Processing "MAP" and microwave hydrodistillation under vacuum or vacuum microwaves. hydrodistillation Chan et al., 2011, Dahmoune et principle of heating by microwave is governed by two
).
the microwave heating results of the polarization, ionic conduction. heat transferred to the sample volume by conduction or
CHAPTER I Literature Review
8
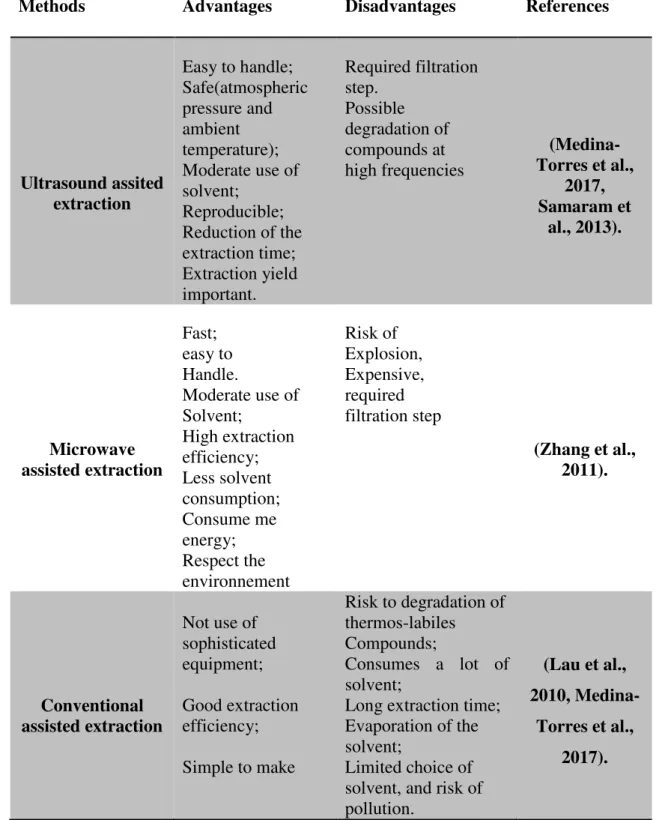
II.4. Advantages and disadvantages of different extraction techniques
All extraction techniques have advantages and disadvantages (Table 2).
Table 2: Advantages and disadvantages of novel and conventional extraction technologies.
Methods Advantages Disadvantages References
Ultrasound assited extraction Easy to handle; Safe(atmospheric pressure and ambient temperature); Moderate use of solvent; Reproducible; Reduction of the extraction time; Extraction yield important. Required filtration step. Possible degradation of compounds at high frequencies (Medina-Torres et al., 2017, Samaram et al., 2013). Microwave assisted extraction Fast; easy to Handle. Moderate use of Solvent; High extraction efficiency; Less solvent consumption; Consume me energy; Respect the environnement Risk of Explosion, Expensive, required filtration step (Zhang et al., 2011). Conventional assisted extraction Not use of sophisticated equipment; Good extraction efficiency; Simple to make Risk to degradation of thermos-labiles Compounds; Consumes a lot of solvent;
Long extraction time; Evaporation of the solvent;
Limited choice of solvent, and risk of pollution.
(Lau et al., 2010,
Medina-Torres et al., 2017).
CHAPTER I Literature Review
9
ABDEDDAIM, M., LOMBARKIA, O., BACHA, A., FAHLOUL, D., ABDEDDAIM, D., FARHAT, R., SAADOUDI, M., NOUI, Y. & LEKBIR, A. 2014. Biochemical characterization and nutritional properties of
zizyphus lotus l. fruits in aures region, northeastern of Algeria. Annals. Food Science and
Technology, 15, 75-81.
ABDOUL-AZIZE, S. 2016. Potential Benefits of Jujube (Zizyphus Lotus L.) Bioactive Compounds for Nutrition and Health. Journal of Nutrition and Metabolism, 13 pages.
ABDOUL-AZIZE, S., BENDAHMANE, M. & HICHAMI , A. 2013. Effects of Zizyphus lotus L. (Desf.) polyphenols on Jurkat cell signaling and proliferation. International Immunopharmacology,
15, 364–371.
ADELIA, M. & SAMAVATIB, V. 2015. Studies on the steady shear flow behavior and chemical properties of water-soluble polysaccharide from Ziziphus lotus fruit. International Journal of
Biological Macromolecules, 72, 580–587.
ALBUQUERQUE, B. R., PRIETO, M. A., BARREIRO, M. F., RODRIGUES, A., CURRAN, T. P., BARROS, L. & FERREIRA, I. C. F. R. 2017. Catechin-based extract optimization obtained from Arbutus unedo L. fruits using maceration/microwave/ultrasound extraction techniques. Industrial Crops and
Products, 95, 404-415.
AMARA, M. & BENABDELI, K. 2017. A Geobotanical and Phenological Study of Zizyphus lotus in the Naama Region (South-Western of Algeria). Journal of Applied Environmental and Biological
Sciences, 7, 1-8.
AZMIR, J., ZAIDUL, I. S. M., RAHMAN, M. M., SHARIF, K. M., MOHAMED, A., SAHENA, F., JAHURUL, M. H. A., GHAFOOR, K., NORULAINI, N. A. N. & OMAR, A. K. M. 2013. Techniques for extraction
of bioactive compounds from plant materials: A review. Journal of Food Engineering, 117, 426-436.
BAKHTAOUI, F.-Z., LAKMICHI, H., MEGRAUD, F., CHAIT, A. & GADHI, C.-E. A. 2014. Gastro-protective, anti-Helicobacter pylori and, antioxidant properties of Moroccan Zizyphus lotus L. Journal of
Applied Pharmaceutical Science, 4, 81-87.
BENAMMAR, C., BAGHDAD, C., BELARBI, M., SUBRAMANIAM, S., HICHAMI, A. & KHAN, N. A. 2014. Antidiabetic and antioxidant activities of Zizyphus lotus L aqueous extracts in Wistar rats.
Journal of Nutrition & Food Sciences.
BENAMMAR, C., HICHAMI, A. & YESSOUFOU, A. 2010. Zizyphus lotus L. (Desf.) modulates antioxidant activity and human T-cell proliferation. BMC Complementary and Alternative Medicine, 10,
article 54.
BORGI , W., GHEDIRA , K., CHOUCHANE, N., & 2007. Antiinflammatory and analgesic activities of Zizyphus lotus. Fitotherapia, 78, 16-19.
BOUAOUDIA-MADI, N., BOULEKBACHE-MAKHLOUF, L., KADRI, N., DAHMOUNE, F., REMINI, H., DAIRI, S., OUKHMANOU-BENSIDHOUM, S. & MADANI, K. 2017. Phytochemical analysis of Myrtus
communis plant: Conventional versus microwave assisted-extraction procedures. J
Complement Integr Med, 14.
BOUAZIZ, M., ADHOUIB, B., LOUKIL, S., BOUKHRIS, M. & SAYADI, S. 2009. Polyphenols content, antioxidant and antimicrobial activities of extracts of some wild plants collected from the
south of Tunisia. African Journal of Biotechnology, 8, 7017-7027.
CHAN, C. H., YUSOFF, R., NGOH, G. C. & KUNG, F. W. 2011. Microwave-assisted extractions of active ingredients from plants. J Chromatogr A, 1218, 6213-25.
CHEMAT, F., ROMBAUT, N., SICAIRE, A.-G., MEULLEMIESTRE, A., FABIANO-TIXIER, A.-S. & ABERT-VIAN, M. 2017. Ultrasound assisted extraction of food and natural products. Mechanisms, techniques, combinations, protocols and applications. A review. Ultrasonics Sonochemistry,
34, 540-560.
CHEURFA , M., ALLEM , R., ZABEL, K., AICHOUNI, W. & MEDJKANE, M. 2017. The Effects of Glycyrrhiza glabra L. and Zizyphus lotus L. Root Extracts on Some Human Pathogenic Bacteria.
CHAPTER I Literature Review
10
CHOUAIBI, M., REZIG, L., MAHFOUDHI , N., ARAFA, S., DONSI, F., FERRARI, G. & HAMDI, S. 2012. Physicochemical characteristics and antioxidant Activities of zizyphus lotus l. Seed oil. Journal
of Food Biochemistry, 37.
DAHMOUNE, F., NAYAK, B., MOUSSI, K., REMINI, H. & MADANI, K. 2015. Optimization of microwave-assisted extraction of polyphenols from Myrtus communis L. leaves. Food Chem, 166, 585-95. DUPONT , F., GUIJNARD , J. L. & AL, E. 2012. Botanique, les familles de plantes. Elsevier, 136. FELKAI-HADDACHE, L., DAHMOUNE, F., REMINI, H., LEFSIH, K., MOUNI, L. & MADANI, K. 2016.
Microwave optimization of mucilage extraction from Opuntia ficus indica Cladodes. Int J Biol
Macromol, 84, 24-30.
GHALEM, M., MERGHACHE, S. & BELARBI, M. 2014. Study on the antioxidant activities of root extracts of Zizyphus lotus from the western region of Algeria. Phcog J, 6, 32-42. GHAZGHAZIA, H., AOUADHIB, C., RIAHIC, L., MAAROUFIB , A. & HASNAOUIA, B. 2014. Fatty acids
composition of Tunisian Ziziphus lotus L. (Desf.) fruits and variation in biological activities between leaf and fruit extracts. Natural Product Research, 28, 1106–1110.
GORAI, M., MARAGHNI, M. & NEFFATI, M. 2010. Relationship between phenological traits and water potential patterns of the wild jujube Ziziphus lotus (L.) Lam. in southern Tunisia. Plant
Ecology & Diversity, 3, 273–280.
GUDE , V., PATIL , P., MARTINEZ-GUERRA , E., DENG , S., NIRMALAKHANDAN , N. & GUDE VG, P. P., MARTINEZ-GUERRA E, DENG S, NIRMALAKHANDAN N (2013) MICROWAVE ENERGY POTENTIAL FOR BIODIESEL PRODUCTION SUSTAINABLE CHEMICAL PROCESSES 1:1-31 2013.
Microwave energy potential for biodiesel production. sustain chem process, 1-31. HENG, M. Y., TAN, S. N., YONG, J. W. H. & ONG, E. S. 2013. Emerging green technologies for the
chemical standardization of botanicals and herbal preparations. TrAC Trends in Analytical
Chemistry, 50, 1-10.
KHOUCHLAA , A., TALBAOU, A., EL YAHYAOUI EL IDRISSI, A., BOUYAHYA, A., AIT LAHSEN, S., KAHOUADJI, A. & TIJANE, M. 2017. Determination of Phenol Content and Evaluation of in vitro Litholytic Effects on Urolithiasis of Moroccan Zizyphus lotus L. Extract. Phytothérapie,
1-6.
LAU, E. V., GAN, S. & NG, H. K. 2010. Extraction techniques for polycyclic aromatic hydrocarbons in soils. Int J Anal Chem, 2010, 398381.
LUPEA , A. X., POP, M. & CACIG, S. 2008. Structure-Radical Scavenging Activity Relationships of Flavonoids from Ziziphus and Hydrangea Extracts. REV. CHIM. (Bucureºti), 59, 310-312 MAHMOUDI, S., KHALI, M. & MAHMOUDI, N. 2013. Etude de l'extraction des composés phénoliques
de différentes parties de la fleur d'artichaut (Cynara scolymus L.). Nature & Technology, 35. MANDAL, V., MOHAN, Y. & HEMALATHA, S. 2007. Microwave Assisted Extraction - An Innovativeand
Promising Extraction Tool for Medicinal Plant Research. Pharmacognosy Reviews, 1. MARAGHNI, M., GORAI, M. & NEFFATI, M. 2010. Seed germination at different temperatures and
water stress levels, and seedling emergence from different depths of Ziziphus lotus. South
African Journal of Botany, 76, 453-459.
MEDINA-TORRES, N., AYORA-TALAVERA, T., ESPINOSA-ANDREWS, H., SÁNCHEZ-CONTRERAS, A. & PACHECO, N. 2017. Ultrasound Assisted Extraction for the Recovery of Phenolic Compounds
from Vegetable Sources. Agronomy, 7, 47.
MKADMINI HAMMI, K., JDEY, A., ABDELLY, C., MAJDOUB, H. & KSOURI, R. 2015. Optimization of ultrasound-assisted extraction of antioxidant compounds from Tunisian Zizyphus lotus fruits
using response surface methodology. Food Chemistry.
NAILI, M., ALGHAZEER , R. O., SALEH , N. A. & AL-NAJJAR, A. Y. 2010. Evaluation of antibacterial and antioxidant activities of Artemisia campestris (Astraceae) and Ziziphus lotus (Rhamnacea).
Arabian Journal of Chemistry, 3.
OURZEDDINE , W., FADEL , H., MECHEHOUD , Y., CHALCHAT , J.-C., FIGUEREDO , G., CHALARD , P., BENAYACHE , F. & BENAYACHE, S. 2017. Chemical Composition and Antioxidant Activity of
CHAPTER I Literature Review
11
the Fruit Essential Oil of Zizyphus lotus (L.) Desf. (Rhamnaceae). International Journal of
Pharmacognosy and Phytochemical Research, 9, 228-232.
RSAISSI, N., ELKAMILI, BENCHARKI, B., HILLALI, L. & BOUHACHE, M. 2013. Antimicrobial activity of fruits extracts of the wild jujube Ziziphus Lotus (L.) Desf. International Journal of Scientific &
Engineering Research, 4, 1521–1528.
SAADOUDI , M., HAMEBABA , L. & ABDEDDAIM , M. 2012. Study of the Glucidic Fraction of Celtis Australis L, Crataegus Azarolus L, Crataegus Monogyna Jacq., Elaeagnus Angustifolia L. and
Zizyphus Lotus L. Fruits. International Journal of Biological Macromolecules, 6, 196-199. SAIAHA, H., ALLEMB, R. & KEBIRA , F. Z. E. 2016. Antioxidant and Antibacterial activities of Six
Algerian Medicinal Plants. International Journal of Pharmacy and Pharmaceutical Sciences, 8, 367-374.
SAMARAM, S., MIRHOSSEINI, H., TAN, C. P. & GHAZALI, H. M. 2013. Ultrasound-assisted extraction (UAE) and solvent extraction of papaya seed oil: yield, fatty acid composition and
triacylglycerol profile. Molecules, 18, 12474-87.
SHUKLA, A., GUPTA, R., SHARMA, P. & JAIN, A. 2013. Comparative study of microwave assisted with
conventional extraction of calcium sennosides from senna leaf.
VAUZOUR, D. 2017. Polyphenols and brain health. Oilseeds & fats Crops and Lipids, 24. VAZQUEZ, C. V., ROJAS, M. G., RAMIREZ, C. A., CHAVEZ-SERVIN, J. L., GARCIA-GASCA, T., FERRIZ
MARTINEZ, R. A., GARCIA, O. P., ROSADO, J. L., LOPEZ-SABATER, C. M., CASTELLOTE, A. I., MONTEMAYOR, H. M. & DE LA TORRE CARBOT, K. 2015. Total phenolic compounds in milk from different species. Design of an extraction technique for quantification using the
Folin-Ciocalteu method. Food Chem, 176, 480-6.
VILKHU, K., MAWSON, R., SIMONS, L. & BATES, D. 2008. Applications and opportunities for ultrasound assisted extraction in the food industry — A review. Innovative Food Science &
Emerging Technologies, 9, 161-169.
ZHANG, H.-F., YANG, X.-H. & WANG, Y. 2011. Microwave assisted extraction of secondary metabolites from plants: Current status and future directions. Trends in Food Science &
Chapter II
Experimental
Work
CHAPTER II Experimental Work
9
The natural phenolic compounds have received increasing interest in the last years, since a great amount of them can be found in plants and consumption of vegetables and that are known to have several health-benefitting properties, including reducing the risks of certain types of cancer, cardiovascular, heart and neurodegenerative diseases due to their antioxidant power (Song et al., 2009). In the present study, the total phenolic compounds, flavonoids concentrations and antioxidant activity of Z. lotus fruits were determined after the ultrasonic-assisted extraction (UAE), but what are the optimal extraction conditions of these substances? II.1. Chemical reagents and equipment
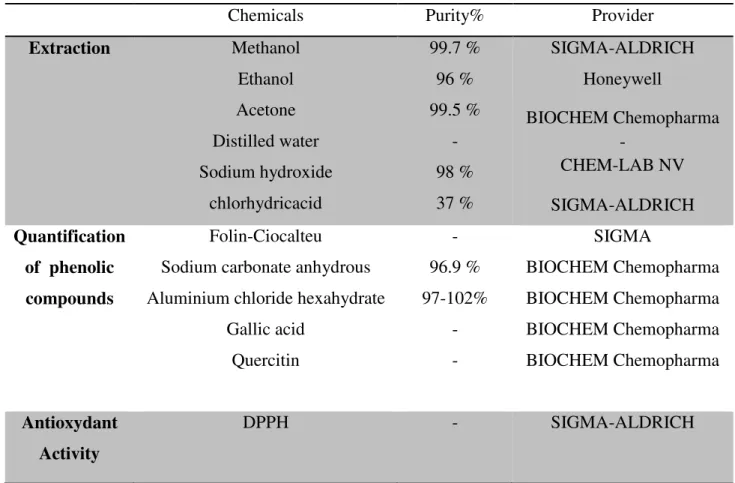
All chemicals used were of analytical grades. The reagents used in the experiments are collected in Table 3.
Table 3: The reagents used in the present work.
Chemicals Purity% Provider
Extraction Methanol Ethanol Acetone Distilled water Sodium hydroxide chlorhydricacid 99.7 % 96 % 99.5 % - 98 % 37 % SIGMA-ALDRICH Honeywell BIOCHEM Chemopharma - CHEM-LAB NV SIGMA-ALDRICH Quantification of phenolic compounds Folin-Ciocalteu Sodium carbonate anhydrous Aluminium chloride hexahydrate
Gallic acid Quercitin - 96.9 % 97-102% - - SIGMA BIOCHEM Chemopharma BIOCHEM Chemopharma BIOCHEM Chemopharma BIOCHEM Chemopharma Antioxydant Activity DPPH - SIGMA-ALDRICH
CHAPTER II Experimental Work
10
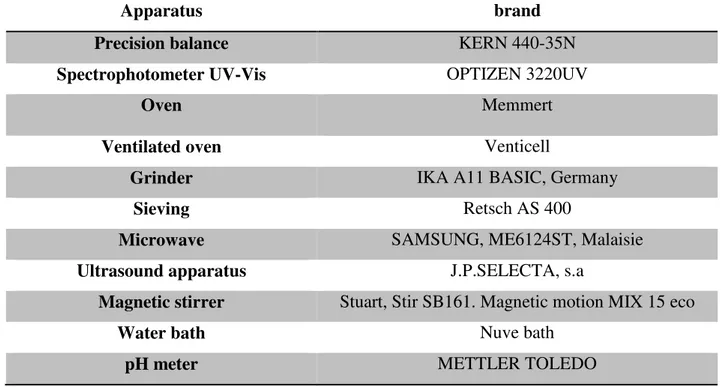
The various apparatus used for analysis are listed in Table 4. Table 4: Apparatus used for this present investigation.
Apparatus brand
Precision balance KERN 440-35N
Spectrophotometer UV-Vis OPTIZEN 3220UV
Oven Memmert
Ventilated oven Venticell
Grinder IKA A11 BASIC, Germany
Sieving Retsch AS 400
Microwave SAMSUNG, ME6124ST, Malaisie
Ultrasound apparatus J.P.SELECTA, s.a
Magnetic stirrer Stuart, Stir SB161. Magnetic motion MIX 15 eco
Water bath Nuve bath
pH meter METTLER TOLEDO
II.2. Plant material
Drying and Grinding
Fresh Z. Lotus fruits were harvested from Djelfa city (Algeria) in august 2017 (Fig.6). The fruits have been well washed with tap water followed by distilled water to remove all impurities, drying was carried out in two stages, first a pre-drying in the open air to remove excess water, followed by drying in an oven. Representative samples of 10 g (triplicate) are brought to 103 ± 2°C until constant weight, to calculate the moisture content, while the other samples of the same weight and the rest of the harvest were dried in an oven at 40 °C equipped with ventilation in the dark about a week to protect the active compounds content from light oxidation (Doymaz, 2004). The samples are brewed every day, especially at the beginning of drying to facilitate it. After confirmation of the humidity test, dried samples were ground with an electrical grinder, the powder was passed through standard sieve and the fractions with particle sizes between 500µm and 50µm were used. The powder was stored in airtight bags until use.
CHAPTER II
The moisture content (MC) was calculated by expressing the weight loss upon drying as a fraction of the initial weight of sample used.
Where:
H%: Water content (%)
M1: Mass capsule + fresh matter before drying in g,
M2: Mass of the unit after drying g
P: Mass test specimen in g.
Figure
II.3. Experiment design
The experimental design was divided into two major parts. using Plackett- Burman Design
lotus phenolic extraction and
we use Fractional Factorial Design extraction to obtain an extract with high capacity.
II.3.1.Plackett-Burman
The Plackett-Burman
completes the complete 2k factorial designs and the 2 As with factorial designs, the
usually no central points because we do not try to model the results
CHAPTER II Experimental Work
moisture content (MC) was calculated by expressing the weight loss upon drying as a fraction of the initial weight of sample used.
% ∗
: Mass capsule + fresh matter before drying in g, Mass of the unit after drying g ,
Figure 6: Photography of Z. lotus fruit.
and extraction of phenol compounds
The experimental design was divided into two major parts. Firstly
Design (PBD) to determine the appropriate range of conditions for and treating all the factors influencing extraction yields. After that, Fractional Factorial Design (FFD) to optimize the parameters of
extraction to obtain an extract with high total phenolic compound, flavonoids
Burman Design (PBD)
Design is screening designs based on Hadamard matrices. It factorial designs and the 2k-p fractional designs.
As with factorial designs, the PBD take only two factors -1 and +1 levels and there are usually no central points because we do not try to model the results.
Experimental Work
11
moisture content (MC) was calculated by expressing the weight loss upon drying
compounds
a screening design to determine the appropriate range of conditions for Z. treating all the factors influencing extraction yields. After that, to optimize the parameters of Z. lotus fruits , flavonoids and antioxidant
ased on Hadamard matrices. It
CHAPTER II Experimental Work
12
II.3.1.1. Preparation of the experimental plan II.3.1.1.1. Description of the study
PBD is one of statistical experimental designs used to identify the important factors among a large number of variables that influence extraction of TPC, TFC from Z. lotus fruits.
II.3.1.1.2. Response
PBD assay was used to select the deferent parameters that influence the extraction of TPC, TFC from Z. lotus fruits.
II.3.1.1.3. Goal of the study
The main purpose of PBD assay is screening all influencing factors on the extraction of phenolic compounds of Z. lotus fruits (Table 5).
Table 5 : The coded values and corresponding actual values of extraction parameters used in screening study.
II.3.1.1.4. PBD matrix
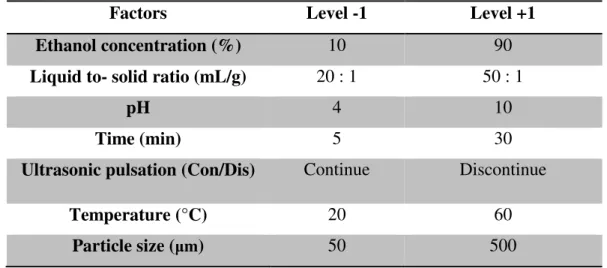
There are seven factors influencing the quantities of total phenolic compound, flavonoids of Z. lotus fruits. So the screening design chosen is PBD assay which has 12 tests in triplicate (Table 6).
The factors that have been considered are reported in the table below with specific levels for each test:
Factors Level -1 Level +1
Ethanol concentration (%) 10 90
Liquid to- solid ratio (mL/g) 20 : 1 50 : 1
pH 4 10
Time (min) 5 30
Ultrasonic pulsation (Con/Dis) Continue Discontinue
Temperature (°C) 20 60
CHAPTER II Experimental Work
13
Table 6: The actual values of extraction parameters used in screening study. Test Time (min) Particle size (µm) Solvent (%) pH Ratio liquid-solid (mL/g) Ultrasonic pulsation (Con/Disc) Temperature (°C) 1 30 500 10 4 20 : 1 Continue 20 2 30 50 10 4 50 : 1 Discontinue 20 3 30 50 90 10 50 : 1 Discontinue 20 4 30 500 90 4 20 : 1 Discontinue 60 5 5 50 90 4 20 : 1 Continue 20 6 5 500 90 10 20 : 1 Discontinue 20 7 5 500 10 4 50 : 1 Discontinue 60 8 30 50 10 10 20 : 1 Continue 60 9 5 500 10 10 50 : 1 Continue 20 10 30 500 90 10 50 : 1 Continue 60 11 5 50 90 4 50 : 1 Continue 60 12 5 50 10 10 20 : 1 Discontinue 60
II.3.2. Fractional Factorial Design (FFD)
On the basis of Plackett-Burman Design, major influence factors were selected. Then, a Fractional Factorial Design was conducted to optimize the UAE process.
Choice of the experimental design
A 26-2plan is constructed from a base plan 24 that has four main factors and tow factors that are related to interactions. In our case we have six factors; we will use the first four columns to study four factors.
II.3.2.1. Preparation of the experimental design II.3.2.1.1. Description of the study
In the present study, a Fractional Factorial Design (FFD) was examined for optimization of UAE process parameters (ethanol concentration, extraction time, and liquid-to-solid ratio, particle size, temperature, ultrasonic pulsation) to obtain maximum yield of total phenolics, flavonoids and antioxidant activity of UAE extracts from Z. lotus fruits.
II.3.2.1.2. Factors
CHAPTER II Experimental Work
14
Table 7: The levels values of the optimization parameters used in UAE.
Factors Level -1 Level +1
Ethanol concentration (%) 10 90
Liquid to- solid ratio (mL/g) 20 : 1 50 : 1
Time (min) 5 30
Ultrasonic pulsation (Con/Dis) Continue Discontinue
Temperature (°C) 20 60
Particle size (µm) 50 500
II.3.2.1.3. FFD matrix
The factors that have been considered in the FFD are presented in Table 8 with specific levels for each test (16 tests in triplicate):
Table 8: The actual values of extraction parameters used in optimization process. Test Solvent (%) Ratio liquid-solid (mL/g) Time (min) Ultrasonic pulsation(Con/Disc) Temperature (°C) Particle size (µm) 1 10 50 : 1 30 Disontinue 60 500 2 90 50 : 1 5 Discontinue 60 500 3 10 20 : 1 5 Continue 20 500 4 90 20 : 1 5 Discontinue 20 500 5 90 50 : 1 30 Continue 60 500 6 90 20 : 1 30 Continue 20 500 7 10 50 : 1 5 Continue 60 500 8 90 20 : 1 5 Continue 60 50 9 90 20 : 1 30 Discontinue 60 50 10 10 20 : 1 30 Discontinue 20 500 11 90 50 : 1 5 Continue 20 50 12 10 20 : 1 5 Discontinue 60 50 13 10 50 : 1 30 Continue 20 50 14 10 50 : 1 5 Discontinue 20 50 15 90 50 : 1 30 Discontinue 20 50 16 10 20 : 1 30 Continue 60 50
II.3.2.1.4. Choice of the degree of experiment
In the case of the six factors, the basic plan24, has four columns for the four factors, six columns for the second order interaction, four columns for the third order interaction, and one column for the fourth order interaction.
CHAPTER II Experimental Work
15
One might be tempted to choose the fourth-order interaction for aliasing the first additional factor, namely:
The other additional factor would be aliases on the order 3 interactions, for example:
These choices lead to three independent alias generators:
The dependent generators are reckoned from these independent generators by multiplying them 2 - 2, 3 in 3 and 4 in 4. We are not going to make all these calculations because the software can make them for us. But he is interesting to calculate one or two well chosen:
∗
We see that we get a three-digit generator. The chosen plan is therefore a resolution plan III, which means that main factors will be aliased to second order interactions. This is not very good. Is it possible to achieve a design where main effects are confounded with 3-factors interactions .For this, it is necessary to alias the additional factors on the interactions of order three or four
We obtain three independent alias generators:
When calculating the dependent generators from these independent generators, there are no generators containing less than four digits. The design is therefore of resolution IV, which means that no main effects are aliased with two-factor interactions, but two-factor interactions are aliased with each other. If the first hypothesis of interpretation is acceptable (negligible third-order interaction), we obtain directly the coefficients, therefore the effects of the main factors and not the contrasts.
CHAPTER II
II.4. Ultrasound assisted extraction
The dried peel powder was extracted in an ultrasonic apparatus with working frequency fixed at 20 kHz. For the extraction, 1 gram of the powder was placed in an a glass bottle containing the extraction solvent
exposed to acoustic waves under variations of ethanol concentration, liquid-to-solid ratio, temperature,
controlled continuously. After the extraction, the solution was filtered through filter was centrifuged at 10000 x g for 10
determinations.
Figure 7: UAE equipment used
II.5. Microwave assisted
Microwave assisted extaction
comparison, was carried out in the exactly same conditions parameters. Thus,1 gram of Ziziphus lotus
and 24 h for MAE and CE respectively
Figure 8: Equipment used in MAE and CE
CHAPTER II Experimental Work
assisted extraction
The dried peel powder was extracted in an ultrasonic apparatus with working For the extraction, 1 gram of the powder was placed in an a
xtraction solvent (Dahmoune et al., 2013). The suspension was exposed to acoustic waves under variations of ethanol concentration, sonication t
emperature, pH, particle size, ultrasonic pulsation. The controlled continuously. After the extraction, the solution was filtered through filter was centrifuged at 10000 x g for 10 min the supernatants were collected for
UAE equipment used during extraction of phenolic compounds (Photo from Lab 08).
. Microwave assisted and Conventional extraction
assisted extaction (MAE) and Conventional extraction comparison, was carried out in the exactly same conditions without ultrasound and
Ziziphus lotus L powder was extracted with solvent during
h for MAE and CE respectively (Dahmoune, Nayak et al. 2015).
Equipment used in MAE and CE (Photo from Lab. N 08
Experimental Work
16
The dried peel powder was extracted in an ultrasonic apparatus with working For the extraction, 1 gram of the powder was placed in an amber The suspension was sonication time and The temperature was controlled continuously. After the extraction, the solution was filtered through filter paper and were collected for the analytical
during extraction of phenolic compounds (Photo from Lab. N
Conventional extraction (CE), made for without ultrasound and microwave was extracted with solvent during 5 min
CHAPTER II Experimental Work
17
II.6. Analytical determinations
II.6.1.Total phenolic content
The determination of TPC in the extracts were done according to the method of (Georgé et al., 2005).Oxidations of phenolic compounds with this reagent include reaction with the mixture of H3PW12O40 and H3PMo12O40 acids in the alkaline medium. At this reaction a mix of
blue oxides is formed (Lapornik et al., 2005).A volume of 500 µL of diluted fruits extract with distilled water was added to 2.5 mL of 10-fold diluted Folin–Ciocalteau reagent. The solution was mixed and incubated at room temperature for 2 min. After 2 min, 2 mL of 7.5% sodium carbonate (Na2CO3) (v/v) were added. After incubation at 50° C for 15 min, the absorbance of
the sample was measured at 760 nm against a blank (made as reported for the sample) byusing a UV–VIS Spectrophotometer. The assay was performed in triplicate. For quantification, a calibration curve was generated with the standard solution of gallic acid, (R2= 0.999). The TPC were expressed as mg of gallic acid equivalent (GAE) per gram of powder on dry weight (DW) basis (Appendix 1).
II.6.2. Total flavonoids content
The total flavonoid contents were estimated according to the aluminum chloride method of (Adedapo et al., 2008) based on the formation of a complex flavonoid-aluminum. Briefly, 1 mL of extracts was mixed with 1 mL of 2 % AlCl3. After 15 min of incubation in the dark, the
absorbance of the mixture was determined at 430 nm. Each analysis was carried out in triplicate. The total flavonoid content was calculated from a calibration curve was generated with the standard solution of quercitin, (R2= 0.9996). The TFC were expressed an mg of quercitin equivalent (EQ) per gram of powder on dry weight (DW) basis (Appendix 2).
II.6.3.Phenols index
The phenols index is a method based on the direct measurement of the absorbance at 280 nm of the various diluted extracts (Spigno et al., 2015). The results are expressed in absorbance unit.
CHAPTER II Experimental Work
18
II.7. Antioxidant activity
II.7.1. Scavenging activity against the DPPH* radical
The radical-scavenging activity of samples was evaluated by the DPPH• assay. DPPH (2,2-diphenyl-1-picrylhydrazyl) is a stable highly colored free radical that can abstract labile hydrogen atoms from phenolic antioxidant (Ar OH) with concomitant formation of a colorless hydrazine (DPPH-H) (Molyneux, 2004). The free radical-scavenging activity (RSA) of an extract can be expressed as the percentage of DPPH reduced by a given amount of extract. The free radical-scavenging activity (RSA) was measured, following (Achat et al., 2012) method modified briefly, 25ul of extract was added to 1ml of DPPH solution (60
µmol/L in methanol) and the mixture was left in the dark at room temperature for 20 min. The absorbance of the resulting solution was measured at 517 nm with a spectrophotometer. Ethanol instead of sample solution was used as a control.
The total RSA of each extract was expressed as the percentage of DPPH reduced and was calculated by the following equation:
% ×
Where:
A0: absorbance of DPPH solution without any antioxidant;
A: absorbance of DPPH solution after reaction with the extract. All experiments were performed in triplicate.
CHAPTER II Experimental Work
19
ACHAT, S., TOMAO, V., MADANI, K., CHIBANE, M., ELMAATAOUI, M., DANGLES, O. & CHEMAT, F. 2012. Direct enrichment of olive oil in oleuropein by ultrasound-assisted maceration at laboratory and pilot plant scale. Ultrason Sonochem, 19, 777-786.
ADEDAPO, A. A., JIMOH, F. O., KODURU, S., MASIKA, P. J. & AFOLAYAN, A. J. 2008. Evaluation of the medicinal potentials of the methanol extracts of the leaves and stems of Halleria lucida.
Bioresource Technology, 99, 4158-4163.
DAHMOUNE, F., BOULEKBACHE, L., MOUSSI, K., AOUN, O., SPIGNO, G. & MADANI, K. 2013. Valorization of Citrus limon residues for the recovery of antioxidants: evaluation and optimization of microwave and ultrasound application to solvent extraction. Industrial Crops
and Products, 50, 77-87.
DOYMAZ, İ. 2004. Convective air drying characteristics of thin layer carrots. Journal of Food
Engineering, 61, 359-364.
GEORGÉ, S., BRAT, P., ALTER, P. & AMIOT, M. J. 2005. Rapid Determination of Polyphenols and Vitamin C in Plant-Derived Products. Journal of Agricultural and Food Chemistry, 53, 1370-1373.
KÄHKÖNEN, M. P., HOPIA, A. I., VUORELA, H. J., RAUHA, J.-P., PIHLAJA, K., KUJALA, T. S. & HEINONEN, M. 1999. Antioxidant Activity of Plant Extracts Containing Phenolic Compounds. Journal of
Agricultural and Food Chemistry, 47, 3954-3962.
LAPORNIK, B., PROŠEK, M. & WONDRA, A. G. 2005. Comparison of extracts prepared from plant by-products using different solvents and extraction time. Journal of Food Engineering, 71, 214-222.
MOLYNEUX, P. 2004. The use of the stable free radical diphenylpicrylhydrazyl (DPPH) for estimating antioxidant activity. Songklanakarin J. Sci. Technol, 26, 211-219.
SONG, X.-J., ZHANG, M., MUJUMDAR, A. S. & FAN, L. 2009. Drying Characteristics and Kinetics of Vacuum Microwave–Dried Potato Slices. Drying Technology, 27, 969-974.
SPIGNO, G., AMENDOLA, D., DAHMOUNE, F. & JAUREGI, P. 2015. Colloidal gas aphrons based separation process for the purification and fractionation of natural phenolic extracts. Food