HAL Id: hal-00966881
https://hal.sorbonne-universite.fr/hal-00966881
Submitted on 27 Mar 2014
HAL is a multi-disciplinary open access
archive for the deposit and dissemination of
sci-entific research documents, whether they are
pub-lished or not. The documents may come from
teaching and research institutions in France or
abroad, or from public or private research centers.
L’archive ouverte pluridisciplinaire HAL, est
destinée au dépôt et à la diffusion de documents
scientifiques de niveau recherche, publiés ou non,
émanant des établissements d’enseignement et de
recherche français ou étrangers, des laboratoires
publics ou privés.
Sun-Earth System Interaction studies over Vietnam: an
international cooperative project
Christine Amory-Mazaudier, Minh Le Huy, Y. Cohen, V. Doumbia, A.
Bourdillon, R. Fleury, B. Fontaine, C. Ha Duyen, A. Kobea, P. Laroche, et al.
To cite this version:
Christine Amory-Mazaudier, Minh Le Huy, Y. Cohen, V. Doumbia, A. Bourdillon, et al.. Sun-Earth
System Interaction studies over Vietnam: an international cooperative project. Annales Geophysicae,
European Geosciences Union, 2006, 24, pp.3313-3327. �hal-00966881�
Ann. Geophys., 24, 3313–3327, 2006 www.ann-geophys.net/24/3313/2006/ © European Geosciences Union 2006
Annales
Geophysicae
Sun-Earth System Interaction studies over Vietnam: an
international cooperative project
C. Amory-Mazaudier1, M. Le Huy2, Y. Cohen3, V. Doumbia4,*, A. Bourdillon5, R. Fleury6, B. Fontaine7, C. Ha Duyen2, A. Kobea4, P. Laroche8, P. Lassudrie-Duchesne6, H. Le Viet2, T. Le Truong2, H. Luu Viet2, M. Menvielle1, T. Nguyen Chien2, A. Nguyen Xuan2, F. Ouattara9, M. Petitdidier1, H. Pham Thi Thu2, T. Pham Xuan2, N. Philippon**, L. Tran Thi2, H. Vu Thien10, and P. Vila1
1CETP/CNRS, 4 Avenue de Neptune, 94107 Saint-Maur-des-Foss´es, France
2Institute of Geophysics, Vietnamese Academy of Science and Technology , 18 Hoang Quoc Viet, Cau Giay, Hano¨ı, Vietnam 3IPGP, 4 Avenue de Neptune, 94107 Saint-Maur-des-Foss´es, France
4Laboratoire de Physique de l’Atmosph`ere, Universit´e d’Abidjan Cocody 22 B.P. 582, Abidjan 22, Cˆote d’Ivoire
5Institut d’Electronique et de T´el´ecommunications, Universit´e de Rennes Bˆat 11D, Campus Beaulieu, 35042 Rennes, c´edex,
France
6ENST, Universit´e de Bretagne Occidentale, CS 83818, 29288 Brest, c´edex 3, France 7CRC , Facult´e des Sciences, 6 Boulevard Gabriel, F 21004 Dijon c´edex 04, France
8Unit´e de Recherche Environnement Atmosph´erique, ONERA, 92332 Chatillon, c´edex, France 9University of Koudougou, Burkina Faso
10Laboratoire signaux et syst`emes, CNAM, 292 Rue saint Martin, 75141 Paris c´edex 03, France *V. Doumbia previously signed V. Doumouya
**affiliation unknown
Received: 15 June 2006 – Revised: 19 October 2006 – Accepted: 8 November 2006 – Published: 21 December 2006
Abstract. During many past decades, scientists from
var-ious countries have studied separately the atmospheric mo-tions in the lower atmosphere, in the Earth’s magnetic field, in the magnetospheric currents, etc. All of these separate studies lead today to the global study of the Sun and Earth connections, and as a consequence, new scientific programs (IHY- International Heliophysical Year, CAWSES- Climate and Weather in the Sun-Earth System) are defined, in order to assume this new challenge. In the past, many scientists did not have the possibility to collect data at the same time in the various latitude and longitude sectors. Now, with the progress of geophysical sciences in many developing coun-tries, it is possible to have access to worldwide data sets. This paper presents the particularities of geophysical param-eters measured by the Vietnamese instrument networks. It in-troduces a cooperative Vietnamese-IGRGEA (International Geophysical Research Group Europe Africa) project, and presents, for the first time, to the international community, the geophysical context of Vietnam.
Concerning the ionosphere: since 1963, during four solar cycles, the ionosonde at Phu Thuy (North Vietnam) was op-erating. The Phu Thuy data exhibits the common features for the ionospheric parameters, previously observed in other longitude and latitude sectors. The critical frequencies of
Correspondence to: C. Amory-Mazaudier
the E, F1 and F2 ionospheric layers follow the variation of the sunspot cycle. F2 and E critical frequencies also exhibit an annual variation. The first maps of TEC made with data from GPS receivers recently installed in Vietnam illustrate the regional equatorial pattern, i.e. two maxima of electronic density at 15◦N and 15◦S from the magnetic equator and
a trough of density at the magnetic equator. These features illustrate the equatorial fountain effect.
Concerning the Earth’s magnetic field: a strong amplitude of the equatorial electrojet was first observed by the CHAMP satellite at the height of 400 km in the Vietnamese longitude sector. In this paper we compare the ground magnetic ob-servations of the Indian and Vietnamese magnetometer net-works. This comparison highlights the regional structure of the amplitude of the equatorial electrojet, which is stronger in Vietnam than in India.
Concerning the monsoon: Vietnam exhibits a strong mon-soon and has mainly one rainy season peaking in August, hence associated with the southwest monsoon flow. But some monsoon variability from one place to another is re-lated to the orography. In the mountainous northern regions of Vietnam, there is an “early” monsoon peaking in July. In the coastal regions between 12◦N and 19◦N the monsoon
season is centered on October.
Concerning lightning: Vietnam is a country of strong at-mospheric storms with some areas of very intense lightning
3314 C. Amory-Mazaudier et al.: Sun-Earth System Interaction studies over Vietnam in North Vietnam (22,5◦N, 105◦E) and in South Vietnam
(11◦N, 107◦E). In North Vietnam strong lightning is
associ-ated with the most intense rainy region.
Keywords. Ionosphere (Electric fields and currents) –
Me-teorology and dynamics (Tropical meMe-teorology) – Geomag-netism and paleomagGeomag-netism (Time variations, diurnal to sec-ular)
1 Introduction
For 15 years the IGRGEA (International Geophysical Re-search Group in Europe Africa) is involved in geophysics in Africa (Mazaudier et al., 1993; Amory-Mazaudier et al., 2005). This group started in 1995 in order to continue the sci-entific work done from 1991 to 1995 in the frame of the IEEY (International Year of the Equatorial Electrojet). The IEEY project had been decided at the VANCOUVER Assembly of the IAGA, in 1987, on the request of the Interdivisional Com-mission on Developing Countries (ICDC). During the IEEY, Doumouya and Cohen (2004) discovered that the amplitude of the daily variation of the Earth’s magnetic field observed with the CHAMP satellite is stronger in the Asian sector than in the African one. These observations led to the cooperation between the IGRGEA and the Hano¨ı Institute of Geophysics (Vietnam), HIG, in order to understand this phenomena.
It is well known that the equatorial electrojet circulating in the ionospheric dynamo layer results from the atmospheric motions. These atmospheric motions are mainly due to mi-grating atmospheric tides generated at lower altitudes (Chap-man and Lindzen, 1970). By collision, the atmosphere drags ions though the Earth’s magnetic field (Stewart, 1882) and generates the equatorial electrojet itself at the origin of the daily variation of the Earth’s magnetic field. More recently, Hagan and Forbes (2002), showed that nonmigrating waves, due to deep convection events (related to tropical meteoro-logical storms, as well as monsoon) in the boundary layer and in the troposphere, can affect the atmospheric motions in the dynamo layer. Therefore, it is necessary to study the equa-torial electrojet in the frame of the Sun-Earth connections, including worldwide data sets from the low atmosphere to the Sun.
Taking into account all of these facts, IGRGEA and HIG decided to participate together in international programs such as CAWSES (Climate and Weather in the Sun-Earth System) and IHY(International Heliophysical Year), both devoted to the Sun-Earth connections.
Vietnamese scientists published in a Vietnamese journal various scientific results on the magnetic and ionosonde data (Truong Quang and Le Huy, 1987; Le Huy, 1999; Le Huy and Pham Van, 2001). But at the present time these scientific results are not available for the international community.
This introductive paper presents to the international com-munity the Vietnamese scientific instrument networks and
data sets, and the morphological features of the geophysical parameters. Some of these morphological features are differ-ent from the other longitude sectors. The first section is de-voted to the scientific frame. The second section presents the existing Vietnamese network of atmospheric stations, mag-netometers, ionosondes, GPS receivers and magnetotelluric stations. In this section we recall all the data sets recorded in Vietnam during the last decades. The third section high-lights some interesting observations characterizing Vietnam and then we conclude.
1.1 Scientific frame
We concentrate our studies on physical processes (dynamics, electrodynamics, magnetic) operating in the Earth’s environ-ment at various time scales (several minutes to several solar cycles) and space scales (planetary, regional and local). This is the reason why we are analysing atmospheric, as well as ionospheric parameters in the same paper.
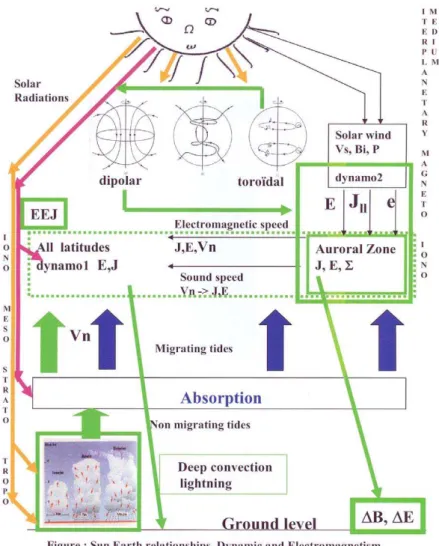
Figure 1 (originally from Amory-Mazaudier, 1983) is a schematic view of some connections between the Sun and the Earth. The vertical dimension represents the distance from the Sun to the Earth and the horizontal dimension the distance from the pole (right side) to the equator (left side). In green our main interests are underlined: 1) the monsoon in the tropical and equatorial troposphere and in the atmo-spheric boundary layer (bottom left), 2) the equatorial elec-trojet (middle left) flowing in the ionosphere along the mag-netic equator and its connections with the auroral electro-jets (middle right), 3) the Earth’s magnetic field variation due to the electric currents flowing in the ionosphere and in the magnetosphere (bottom), 4) the solar activity (top).
1.2 Solar radiations
The Sun’s radiations reach the environment of the Earth at all latitudes. These radiations are the source of various physical processes of the Sun-Earth System.
In the stratosphere, sources of migrating atmospheric tides propagate toward higher altitudes. They generate in the dy-namo E layer (altitudes comprised between 90 and 190 km) the circulation of ionospheric electric currents by the dynamo effect (Stewart 1882). This dynamo layer exists mainly on the dayside of the Earth’s, as a consequence of the photoion-ization by solar radiations. These daily regular ionospheric currents are the source of the daily regular variations of the Earth’s magnetic field SR (Mayaud, 1965a, 1965b), green
vertical arrows indicate the connection between the iono-spheric electric currents and the Earth’s magnetic field. The dynamo layer process is schematised on the left side of the figure, where it concerns all the latitudes.
At the bottom left side of Fig. 1 for equatorial and trop-ical latitudes, the phystrop-ical process of deep convection in the boundary layer and troposphere, due to the monsoon, influences the upper levels of the atmosphere. During the
C. Amory-Mazaudier et al.: Sun-Earth System Interaction studies over Vietnam 3315
Fig. 1. Schematic figure concerning some processes involved in the Sun-Earth system.
monsoon, large electrical field variations occur in clouds with large lightning activity (Richard et al., 1986; Petitdidier et Laroche, 2005). Recent theoretical and experimental studies in the tropical and equatorial zones revealed the importance of the tropospheric latent heat release in the excitation of mi-grating and nonmimi-grating tides in the middle and upper at-mosphere (Hagan and Forbes, 2002; Fukao et al., 2003; Gu-rubaran et al., 2005). These tides can affect the ionospheric electric currents and as a consequence, the variation of the Earth’s magnetic field.
1.3 Solar wind
The solar wind interacts with the magnetosphere through two major physical processes: the viscous interaction (Ax-ford and Hines, 1961) and the reconnection (Dungey, 1961). These physical processes affect the whole magnetosphere and also the auroral ionosphere. In the Fig. 1, middle part, the auroral ionosphere (right side) is connected to the
mid-dle and equatorial ionosphere (left side). Two main phys-ical processes are involved in the electrodynamic coupling between the high and low latitudes: 1) the prompt penetra-tion of the magnetospheric convecpenetra-tion electric field (Nishida et al., 1966; Nishida 1968; Vasyliunas, 1970; Kob´ea et al., 2000) and 2) the ionospheric disturbance dynamo process (Blanc and Richmond, 1980; Mazaudier and Venkateswaran, 1990; Le Huy and Amory-Mazaudier, 2005).
1.4 Solar magnetic cycles
To develop a pertinent analysis of geophysical data it is nec-essary to know exactly the geomagnetic context of all the observations. In our project, for the analysis of the long se-ries of Vietnamese data, we will follow the classification of magnetic activity established by Legrand and Simon (1989), whjo along with Simon and Legrand (1989) analysed and classified the geomagnetic activity in terms of the solar ac-tivity (due to the two magnetic solar cycles), by using the
3316 C. Amory-Mazaudier et al.: Sun-Earth System Interaction studies over Vietnam
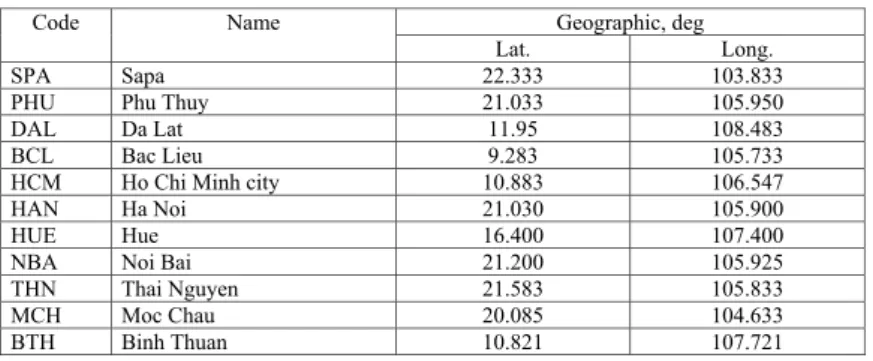
Table 1a. Geographic coordinates of the Vietnamese network containing instruments for upper atmospheric studies.
Geographic, deg Code Name Lat. Long. SPA Sapa 22.333 103.833
PHU Phu Thuy 21.033 105.950
DAL Da Lat 11.95 108.483
BCL Bac Lieu 9.283 105.733
HCM Ho Chi Minh city 10.883 106.547
HAN Ha Noi 21.030 105.900
HUE Hue 16.400 107.400
NBA Noi Bai 21.200 105.925
THN Thai Nguyen 21.583 105.833
MCH Moc Chau 20.085 104.633
BTH Binh Thuan 10.821 107.721
Table 1b. Geographic coordinates of the Vietnamese meteorological stations.
20 Geographic, deg No. Name Lat. Long. 1 Dien Bien 21.40 103.02 2 Hoa Binh 20.82 105.33 3 Lai Chau 22.07 103.15 4 Mai Chau 20.67 105.05 5 Moc Chau 20.82 104.70 6 Muong Te 22.38 102.83 7 Son La 21.32 103.88 8 Yen Chau 21.05 104.28 9 Bac Quang 22.50 104.87 10 Yen Bai 21.72 104.85 11 Van Chan 21.58 104.52 12 Cao Bang 22.65 106.25 13 Ha Giang 22.82 104.98 14 Bai Chay 20.97 107.07 15 Lang Son 21.87 106.77 16 Thai Nguyen 21.58 105.83 17 Vinh Yen 21.28 105.58 18 Bac Giang 21.28 106.22 19 Lang 21.03 105.85 20 Nam Dinh 20.40 106.15 21 Ninh Binh 20.23 105.97 22 Phu Lien 20.80 106.63 23 Son Tay 21.13 105.50 24 Bai Thuong 19.92 105.37 25 Dong Hoi 17.47 106.62 26 Ha Tinh 18.40 105.90 27 Hue 16.40 107.70 28 Nam Dong 16.15 107.72 29 Tuong Duong 19.28 104.43 30 Thanh Hoa 19.82 105.78 31 Tinh Gia 19.58 105.78 32 Vinh 18.67 105.67 33 Ba To 14.77 108.72 34 Da Nang 16.03 108.18 35 Nha trang 12.25 109.20 36 Phan Thiet 10.93 108.10 37 Quang Ngai 15.13 108.78 38 Quy Nhon 13.77 109.22 39 Tuy Hoa 13.08 109.28 40 Ayunpa 13.42 108.43 41 Bao Loc 11.47 107.80 42 Ban Me thuot 12.67 108.05 43 Da Lat 11.95 108.43 44 PLaycu 13.98 108.00 45 Ca Mau 9.17 105.17 46 Can Tho 10.03 105.78 47 Phu Quoc 10.22 103.97 48 Rach Gia 10.00 105.08 49 Tan Son Nhat 10.82 106.67 50 Vung tau 10.33 107.08
C. Amory-Mazaudier et al.: Sun-Earth System Interaction studies over Vietnam 3317
Table 1c. Geographic coordinates of the GPS stations.
Table 1c Geopgraphic Coordinates GPS observatories Latitude Longitude 1 Kunm (China) 25.02000oN 102.79700oE 2 Hanoi (Vietnam) 21.04740oN 105.79970oE 3 Hue (Vietnam) 16.45920oN 107.59270oE
4 Hoc Mon (Vietnam) 10.84860oN 106.55980oE
5 Ntus (Singapour) 1.34580oN 103o67995oE
6 Bako (Indonesia) 6.49106oS 106.84891oE
centennial series of the aa index (Mayaud, 1972, 1973, 1975; Delouis and Mayaud, 1975) and ssc (Mayaud, 1975). They defined four classes: magnetic quiet activity, fluctuating ac-tivity, stream activity and shock activity.
They showed that the dipolar solar cycle, which controls the solar wind, is at the origin of 91.5% of the geomag-netic activity (maggeomag-netic quiet activity, fluctuating activity and stream activity). The sunspot solar cycle, which controls the EUV and UV radiations, generates only 8.5% of the geomag-netic activity (shock activity).
At the top of Fig. 1 we plotted the geometry of the field lines of the two solar cycles from Friedman (1986), the left panel corresponds to the dipolar solar field, the right panel to the torro¨ıdal solar field and the middle panel to the transition phase between the dipolar and torro¨ıdal solar fields.
2 Vietnamese network and data sets
Vietnam extends in geographic latitudes nearly from 8◦N
(magnetic equator) to 23.365◦N and in longitude from
102◦E to 110◦E. For many years the Institute of Geophysics
has maintained several networks of instruments. Figure 2 gives the location of the different stations involved in exter-nal geophysical measurements and Table 1a provides the ge-ographic coordinates of these stations. In Fig. 2, the atmo-spheric stations are quoted by red circles, the magnetometers by blue circles, the ionosonde located at Phu Thuy by a green square and the two meteorological radars at Hano¨ı and Ho Chi Minh City by black squares.
Since 2005, new instruments were brought to Vietnam:
– three GPS receivers are quoted by violet pentagons in
Fig. 1 (two given by the University of Rennes and one by the University of Brest),
– a mobile magnetotelluric station was given by IPGP.
In addition, one ionosonde (green square ) will be set up by the National Institute of Information and Communication technology (NICT) from Japan; at the end of the year at Ba-clieu a station located below the equatorial electrojet in the frame of the cooperation project between NICT and IGP.
Fig. 2. Map of the Vietnamese network: Ionosondes (green square),
GPS receivers (violet pentagone), Magnetometers (blue circles) and Atmospheric stations (red circles).
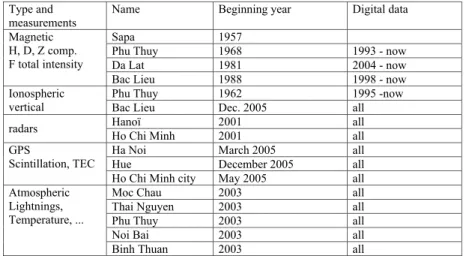
The Institute of Geophysics also maintains a network of 26 seismic stations which is not concerned by the present project. Table 2 gives the recorded physical parameters in each station and the data sets. In Table 2, the period of digi-tal records for each instrument is also noticed. We must men-tion here that another institute of Vietnam, the meteorolog-ical service, maintains 172 meteorologmeteorolog-ical stations, 14 sta-tions with solar radiasta-tions measurements, and 63 stasta-tions
3318 C. Amory-Mazaudier et al.: Sun-Earth System Interaction studies over Vietnam
Table 2. Physical parameters, data sets available, and period of digital records for each station.
Type and measurements
Name Beginning year Digital data
Sapa 1957
Phu Thuy 1968 1993 - now
Da Lat 1981 2004 - now
Magnetic H, D, Z comp. F total intensity
Bac Lieu 1988 1998 - now
Phu Thuy 1962 1995 -now
Ionospheric
vertical Bac Lieu Dec. 2005 all
Hanoï 2001 all
radars
Ho Chi Minh 2001 all
Ha Noi March 2005 all
Hue December 2005 all
GPS
Scintillation, TEC
Ho Chi Minh city May 2005 all
Moc Chau 2003 all
Thai Nguyen 2003 all
Phu Thuy 2003 all
Noi Bai 2003 all
Atmospheric Lightnings, Temperature, ...
Binh Thuan 2003 all
Fig. 3. Noon EEJ magnetic signature in August and September 2001 derived by CHAMP satellite measurements. This plot represents the
absolute values of the EEJ magnetic effects along the dip-equator (figure from Doumouya and Cohen, 2004).
with barometric pressure measurements. The oldest data are from 1940 and will be used for the scientific study of the at-mospheric boundary layer. The meteorological stations are listed in Table 1b.
3 Main morphological features of geophysical parame-ters in Vietnam
3.1 Earth’s magnetic field
During the International equatorial electrojet Year project, the IGRGEA group analysed the Equatorial Electrojet in the African sector and compared the African observations to the other longitude sectors. Doumouya and Cohen (2004)
ob-C. Amory-Mazaudier et al.: Sun-Earth System Interaction studies over Vietnam 3319
Fig. 4. Variations of the mean annual amplitude of the H component of the Earth’s magnetic field observed at Bac Lieu and Phu Thuy (top
panel) and latitudinal profiles of the mean annual value of the H component for the year 1996, the red profiles with circles are for the Indian network and blue profiles with crosses for the Vietnamese network (bottom panel).
Table 3. Geographic coordinates of the Indian magnetometer chain.
Geographic coordinates Observatories Longitude Latitude Sabhawala 77°48’E 30°22’N Ujjain 75°47’E 23°11’N Nagpur 79°05’E 21°09’N Alibag 72°52’E 18°37’N Visakhapatnam 83°19’E 17°41’N Hyderabad 78°33’E 17°25’N Pondicherry 79°55’E 11°55’N Kodaikanal 77°28’E 10°14’N Ettaiyapuram 78°01’E 09°10’N Trivandrum 76°58’E 08°29’N
served a strong amplitude of magnetic signature of the equa-torial electrojet over Vietnam. This result led to the compara-tive studies between the African and Asian sectors. Figure 3 from Doumouya and Cohen (2004) shows the intensity of the equatorial electrojet magnetic signature at noon. These observations are derived from the Champ satellite data. In this figure we clearly identify a strong intensity in the longi-tude sector 100◦and 110◦E. Vietnam is located nearly
be-tween geographic longitudes 102◦to 110◦E and geographic
latitudes 8.5◦to 23.4◦N. The magnetic equator is at the
geo-graphic latitude of 8◦N.
In the top panel of Fig. 4 the monthly mean diurnal am-plitudes are plotted of the horizontal H component of the Earth’s magnetic field measured at Bac Lieu (blue curve) and Phu Thuy (red curve). Bac Lieu is located below the magnetic equator and Phu Thuy at a geographic latitude of 21◦N. The strong amplitude observed at Bac Lieu is the
sig-nature of the equatorial electrojet. At Bac Lieu we observe a maximum of the amplitude of the H component in April. At Phu Thuy we observed two peaks in May and November. Due to missing data in Bac Lieu we cannot observe the sec-ond maximum expected. It is well known that geomagnetic activity exhibits a semi annual component but its maxima occur around equinoxes. In the present case, at Phu Thuy, the maxima occur in May and November. This delay of the maxima relative to geographic equinoxes needs more investi-gation, namely is it a specificity of the Vietnamese longitude sector?
In the bottom panel of Fig. 4 the annual mean diurnal amplitudes are plotted of the H component for the Viet-namese magnetic network in blue and for the Indian mag-netometers network in red, for the 1996 minimum solar ac-tivity period. Table 3 gives the geographic coordinates of the Indian magnetometers network. At equatorial latitudes
3320 C. Amory-Mazaudier et al.: Sun-Earth System Interaction studies over Vietnam
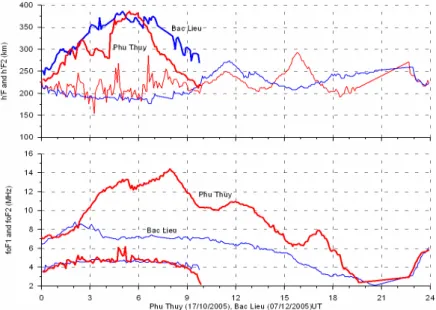
Fig. 5. Variations of the virtual heights and critical frequencies of the F1 and F2 layers for two different locations and two different days:
data from Bac Lieu at the magnetic equator (blue curves) on 7 December 2005 and data from Phu Thuy at tropical latitudes (red curves) on 10 October 2005. The top panel corresponds to the virtual heights and the bottom panel to the critical frequencies.
the amplitude of H component observed in Vietnam at the ground level is greater than the amplitude of the H compo-nent observed in India. These observations are in good agree-ment with the preceding satellite observations (Fig. 3). 3.2 Ionosphere
Figure 5 illustrates the variations of ionospheric parameters at Bac Lieu (blue curves) on 7 December 2005 and at Phu Thuy (red curves) on 17 October 2005. The top panel show the virtual heights of the F1 and F2 layers and the bottom panel the critical frequency of the F1 and F2 layers. In the top panel the variation of the virtual heights exhibit the same pattern for the two different days in the two different loca-tions. In the bottom panel the F1 critical frequency is the same at Bac Lieu and Phu Thuy, and the F2 critical frequency is greater at Phu Thuy. This panel illustrates the effect of the equatorial fountain: a trough of density at the magnetic equa-tor and two maxima of density at tropical latitudes 15◦N or
south from the equatorial equator.
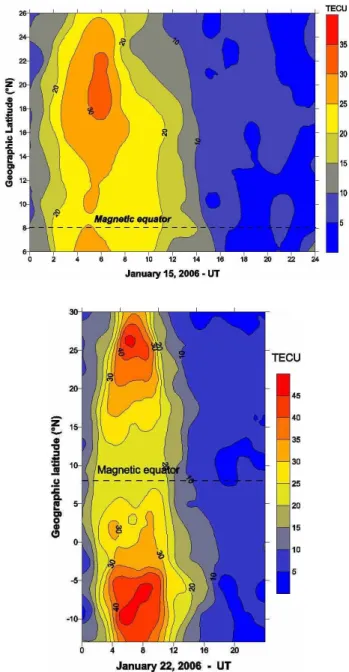
Figure 6, top panel, shows the amplitude of the total electron content (TEC), observed on 15 January 2006 in the northern hemisphere as a function of latitude (vertical axis) and UT time (horizontal axis), using the Vietnamese GPS data. We observe the dayside (yellow and orange colours) and the nightside (blue and grey colours). The north maximum crest occurs between 16◦ and 22◦N and around
06:00 UT (13:00 LT). Phu Thuy is at the latitude of 21◦N,
just below this maximum. The bottom panel is similar to the top panel but concerns the two hemispheres on 22 Jan-uary 2006 using the southeast GPS data (the three stations in
Vietnam and Kunm in China, Bako in Indonesia and Ntus in Singapore; Table 1c provides the geographic coordinates of some GPS stations). We clearly identify a very small TEC near the magnetic equator on the northern side and the two maxima in the two hemispheres. The magnetic equator is underlined by a dashed red line.
In Fig. 7 the ionospheric parameters are shown, derived from the ionograms of Phu Thuy during the four solar cy-cles 20, 21, 22, 23. From the top to the bottom of the figure the sunspot number, the critical frequencies of the F2, F1, E layers, the two frequencies for the Es layer (the critical fre-quency and the penetration frefre-quency) and the virtual heights of the F2, F1, E and Es layers are successively plotted. The critical frequencies of the F2, F1 and E layers exhibit an an-nual variation superimposed on the sunspot cycle variation. These results are well known (Chapman and Bartels, 1940). The Es layer exhibits only an annual pattern.
3.3 Meteorology and lightning
Vietnam, and more largely the Indochina peninsula, is a monsoon region of transition between a typical tropical cli-mate system (the south Asian monsoon) and a combined tropical-midlatitude system (the east Asian monsoon) (Chen and Chang, 1980; Zhang et al., 2002). The basic atmospheric features of the annual evolution over this country in link to precipitation is here succinctly presented using 2 basic atmo-spheric fields at regional scale: the wind speed at 925 hPa (Fig. 8) for documenting the low level monsoon flow and the precipitable water, to take into account air moisture in the atmospheric column (Fig. 9). These data are provided
C. Amory-Mazaudier et al.: Sun-Earth System Interaction studies over Vietnam 3321 from NCEP/DOE AMIP-II Reanalysis (R-2) over the period
1979–2004: R-2 improves upon the NCEP/NCAR Reanaly-sis (R-1) by fixing the errors and by updating the parameter-izations of the physical processes.
Figures 8, 9 show that Vietnam registers two contrasted wind regimes: a northeast monsoon from October to April during the hemispheric winter and a southwest monsoon from April to September, peaking in northern summer. The former period is marked by low-level winds blowing south-westward while atmospheric moisture is rather low due to cold temperatures. Notice also that in January–March low level winds are diffluent by 15–17◦N: they split into two
main branches towards north and south, which generates di-vergence. As a result, precipitation tends to concentrate near the eastern coast. After April, however, the circulation in low levels changes drastically: a northeastward migration of the southwestern humid winds blowing from the Indian Ocean takes place (the southwest monsoon), associated with a gen-eral air moisture increase over the peninsula, peaking in July-September and favouring rainfall over the whole country.
In order to better detail the impact on precipitation, a clus-tering algorithm (K-means) is applied on more than 40 se-lected series from the precipitation Vietnam network over the period 1960–2000, to separate 6 types of space/time variabil-ity (i.e. 6 classes of stations showing coherent rainfall vari-ability in space and time (annual cycles, inter-monthly and interannual variability). K-means clustering is an algorithm to classify objects (here, in-situ stations) based on K num-ber of groups, by minimizing the sum of squares of the dis-tances between data and the corresponding cluster centroid. Here the clustering algorithm is repeated 1000 times with a new set of initial centroids to assess robustness. This allows us to separate the most robust signals from those occurring possibly by chance or if it is too noisy. Several K num-bers (4 to 8 classes) have been tried and we report only on those with K=6, which can be estimated as the most efficient choice with respect to the length of the series and network (∼40 years and stations).
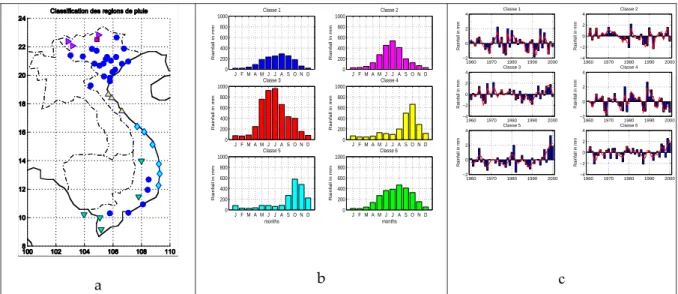
Figure 10 displays the location of the stations (Fig. 10a), along with mean annual evolutions (Fig. 10b) and interan-nual variability (Fig. 10c). Class 1 (blue) is clearly the most representative, with numerous stations north of 19◦N and a
few ones south of 13◦N (Dalat, Buon Me thuat, Phan Thiet,
Vung Tau et Can Tho). It shows that large regions of Viet-nam register one rainy season starting in May and peaking in August (∼250 mm), in close association with the southwest monsoon flow (Fig. 8c). Over these areas mean annual rain-fall ranges between 1500–1700 mm (mean = 1650 mm/year, standard deviation = 200 mm) and do not show any long-term trend. Figure 3c shows, however, some multi-year fluctua-tions presenting a significant quasi-biennal signal at 2.4 years when a spectral analysis of the series is performed.
The other classes of variability (classes 2–6) can be viewed as regional alterations of the previous scheme. Classes 2–3 (pink and red) refer to the highlands north of the Red River
Fig. 6. Total electron content derived from GPS stations. The top
panel corresponds to the observations above Vietnam on 15 January 2006 and the bottom panel to the Asian sector on 22 Januray 2006.
Delta, with class 3 being composed of only one station (Bac Quang). These northern regions register higher rain-fall amounts than elsewhere in Vietnam: more than 500 and 900 mm in July, and 2340 mm and 4850 mm for the respec-tive annual amounts. Interannual variability does not ex-hibit any significant signal but just a concentration of energy around 3.1 years.
By contrast the coastal stations between 12◦N and 19◦N
(classes 4 and 5 in yellow and light blue, respectively) have very similar annual cycles marked by a rainfall peak centred in October (about 600 mm). These widespread heavy rains
3322 C. Amory-Mazaudier et al.: Sun-Earth System Interaction studies over Vietnam 0 50 100 150 200 S uns p o t ( R ) 60 80 100 120 140 fo F [0 .1 M H z] 30 45 60 75 fo F [0 .1 M H z] 200 250 300 350 fo E [0 .0 1 M H z] 1 2 20 30 40 50 fo E s ( 0 .1 M H z) 20 30 40 fb E s (0 .1 M H z) 200 300 400 h' F [ k m ] 200 250 300 h' F [ k m ] 80 100 120 h' E [k m ] 1960 1965 1970 1975 1980 1985 1990 1995 2000 2005 Year 80 100 120 h' E s [ k m ] 2
Fig. 7. Ionospheric parameters recorded at Phu Thuy during four solar cycles, from the top to the bottom, the curves are as follows: the
sunspot number, the critical frequencies of the F2, F1, E and Es layers and the virtual heights of the F2, F1, E, and Es layers.
are associated with a greater occurrence of synoptic systems, such as thyphoons and tropical depressions, often combining with cold air advections (Dao and Nguyen, 2003), at the be-ginning of the northeast monsoon season (Fig. 8a). Lower amounts occur during the summer monsoon: this is due to the protection of mountains located south and west of these coastal lowlands: the middle part of Vietnam is on the eastern side of the Truong Son high mountain ridge. Annual amounts are important (2340 mm and 2060 mm for classes 4 and 5, spectively). Notice, however, that these two regions differ re-garding the interannual variability with a negative (positive) trend over the most recent period for region 4 (region 5). No significant quasi-biennal cycle is detected by spectral analy-ses.
Class 6 describes the southernmost region and records a wet season from May to November (more than 400 mm in August and 2680 mm/year), with short-lived but heavy rain-fall of convective origin. The interannual variability is also marked by a positive trend in recent years with a slight but not significant concentration of variance around 2.4 years.
Figure 11 represents the global distribution of total light-ning flash density observed by the LIS, from January 1998 to December 2004, above the Vietnam territory with the grid 0.25◦
×0.25◦. Data provided by the NASA Lightning
Imaging Sensor (LIS) instrument team and the LIS data cen-ter via the Global Hydrology Resource Cencen-ter (GHRC), lo-cated at the Global Hydrology and Climate Center (GHCC), Huntsville, Alabama. Vietnam is one of the countries most influenced by lightning. In Fig. 11 we observe some areas of strong lightning in the north and south of the country. In
C. Amory-Mazaudier et al.: Sun-Earth System Interaction studies over Vietnam 3323
a) Mean wind at 925hPa in JFM
96oE 104oE 112oE 120oE 128oE 0o 6oN 12oN 18oN 24oN 30oN
b) Mean wind at 925hPa in AMJ
96oE 104oE 112oE 120oE 128oE 0o 6oN 12oN 18oN 24oN 30oN
c) Mean wind at 925hPa in JAS
96oE 104oE 112oE 120oE 128oE 0o 6oN 12oN 18oN 24oN 30oN
d) Mean wind at 925hPa in OND
96oE 104oE 112oE 120oE 128oE 0o 6oN 12oN 18oN 24oN 30oN
Fig. 8. Mean annual evolution of wind at 925 hPa: JFM: January to March; AMJ: April to June; JAS: July to September; OND: October to
December. Period 1979–2004.
a) Mean Precipitable Water in JFM
4 6 8 101214 16 18 2022 2426 28 30 32 34 36 38 40 42 44 46 46 48 48
b) Mean Precipitable Water in AMJ
50 96oE 104oE 112oE 120oE 128oE 0o 6oN 12oN 18oN 24oN 30oN 810 121416 1820 2224 2628 30 3234 36 36 38 40 42 44 44 46 46 48 50 50 50 96oE 104oE 112oE 120oE 128oE 0o 6oN 12oN 18oN 24oN 30oN
c) Mean Precipitable Water in JAS d) Mean Precipitable Water in OND
14 161820222426 2830 3234 363840 4244 44 46 46 48 48 48 48 50 50 52 52 54 56 56 96oE 104oE 112oE 120oE 128oE 0o 6oN 12oN 18oN 24oN 30oN 4 6 8 1012 1416 1820 22 24 26 28 3032 34 36 38 40 42 44 44 46 46 46 48 50 50 52 96oE 104oE 112oE 120oE 128oE 0o 6oN 12oN 18oN 24oN 30oN
Fig. 9. Mean annual evolution of precipitable water (g/m2) by season. Solid (dashed) lines in red (blue) for values higher (lower) than 50 g/m2. Period 1979–2004.
3324 C. Amory-Mazaudier et al.: Sun-Earth System Interaction studies over Vietnam 100 102 104 106 108 110 8 10 12 14 16 18 20 22 24
Classification des regions de pluie
a J F M A M J J A S O N D 0 200 400 600 800 1000 Rainfall in mm Classe 1 J F M A M J J A S O N D 0 200 400 600 800 1000 Rainfall in mm Classe 2 J F M A M J J A S O N D 0 200 400 600 800 1000 Rainfall in mm Classe 3 J F M A M J J A S O N D 0 200 400 600 800 1000 Rainfall in mm Classe 4 J F M A M J J A S O N D 0 200 400 600 800 1000 Rainfall in mm months Classe 5 J F M A M J J A S O N D 0 200 400 600 800 1000 Rainfall in mm months Classe 6 b 1960 1970 1980 1990 2000 −2 0 2 4 Rainfall in mm Classe 1 1960 1970 1980 1990 2000 −4 −2 0 2 4 Rainfall in mm Classe 2 1960 1970 1980 1990 2000 −4 −2 0 2 4 Rainfall in mm Classe 3 1960 1970 1980 1990 2000 −2 0 2 4 Rainfall in mm Classe 4 1960 1970 1980 1990 2000 −2 0 2 4 Rainfall in mm Classe 5 1960 1970 1980 1990 2000 −4 −2 0 2 4 Rainfall in mm Classe 6 c
Fig. 10. Rainfall above Vietnam (∼40 rain gauges) over the period 1960–2000: (a) the 6 classes of in-situ stations using K-means clustering; (b) mean annual evolutions (monthly rainfall in mm) by class; (c) annual rainfall amounts (bars) and filtered signal (curves) by class. Period
1960–2000.
Fig. 11. The global distribution of total lightning flash density
observed by the LIS (January 1998–December 2004) above Viet-nam territory with the grid 0.25◦×0.25◦. The data available from
the GHRC are restricted to LIS science team collaborators and to NASA EOS and TRMM investigators.
the north Vietnam at the latitude around 22◦N and longitude
105◦E, the strongest lightning area is also the place with the
maximum rainfall (see Fig. 10 red square).
3.4 Comparison between different longitude sectors Figure 12 presents the total electron content maps for the Asian and the American sectors during the magnetic storm of 24 August 2005. At the present time, it is not possible to present a comparison with the African sector, due to a lack of data, but for the future it will be possible, as the international community is planning the installation of GPS stations and magnetometers in Africa in the frame of two international projects, IHY and CAWSES.
Figure 12a presents the total electron content in the Asian sector and Fig. 12b in the American sector. In this figure we point out the magnetic equator the sudden Storm Commence-ment (SSC) and the storm recovery phase which occurs just after the main phase of the storm. The two dashed lines de-limit the main phase of the storm. The main phase of the storm occurs at different local times in each sector and this fact explains a part of the discrepancies in the response to the storm between the Asian and American sectors (Le Huy and Amory-Mazaudier, 2005). We observe a strong difference between the Asian and American sectors. The total electron content amplitude is stronger in the Asian sector, where the two crests exhibit rather the same amplitudes, except on the last day of the period, on 28 August 2005. In Fig. 12a, in the Asian sector the storm starts during the daytime, and we can identify an increase in the TEC at the equator (yellow tongues) just before the beginning of the recovery phase of the storm. On the day after the storm we observe a decrease
C. Amory-Mazaudier et al.: Sun-Earth System Interaction studies over Vietnam 3325 b
Fig. 12. Maps of total electron content (TEC) in the Asian sector (top panel) and the American sector (bottom panel) during the storm of
24 August 2005. Two vertical dashed lines underline the sudden storm commencement and the beginning of the recovery phase of the storm.
in the amplitude of the total electron density due to the storm dynamo wind effect. In Fig. 12b, in the American sector the asymmetry between the two hemispheres is stronger than in the Asian sector. The southern crest exhibits the strongest amplitude on 24 August 2005, the storm day. On the day after the storm the northern crest amplitude in the American sector decreases, as in the Asian sector one. But one can ob-serve that on 23 August, the day before the storm the northern crest amplitude in the American sector is very small, and on 28 August, four days after the storm the northern crest ampli-tude in the Asian sector is also very small. It seems necessary to analyse large data sets to understand the day-to-day vari-ability of the total electron content in term of solar radiations and solar wind sources.
4 Conclusions
In this paper we present the main morphological features of the Vietname concerning the Earth’s magnetic field, the ionosphere, meteorology and lightning. The strong
ampli-tude of the Earth’s magnetic field at the equator, observed at high altitudes with the CHAMP satellite, is also observed at ground level. The amplitude of the Earth’s magnetic field is stronger in the Vietnamese longitude than in the Indian one; this regional observation is not yet explained. The Viet-name, which covers tropical and equatorial latitudes, exhibits the ionospheric well-known pattern: the electronic densities have maxima in North Vietnam (+15◦N magnetic) and
min-ima at the equator, with these features being related to the equatorial fountain process.
In Vietnam the monsoon and lightning are intense. The monsoon has mainly one rainy season, peaking in August and associated with a southwest monsoon flow. But some vari-abilites of the monsoon are observed in the northern moun-tainous regions of Vietman and near the coasts. In North Vietnam (latitude 22◦N, longitude 105◦E), and South
Viet-nam (latitude 11◦N, longitude 107◦E), there are two regions
of very intense lightning, the north one is associated with the strongest precipitation rate observed in Vietnam.
3326 C. Amory-Mazaudier et al.: Sun-Earth System Interaction studies over Vietnam For the next year, due to the deployment of GPS stations
and magnetometers in Africa (in the frame of the CAWSES and IHY programs), the difference between the Vietnamese geophysical environment and the African one must be ex-plained in terms of the global planetary pattern of the Earth’s magnetic field, ionosphere, and atmosphere. Such studies were not feasible in the past. They are now becoming possi-ble, and the Vietnamese results become an important contri-bution to understanding the global environment.
Acknowledgements. The authors acknowledge the following insti-tutions: the French foreign Ministry and the Centre National de la Recherche Scientifique for funding four students scholarships, the Institute of Geophysics and the Vietnamese Academy of Sciences for funding 8 positions for young scientist to work in this project, the French Universities of Brest and Rennes for providing a GPS network, the National Institute of Information and Communication technology (NICT) of Japan for providing an ionosonde at Baclieu, the Indian Institute of Geomagnetism for the Indian geomagnetic data, and R. Gendrin, President of IAGA (International Association for Geomagnetism and Aeronomy) from 1987 to 1991, for his gift of 130 scientific books to the library of the Hano¨ı Institute of Geo-physiscs.
Topical Editor M. Pinnock thanks two referees for their help in evaluating this paper.
References
Amory-Mazaudier C.: Contribution `a l’´etude des courants ´electriques, des champs ´electriques et des vents neutres ionosph´eriques de moyennes latitudes, variation r´eguli`ere et vari-ations perturb´ees. Etudes de cas `a partir des observvari-ations du sondeur `a diffusion incoh´erente de Saint-Santin en relation avec les observations du champ g´eomagn´etique terrestre, Volume 1 – synth`ese / Volume 2 – Articles / Volume 3 – Annexes Techniques, Th`ese de Doctorat d’Etat, Paris VI, 1983.
Amory-Mazaudier, C.: Kobea, A., Vila, P., Achy-S´eka, A., Blanc, E., Boka, K., Bouvet, J., C´ecile, J.-F., Cohen, Y., Curto, J.-J., Dukhan, M., Doumouya, V., Fambitakoye, O., Farges, T., Goute-lard, C., Guisso, E., Hanbaba, R., Houngninou, E., Kone, E., Lassudrie-Duchesne, P., Leroux, Y., Menvielle, M., Obrou, O., Petitdidier, M., Ogunade, S.-O., Onwumechili, C.-A., Rees, D., Sambou, E., Sow, M., Vassal, J., and Lathuillere, C.: On Equa-torial geophysics studies: The IGRGEA results during the last decade, J. Atmos. S.-P., 67(4), 301–313, 2005.
Axford, W. I. and Hines, C. O.: A unifying theory of high latitudes geophysical phenomena and geomagnetic storms, Can. J. Phys., 39, 1433–1464, 1961.
Blanc, M. and Richmond, A.: The Ionospheric disturbance dynamo, J. Geophys. Res., 85, 1669–1686, 1980.
Chapman, S. and Bartels, J.: Geomagnetism, Oxford University Press New York, 1940.
Chapman, S. and Lindzen, R. S.: Atmospheric tides, D. Reidel pub-lishing company, Dordrecht-Holland, 1970.
Chen, T. C. and Chang, C. P.: Structure and vorticity budget of early summer monsoon trough (Mei-Yu) over southeastern China and Japan, Mon. Wea. Rev., 108, 942–953, 1980.
Dao, T. L. and Nguyen, T. T. T.: Evaluating the role of weather sit-uations, generating heavy and wide spread rainfall in the central and south regions for now casting weather using weather radar information, Journal of Hydrography-Meteorology, Vietnam, 7, 33–41, 2003.
Delouis, H. and Mayaud, P.-N.: Spectral analysis of the geomag-netic activity index aa over a 103-year interval, J. Geophys. Res., 80(34), 4681–4688, 1975.
Doumouya, V. and Cohen, Y.: Improving and testing the empiri-cal equatorial electrojet model with CHAMP satellite data, Ann. Geophys., 22, 3323–3333, 2004,
http://www.ann-geophys.net/22/3323/2004/.
Dungey, T. W.: Interplanetary magnetic field and the auroral zones, Phys. Rev. Lett., 6, 47–48, 1961.
Friedman, H.: Sun and Earth, Scientific American Library, 1986. Fukao, S., Hashiguchi, H., Yamamoti, M., Tsuda, T., Nakamura,
T., and Yamamoto, M. K.: Equarorial Atmosphere radar (EAR): System description and first results, Radio Science, 38(3), 1053– 1066, 2003.
Gurubaran, S., Rajaram, R., Nakamura, T. and Tsuda, T.: Interan-nual variability of diurnal tide in the tropical region: A signature of El Nino-Southern Ocscillation (ENSO), Geophys. Res. Lett., 32, L13805, doi:10.1029/2005GL022928, 2005.
Hagan, M. E. and Forbes, J. M.: Migrating and nonmigrating diur-nal tides in the middle and upper atmopshere excited by tropo-spheric latent heat release, J. Geophys. Res., 107(D24), 4754– 4764, 2002.
Kanamitsu, M., Ebisuzaki, W., Woolen, J., Yarg, S. K., Hnilo, J.-J., Fiorino, M., and Potter, G. L.: NCEP-DOE AMIP-II reanalysis (R-2), Bulletin of American Meteorological Society, 83, 1631– 1643, 2002.
Kob´ea, A. ., Richmond, A. D., Emery, B. A., Peymirat, C., L¨uhr, H., Moretto, T., Hairston, M., and Amory-Mazaudier, C.: Elec-trodynamic Coupling of High and Low Latitudes Observations on May 27, 1993, 105(A10), 22 979–22 989, 2000.
Legrand, J. P. and Simon, P. A.: Solar Cycle and geomagnetic ac-tivity: A review for geophysicists, Part I, The contributions to geomagnetic activity of shock waves and of the solar wind, Ann. Geophys., 7, 565–578, 1989,
http://www.ann-geophys.net/7/565/1989/.
Le Huy, M.: Diurnal geomagnetic variation in Vietnam and counter-electrojet, J. Sciences of the Earth, NCST of Vietnam, 20(3), 189–199, 1998.
Le Huy, M.: Sudden commencements of magnetic storms observed in Vietnam and in India, J. Sciences of the Earth, NCST of Viet-nam, 21(1), 14–25, 1999.
Le Huy, M. and Pham Van, T.: Time variation of the E and F layers at Phu Thuy, Vietnam, J. Sciences of the Earth, NCST of Viet-nam, 23(1), 56–59, 2001.
Le Huy, M. and Amory-Mazaudier, C.: Magnetic signature of the Ionospheric disturbance dynamo at equatorial latitudes: “Ddyn”, J. Geophys. Res., 10, 10 301–10 314, 2005.
Maurer, E. P., O’Donnell, G. M., and Lettenmaie, D. P.: Evalu-ation of the Land Surface Water Budget in NCEP/NCAR and NCEP/DOE Reanalyses using an Off-line Hydrologic Model, J. Geophys. Res., 106(D16), 17 841–17 862, 2002.
Mayaud, P. N.: Analyse morphologique de la variabilit´e jour-`a-jour de la variation journali`ere r´eguli`ere SR du champ magn´etique
sub-C. Amory-Mazaudier et al.: Sun-Earth System Interaction studies over Vietnam 3327
polaires), Ann. G´eophys., 21, 369–401, 1965a.
Mayaud, P. N.:Analyse morphologique de la variabilit´e jour-`a-jour de la variation journali`eres r´eguli`ere SR du champ magn´etique
terrestre, II – le syst`eme de courants CM(r´egions non-polaires),
Ann. G´eophys., 514–544, 1965b.
Mayaud, P. N.: The aa indices: a 100-year series characterizing the magnetic activity, J. Geophys. Res., 77, 34, 6870, 6874, 1972. Mayaud, P. N.: A hundred series of Geomagnetic data 1868–
1967, indices aa, Storm sudden commencements, AIGA Bulletin n ˚ 33, IUGG Publication Office, 252, 1973.
Mayaud, P. N.: Analysis of storm sudden commencements (S.S.C.) for the years 1868–1967, J. Geophys. Res., 80, n ˚ 1, 111–122, 1975.
Mazaudier C. and Venkateswaran, S. V.: Delayed ionospheric ef-fects of March 22, 1979 studied by the sixth Coordinated Data Analysis Workshop (CDAW-6), Ann. Geophys., 8, 511–518, 1990,
http://www.ann-geophys.net/8/511/1990/.
Mazaudier, C., Achache, J., Achy-S´eka, A., Albouy, Y., Blanc, E., Boka, K., Bouvet, J., Cohen, Y., Diatta, C.-S., Doumouya, V., Fambitakoye, O., Gendrin, R., Goutelard, C., Hamoudi, M., Han-baba, R., Hougninou, E., Huc, E., C., Kakou, K., Kobea Toka, A., Lassudrie-Duchˆene, P., Mbipom, E., Menvielle, M., Ogu-nade, S.-O., Olinloye, J.-O., Rees, D., Richmond, A., Sambou, E., Schmucker, E., Tireford, J.-L., Vassal, J., and Vila, P.: In-ternational Equatorial Electrojet Year, Brazilian Journal of Geo-physics, 11(3), 303–317 (special issue), 1993.
Nishida, A.: Coherence of geomagnetic DP2 fluctuations with inter-planetary magnetic variations, J. Geophys. Res., 73, 5549–5559, 1968.
Nishida, A., Iwasaki, T., and Nagata, T.: The origin of fuctuations in the equatorial electrojet: a new type of geomagnetic variation, Ann. Geophys., 22, 478–484, 1966,
http://www.ann-geophys.net/22/478/1966/.
Petitdidier, M. and Laroche, P.: Lightning observations with the Strato-Tropospheric UHF and VHF radars at Arecibo, Puerto Rico, Atmos. Res., 76, 481–492, 2005.
Richard, P., Delannoy, A., Labaune, G., and Laroche, P.: Results of spatial and temporal characterization of the VHF-UHF radiation of lightning, J. Geophys. Res., 91, 1248–1260, 1986.
Simon, P. A. and Legrand, J.-P.: Solar Cycle and geomagnetic ac-tivity: A review for geophysicists, Part II, The solar sources of geomagnetic activity and their links with sunspot cycle activity, Ann. Geophys., 7, 579–594, 1989,
http://www.ann-geophys.net/7/579/1989/.
Stewart, B.: Terrestrial magnetism, Encyclopedia Britannica, 9th ed., 16, 159–184, 1882.
Truong Quang, H., and Le Huy Minh, M.: Some characteristics of the geomagnetic variations in Vietnam, J. Sciences of the Earth, NCST of Vietnam, 9(1), 7–13, 1987.
Vasyliunas, V. H.: Mathematical Model of magnetospheric pro-cesses and its coupling to the ionosphere, in: Particles and Fields in the magnetosphere, edited by: Mc Cormac, B. M., D. Reidel, Dordrecht, Holland, 60–71, 1970.
Zhang, Y., Li, T., Wang, B., and Wu, G.: Onset of the Summer Monsoon over the Indochine Peninsula: climatology and Inter-annual variations, Journal of Climate, 15,22, 3206–3221, 2002.