OATAO is an open access repository that collects the work of Toulouse
researchers and makes it freely available over the web where possible
Any correspondence concerning this service should be sent
to the repository administrator:
[email protected]
This is an author’s version published in: http://oatao.univ-toulouse.fr/ 26578
To cite this version:
Seville, Jonathan and Deng, Yimin and Dawn Bell, Sarah and Dewil, Raf and
Appels, Lise and Ansart, Renaud
and Leadbeater, Tom and Parker, David
and Zhang, Huili and Ingram, Andrew and Baeyens, Jan 11CO2 positron
emission imaging reveals the in-situ gas concentration profile as function of
time and position in opaque gas-solid contacting systems. (2020) Chemical
Engineering Journal, 404. ISSN 1385-8947
Official URL :
https://doi.org/10.1016/j.cej.2020.126507
11
CO
2
positron emission imaging reveals the in-situ gas concentration pro
file
as function of time and position in opaque gas-solid contacting systems
Jonathan Peter Kyle Seville
a,1, Yimin Deng
b,e,1, Sarah Dawn Bell
a, Raf Dewil
b, Lise Appels
b,
Renaud Ansart
c, Tom Leadbeater
d, David Parker
a, Huili Zhang
e, Andrew Ingram
a,⁎,
Jan Baeyens
e,⁎aSchool of Chemical Engineering, University of Birmingham, Birmingham B15 2TT, United Kingdom
bKU Leuven, Department of Chemical Engineering, Process and Environmental Technology Lab, 2860 Sint-Katelijne-Waver, Belgium cLaboratoire de Génie Chimique, Université de Toulouse, CNRS, INPT, UPS, Toulouse, France
dUniversity of Cape Town, Department of Physics, Cape Town, South Africa
eBeijing University of Chemical Technology, Beijing Advanced Innovation Centre of Soft Matter Science and Engineering, Beijing, Chaoyang District, 100029, China
The in situ analysis of industrial processes, mostly conducted in opaque equipment is difficult. Whereas pre-viously the positron emission technique was successfully applied to study theflow and mixing in gas–solid and liquid–solid systems using radio-active tracer particles, research on imaging a radio- active tracer gas is scarce. The present paper demonstrates the use of a fully three-dimensional (3D) Positron Emission Tomography (PET) in imaging the adsorption of11CO
2tracer gas, while validating the measurement by conventional exit gas analysis. It will be demonstrated that PET can be used to measure the kinetics of high-pressure CO2adsorption in situ, including the essential breakthrough and mass transfer zone characteristics. Such high-pressure operation is characteristic of pre-combustion CO2capturing processes. It is expected that this work will foster further studies of gas–solid systems of adsorption, gas–solid catalysis, gas–solid hydrodynamics, and processes where the gas–solid interaction is of primary importance.
1. Introduction
Gas-solid contacting systems are widely used in the process in-dustries, with gas-catalytic reactors and gas–solid adsorbers as im-portant examples. Fixed-bed gas-catalytic reactors are often the first choice for the economical production of large amounts of products. The selective adsorption of gaseous components from a gas mixture is widely applied in air pollution control andfinds increasing application in CO2capture from combustion exhausts.
The complete understanding, design and operation of these
heterogeneous processes however requires quantitative in situ data on the concentration of the target gas molecules, present as reactant or adsorbed gas) on the surface of the catalyst or adsorbent, respectively. Since the processes are commonly conducted in opaque vessels and generally at high temperatures and/or pressures, such processes are usually monitored only by measurement techniques on the process exit streams, hence providing no information on the evolution of the gas concentrations with time and position inside the gas–solid reactor or adsorber. Yet these detailed data are important to study intrinsic ki-netics and transport phenomena, moreover required as input to
⁎Corresponding authors.
E-mail addresses:[email protected](A. Ingram),[email protected](J. Baeyens). 1Considered as equal principal authors.
https://doi.org/10.1016/j.cej.2020.126507
mathematical simulations of the processes under scrutiny. The devel-opment of monitoring techniques to provide in situ data from actual operations is required, and the use of radioactive labeled molecules was investigated for that purpose in the present research.
In the diagnosis and treatment of many diseases [1], functional radio-active tracer medical imaging is used to study physiological processes within the human body. Such clinical imaging can be adapted for industrial use, where process equipment is also of opaque nature and in situ analysis of processes is difficult. The Positron Imaging Centre (PIC) of the University of Birmingham uses positron emission[2–4]to study theflow and mixing in gas–solid and liquid–solid systems using radio-active tracer particles[5–12]. Research on the imaging of radio-active tracer gas is scarce. Such a technique enables non-intrusive ob-servation of processes involving gases and thereby helps in under-standing industrial operations such as sorption and reaction. Positron Emission Tomography (PET) has been applied to a limited extent, in fluidised beds[13,14], in studying thefluid flow within porous rock
[15], and to analyse surface catalysis in car exhaust systems[16]. The objectives and novelty of the present research aim at devel-oping and demonstrating the use of a fully three-dimensional (3D) PET applied to imaging of adsorption of11CO
2 tracer gas, validating the
measurement by conventional exit gas analysis. Physical adsorption is a dynamic but relatively slow (mm/min)[17]process, and hence within the resolution of the PET technique. By PET-imaging of the dynamics of CO2adsorption, the study aimed at (i) proving the application of 3D
PET to dynamic systems in opaque equipment; (ii) validating PET re-sults against CO2concentration measurements at the discharge from the
column; while (iii) also measuring time-dependent properties of the adsorption. Neither the progress of the adsorption front along the bed length nor the evolution of the Mass Transfer Zone (MTZ) can be de-termined using the outflow CO2concentrations only, but both can be
clearly determined by in-situ PET imaging. Such high-pressure opera-tion is characteristic of pre-combusopera-tion CO2capturing processes. It also
expands the single previous one-dimensional application[16]to a fully
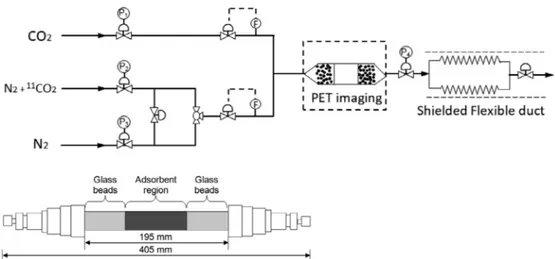
Fig. 1. Experimental set-up and detail of the adsorption column with adsorbent bed and glass beads packing (Pi: pressure control valves, F: massflow rate mea-surements).
Fig. 2. Illustration of the11CO
2profiles from inflow to outflow in the Zeolite 13X packed bed for 11 consecutive image frames, each containing data acquired over 45 s[13].Images are given in pixel-colour (left) or in intensity (counts per minute, cpm) data (right).
3D imaging. To achieve these aims,11CO2gas was used to demonstrate
and validate the PET concept and to study gas–solid adsorption. We anticipate our work to foster further studies of gas–solid systems of adsorption, gas–solid catalysis, gas–solid hydrodynamics, and processes where the gas–solid interaction is of primary importance.
2. PET principles
As a non-invasive imaging technique, PET can provide 3D tomo-graphy images in real-time of a radio-active tracer distribution and give quantitative information on both position and concentration. Positron emission particle tracking was previously and successfully applied when using a particle-labelled tracer, in various liquid–solid[8–12,18]
and gas–solid applications[5,6,19–22]. Many reactant molecules can be labelled with short half-life time (t0.5) positron-emitting nuclides of
carbon (11C, t
0.5= 20.4 min), nitrogen (13N, 9.96 min) and oxygen
(15O, 2.07 min). These short t0.5values are advantageous from the point
of view of safety and ease of use but imply that PET experiments and the radionuclide production facility (a cyclotron in the present case) must be physically close. Experiments only require very small amounts of labelled molecules (~10-13to 10-12mol) since such nuclides have a
high initial specific activity. Each positron emitted during the decay of the radioisotope annihilates with an electron[3], and produces 2 back-to-back (collinear) high-energy (511KeV) gamma rays. The PET camera detects theγ-rays, allowing absolute positron-emitter concentrations to be determined, thus providing‘images’ of interactions as a function of time and location. In standard medical PET imaging, data are gathered and presented in 2D planes. For complete 3D PET[2], scanners with retractable septa can acquire coincidences between all possible pairs of detectors, resulting in full 3D imaging, which is becoming more widely used in medical applications. Principles and important characteristics of the PET systems are given inSupplementary InformationSI-A.
The intrinsic spatial resolution of PET imaging systems is related to geometry, specifically the centre separation of individual detector blocks. In the camera used in this study (Field of View, FOV: axial = c160mm; trans-axial = c400mm) the manufacturer’s stated
resolution is 6 mm, close to the axis. Calibration tests of this camera with single and multiple point sources showed peaks with Full-Width at Half Maximum (FWHM) circa 10 mm and a peak resolution of 1 mm (see SI-A). In practice, the resolution achieved depends on tracer ac-tivity (limited by the saturation capacity of the detection system) and the duration of acquisition per measurement. In dynamic systems, the balance struck between spatial and temporal resolution will also de-pend on the rate of passage of the tracer. Blurring of the adsorption front is inherent in the technique but we have shown that with the front moving at between 0.8 and 5.4 mm/minute the data acquisition time of 45 s enables us to capture the breakthrough curve with reasonable accuracy, as shown further in the text (seeFig. 4for examples) and we would expect the same accuracy for adsorption profiles within the bed. 3. Experimental set-up and procedures
Physical adsorption is a dynamic but relatively slow (mm/min)[17]
process, and hence within the resolution of the PET technique. In-situ PET-imaging of the dynamics of CO2adsorption could determine the
progress of the adsorption front along the bed length and the evolution of the Mass Transfer Zone (MTZ), which cannot be determined using the outflow CO2concentrations only. The11CO2tracer is produced on
site by a cyclotron, as explained further below. 3.1. Experimental set-up
A stainless steel adsorption column (19 mm I.D., 22 mm O.D.) (Fig. 1) was packed in its centre with an adsorbent to a maximum layer length of 195 mm but mostly limited to an adsorbent bed length be-tween 70 and 90 mm for the experiments. At each end of the adsorbent bed, 3 mm glass beads were inserted between steel mesh to position the adsorption bed and uniformly distribute the gasflow. The full set-up was located within the Field of View (FoV) of the PET camera. The gas exhaust was to aflexible duct which was shielded and able to contain the11CO
2-loaded exhaust. The imaging system was confined in a lead
enclosure.
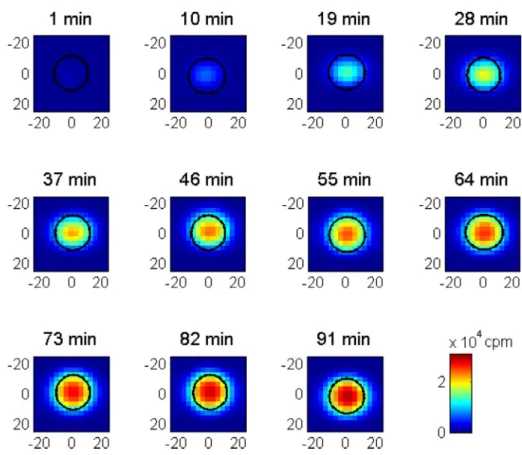
Fig. 3. Illustration of cross-sectional concentration profiles in a plane, in the middle of the adsorbent bed for Zeolite 13X at 1.6 MPa and Cmax= 10% at nine minute intervals.11CO2was initially detected in the plane at time = 1 min. Thefinal image is the time when the plane reaches its maximum intensity, corresponding to its saturation[13].
The CO2and N2(or11CO2- N2) feedflow rates were set by two mass
flow controllers (maximum 100 and 400 Nml/min, respectively, and able to withstand to a pressure of maximum 10 MPa). The operating system pressure was set by a backpressure regulator P4, operated up to
2.6 MPa at 19 °C. The feedflow was also equipped with pressure gauges and regulators (P1, P2and P3). A Servomex 5200 was used to measure
CO2concentrations at the discharge from the column, with an accuracy
of ± 0.1 vol% CO2.
3.2. Parameters and materials
The positron (β+) emitting isotope,11C (t
0.5= 20.5 min) can be
used for PET imaging. Its production involved bombarding Nitrogen-14 atoms with protons in a cyclotron[13]. Upon collision of a proton with
a nitrogen atom, the proton energy can cause the release of an alpha particle, hence giving rise to the14N(p,α)11C reaction. If minor amounts
of oxygen are mixed with the nitrogen gas target,11CO2is produced.
Chemically,11CO2and CO2behave in an identical manner. The PET test
gas is predominantly N2containing minor amounts (vol-ppb) of11CO2.
PET experiments lasted two hours at a rate of one frame/ 45 sec. Flow rates and concentrations of CO2-11CO2applied are given in the
experimental procedure below.
Further to an objective multi-criteria assessment, as described in
Supplementary Information SI-B, both Zeolite 13X beads (Sigma Al-drich, USA) of average diameter 3 mm, pore diameter 0.1 nm and surface area 750 m2/g, and Activated Carbon pellets (Brownell's, UK) of average diameter 6.5 mm, pore diameter < 50 nm and surface area 800–1200 m2/g were the selected adsorbents for the research.
Fig. 4. Breakthrough curves from PET and CO2analyser data. PET information was obtained at the outlet of the adsorption column: the total cpm for each pixel in the transverse slice was summed for eachfinal frame. AC: (a) CO2concentration of 50%, partial CO2pressure 1.3 MPa; (b) CO2concentration of 30%, 0.78 MPa; (c) CO2 concentration of 10%, 0.26 MPa. Zeolite 13X: (e) CO2concentration of 50%, 1.3 MPa; (f) CO2concentration of 30%, 0.78 MPa; (g) CO2concentration of 10%, 0.26 MPa. Figures (d) and (h) illustrate the fair agreement obtained between PET and CO2probe measurements for both AC and Zeolite 13X.
Fig. 5. Intensity profiles and wave function along the adsorbent bed of Activated Carbon (79 mm adsorbed length: 24 to 103 mm) at 1.6 MPa (Full data are given in SI-C.1).
3.3. Experimental procedure
The experimental procedure involved several stages. During the regeneration of the bed (1–3 h), pure N2was used toflush the bed at
200 Nml/min. The CO2analyser was then started to measure the vol%
CO2 at the column exit. The system pressure was increased to and
maintained at 2.6 MPa for most of the experiments. The11CO2– N2
cyclotron gas cylinder was connected and pressurised at about 6 MPa by adding N2. When at this pressure, both11CO2-N2and CO2were fed at
the STPflow rates defined before, and the PET imaging was performed. For both Zeolite 13X and Activated Carbon, the total operating pressure was 2.6 MPa for most of the experiments. The partial pressure of CO2is
a function of its vol% (10 to 50). The N2flow was 140 Nml min−1with
a CO2flow of 60 Nml min−1. Experiments lasted about 160 min.
Finally, CO2and N2supplies were turned off and the rig was slowly
depressurized. Radioactive tracer would continue to be exhausted to the expandable and shielded ducting pipe for overnight decay. When at ambient pressure, the tracer gas cylinder was removed and returned to the cyclotron to be used in the next experiment.
Allflow, images and CO2concentration data where thereafter
pro-cessed to assess the CO2 adsorption. Adsorption kinetics and
break-through curves were generated and compared with experimental ima-ging data. The images captured were reconstructed by the Unix PET computer, transformed to usable image files (jpg/png format), and numerically analysed.
3.4. Data treatment for adsorption
In adsorption of gaseous components on a solid substrate, various parameters are important to characterize the process and progress, i.e. the mass transfer zone, the adsorption equilibrium as commonly de-termined by the rate of transfer of adsorbate onto adsorbent to reach equilibrium conditions, and the adsorption mechanisms, which are expected to be diffusion dominated. These parameters are defined and described inSupplementary informationSI-C and SI-D.
4. Experimental results and discussion
4.1. Profiles of the tracer concentration with time and length
Fig. 2illustrates eleven consecutive image frames, from the initial
11CO
2arrival (frame 1). The highest concentration region in the
ad-sorption bed is shown by red pixels (determined from the relative in-tensity of the tracer in counts/min). With increasing time, CO2becomes
uniformly adsorbed throughout the bed length as shown in frame 11 (after 495 s).
A similar progress of the adsorption is shown in the cross-sectional intensity profiles of accumulated11CO
2at a given cross section within
the bed, is illustrated inFig. 3. The experiments demonstrate varying adsorption front velocities using different intensity values, and indicate that CO2was still adsorbed even after the main Mass Transfer Zone
(MTZ) moved past the given location. The comparison of the accumu-lation rate of CO2at a given location with the bulk velocity of the MTZ
enabled the determination of the overall mass transfer kinetics, as il-lustrated in SI-D.
4.2. Breakthrough curves
Both PET results, and measurements by the CO2probe at the bed
exit, were used to construct the breakthrough curves.
Fig. 4 illustrates the resulting breakthrough curve for Activated Carbon and Zeolite 13X at various CO2 concentrations. The curves
clearly show a zero output concentration until about 15 (high CO2) to
30 (low CO2) minutes which corresponds with a MTZ progress in the
bed at a bulk velocity of 13 and 6.5 mm min−1, respectively. The curves level off after respectively ~120 and ~60 min. Both factors confirm that a PET frame acquisition duration of 45 s is certainly suitable, since meeting the measured Full-Width at Half Maximum (FWHM), as illu-strated in SI-A.Fig. 5summarizes both the image and the analyser data, for different experimental conditions. Good agreement is obtained and the times to breakthrough only differ by about 5 min. Data at 50% and 30% feed concentrations show a different initial inclination, slightly steeper, however with negligible differences in the observed times to saturation (6 and 1 min, respectively).
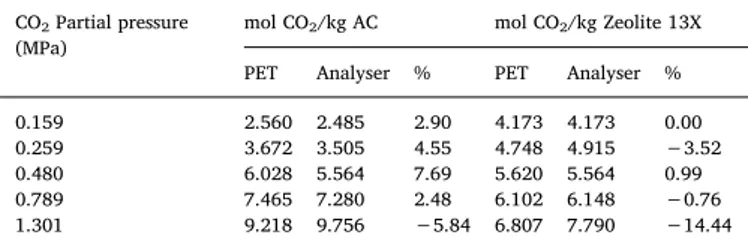
To compare the CO2 PET imaging and probe results; data of
Fig. 4(d) and 4(h) were summarized in Table 1, with deviations amongst respective data expressed in %. For most of the CO2partial
pressures, the respective error bars of the average data overlap and deviations are generally positive or negative, within the accuracy margin of 5 to 10% as expected from the accuracy of the Servomex CO2
probe and the spatial resolution of the PET imaging. This fair agreement is not obtained for Zeolite 13X at the highest partial pressure of CO2
(1.3 MPa): the average PET result is 14.44% lower than the CO2probe
result. This higher deviation is probably due to the length and the lo-cation of the Zeolite 13X adsorber bed (69 mm only, not centrally po-sitioned along the FoV. and hence responsible for an attenuation error correction of the PET camera). This error only occurred at high CO2
partial pressures, where the velocity front moves faster than at lower pressures (as discussed below). Ideally, the location of the adsorbents should be centrally towards the FoV. This Zeolite 13X data point should hence be considered with caution.
4.3. Mass transfer zone
The in-bed progress of the adsorption phenomenon as described in
Supplementary InformationB-1 can only be observed by PET imaging.
Figs. 5 and 6show central cross sectional images along the length of the column for adsorption on AC and Zeolite 13X, respectively, at a reference 20 min of operation and for different CO2feed
concentra-tions. Pixel intensities are normalized with a pixel at maximum in-tensity representing 100% saturation. The illustration of concentration profiles are added at 30% CO2to depict the distribution of11CO2along
the column as % of the maximum observed capacity. Additionalfigures are reported in SI-C.1. Data were moreover transferred into intensity wave functions, also completely illustrated in SI-C.1
Both intensity curves and wave functions are important to under-stand the adsorption kinetics.
For Activated Carbon, the MTZ is reduced progressively from 92 mm, to 74 mm and 58 mm at respectively 50, 30 and 10 vol% feed concentration. The velocity of the adsorption front decreases with the vol% concentration from 5.4 mm/min (50%), 4.14 mm/min (30%) to 3.05 mm/min (10%).
For Zeolite 13X, on the contrary, calculated MTZ are 40 mm (50 vol %), 26 mm (30 vol%) and 16 mm (10 vol%) only. The adsorption front velocities are 3.05 (50%), 2.32 (30%) and 0.78 (10%) mm/min, re-spectively. Clearly, Activated Carbon has a faster moving bulk ad-sorption front than Zeolite 13X.
This is also confirmed by the mass transfer wave velocities (SI-C.1). The concentration profiles in The wave functions ofFig. 5(C) and 6(C)
PET data ), of data acquired by PET-imaging and CO2-analyzer.
CO2Partial pressure (MPa)
mol CO2/kg AC mol CO2/kg Zeolite 13X
PET Analyser % PET Analyser %
0.159 2.560 2.485 2.90 4.173 4.173 0.00 0.259 3.672 3.505 4.55 4.748 4.915 −3.52 0.480 6.028 5.564 7.69 5.620 5.564 0.99 0.789 7.465 7.280 2.48 6.102 6.148 −0.76 1.301 9.218 9.756 −5.84 6.807 7.790 −14.44 Table 1
6. Conclusions
The results have proven that PET can be used as a non-invasive radio-active gas imaging technique in opaque systems. The additional 3D information it gives, including the shape of the mass transfer zone, enables fundamental insights into the kinetics of packed bed CO2
ad-sorption.
The scientific potential of the imaging technique in opaque systems was demonstrated by using the data obtained, with the various litera-ture approaches for gas adsorption. Here too, PET imaging data can be applied and help to select the most appropriate approaches for the studied CO2/ Zeolite 13X or Activated Carbon process.
To further develop and implement the PET investigation concept, additional research is recommended to include (i) the kinetic study of desorbing11CO
2at reduced pressure and after system saturation has
been reached; examining 3D-surface gas–solid catalytic reactions in e.g. car exhausts[16],fixed bed reactions such as encountered in mineral oxides/CO2carbonation/decarbonation cycles[17], catalytic and
non-catalytic deNOx[27]and deSOx[28], or the immobilisation behaviour
of bio-molecules on an appropriate carrier[29,30]. Even complex me-chanisms of PCDD/F removal[31–33]in fixed, entrained or moving beds, and/or PCDD/F catalytic destruction on V2O5/NO3/TiO2catalyst
[34]could be elucidated. To improve the temporal resolution of the PET imaging, the Positron Imaging Centre at The University of Bir-mingham has recently acquired a GE Discovery ST scanner with similar FOV and spatial resolution but improved sensitivity which should offer greater temporal resolution. For smaller scale studies a Concord P4 (FOV: axial 150 mm; trans-axial 80 mm) with stated resolution of 1.8 mm will also be available.
Finally, the technique offers potential application in various other fields, since also N and O positron emission isotopes can be used (albeit with a lower half-life time).
Declaration of Competing Interest
The authors declare that they have no known competingfinancial interests or personal relationships that could have appeared to in flu-ence the work reported in this paper.
Acknowledgements
Authors acknowledge funding from the Beijing Advanced
Innovation Centre of Soft Matter Science and Engineering (Beijing University of Chemical Technology, China).
Contributions
J.P.K.S. and Y.M.D. have equally shared the main scientific tasks, and should both be considered as equal primary authors. A.I., L.T., S.D.B. and J.P.K.S. designed and assembled the experimental rig. A.I., S.D.B. and L.T. performed the PET tests with11CO
2tracer gas, itself
generated in the cyclotron of the Birmingham University. P.D. and J.B. performed the risk assessment. Y.M.D., L.A., J.B. and H.L.Z. looked into the fundamentals of adsorption, and were assisted by R.D. and R.A. for the data interpretation and treatment. Y.M.D., J.B., R.D. and H.L.Z. drafted the work, while all co-authors substantially participated in the edition of thefinal manuscript.
Appendix A. Supplementary data
Supplementary data to this article can be found online athttps:// doi.org/10.1016/j.cej.2020.126507.
References
[1] G. Muehllehner, J.S. Karp, Positron emission tomography, Phys. Med. Biol. 51 (2006) R117–R137,https://doi.org/10.1088/0031-9155/51/13/R08.
[2] D. Parker, C. Wheldon, The Birmingham MC40 cyclotron facility, Nucl. Phys. News. 28 (2018) 15–20,https://doi.org/10.1080/10619127.2018.1463021.
[3] C.R.K. Windows-Yule, J.P.K. Seville, A. Ingram, D.J. Parker, Positron emission particle tracking of granularflows, Annu. Rev. Chem. Biomol. Eng. 11 (2020) 367–396,https://doi.org/10.1146/annurev-chembioeng-011620-120633. [4] P. Allport, M. Baca, D. Briglin, J. Broughton, R. Canavan, A. Chisholm, L. Gonella,
P. Knights, K. Nikolopoulos, D. Parker, T. Price, J. Thomas, J. Wilson, A. Affolder, G. Casse, P. Dervan, A. Greenall, I. Tsurin, S. Wonsak, S. Dixon, S. Edwards, R. French, P. Hodgson, P. Kemp-Russell, E. Kourlitis, H. Marin-Reyes, K. Parker, Recent results and experience with the Birmingham MC40 irradiation facility, J. Instrum. 12 (2017) c03075, ,https://doi.org/10.1088/1748-0221/12/03/C03075. [5] H.L. Zhang, T. Gowing, J. Degrève, T. Leadbeater, J. Baeyens, The use of particle
heat carriers in the Stirling engine concept, Energy Technol. (2016),https://doi. org/10.1002/ente.201500274.
are very close together which would imply a slow progression of the MTZ through the bed. Conversely, the concentration profiles shown in
Fig. 5(B) and 6(B) are much more spaced apart and the profiles begin to plateau at about 70% of the maximum intensity. This would indicate a relatively fast moving bulk adsorption front with the entire length of the adsorption region acting as an active MTZ, with consistent 11CO
2
uptake for the length of the bed from about 19 min onwards into the experiment.
4.4. Overall appraisal
The results presented prove that a gaseous nuclide-based imaging technique can be used for adsorption studies and provides valuable insights into the kinetics inside the opaque packed bed column for CO2
adsorption. Imaging defines the concentration profiles and location-specific CO2 accumulation, the progress and velocity of the adsorption
front along the column length, and finally the MTZ. The number of events detected was corrected for decay and sensitivity by calibration, and is proportional to the 11
CO2 concentration. The velocity of the
adsorption front increased with the increasing partial pressure of CO2
being fed to the adsorber bed.
As stated before, adsorption design equations are mostly based upon the concentration of the adsorbed component in the adsorber exit gas stream, thus defining overall adsorption parameters such as adsorption efficiency expressed in mole of adsorbate per kg of adsorbent, or the expected time to achieve the breakthrough of adsorbate from the ad-sorbent. Dynamic measurements inside the adsorbent bed are seldom performed, although they are extremely important to measure the ad-sorption kinetics and MTZ through the evolution of concentrations with time and location. Asif [23] and Medeiros [24] mentioned that the lack of these data does not allow to validate 2D or Computational Fluid Dynamics (CFD) simulation results, respectively. Windes et al. [25]
estimated concentrations in an exothermic packed bed reactor by measuring the temperature profile (with only one or two properly placed temperature sensors). Finally, Mustafa [26] developed a special probe to collect gas samples along the reactor, with stored gas samples subsequently analyzed by GC/MS. This measurement technique does not provide rezal-time data, since samples are analyzed after the tests only. The advantages of the PET imaging are hence evident, since providing real-time concentration profile data.
5. Application of the experimental data to validate gas adsorption models and theories
CO2 analysis data were further used to validate kinetic adsorption
theories, as described in detail in Supplementary Information SI-D. The data treatment confirms that PET measurements provides in-situ data that enable a full theoretical treatment of adsorption. A pseudo-first-order model provides a fair linear fitting of predicted and experi-mental results for both adsorbents tested, and can hence be applied for further calculations. As far as adsorption mechanisms are concerned, intra-particle diffusion is rate-limiting for Activated Carbon, while for Zeolite 13X both film and intra-particle diffusion must be considered.
[6] S. Mahmoudi, J.P.K. Seville, J. Baeyens, The residence time distribution and mixing of the gas phase in the riser of a circulatingfluidized bed, Powder Technol. (2010), https://doi.org/10.1016/j.powtec.2010.05.024.
[7] S.D. Bell, A. Ingram, T.W. Leadbeater, D.J. Parker, An investigation into the feasi-bility of radioactive gas imaging for studies in process tomography, in: 7th World Congr. Ind. Process Tomogr., 2014. https://doi.org/https://www.isipt.org/world-congress/7/933.html.
[8] K.E. Waters, N.A. Rowson, X.F. Fan, D.J. Parker, J.J. Cilliers, The use of positron emission particle tracking as a method for tracking particles inflotation froths, Philos. Mag. Lett. 88 (2008) 735–1539,https://doi.org/10.1080/
09500830802203394.
[9] O. Mihailova, D. O’Sullivan, A. Ingram, S. Bakalis, Velocity field characterization of Newtonian and non-Newtonianfluids in SMX mixers using PEPT, Chem. Eng. Res. Des. 108 (2016) 126–138,https://doi.org/10.1016/j.cherd.2016.03.006. [10] W.D. Griffiths, Y. Beshay, A.J. Caden, X. Fan, J. Gargiuli, T.W. Leadbeater,
D.J. Parker, The use of positron emission particle tracking (PEPT) to study the movement of inclusions in low-melting-point alloy castings, Metall. Mater. Trans. B 43 (2011) 370–378,https://doi.org/10.1007/s11663-011-9596-0.
[11] M.J.H. Simmons, I. Edwards, J.F. Hall, X. Fan, D.J. Parker, E.H. Stitt, Techniques for visualization of cavern boundaries in opaque industrial mixing systems, AIChE J. (2009),https://doi.org/10.1002/aic.11889.
[12] W.D. Griffiths, Y. Beshay, D.J. Parker, X. Fan, The determination of inclusion movement in steel castings by positron emission particle tracking (PEPT), J. Mater. Sci. 43 (2008) 6853–6856,https://doi.org/10.1007/s10853-008-2999-x. [13] S.D. Bell, The development of radioactive gas imaging for the study of chemical
flow processes, University of Birmingham, School of Chemical Engineering, College of Engineering and Physical Sciences, retrieved from http://etheses.bham.ac.uk/id/ eprint, 2015. http://etheses.bham.ac.uk/id/eprint/6545.
[14] C. Dechsiri, A. Ghione, F. van de Wiel, H.G. Dehling, A.M.J. Paans, A.C. Hoffmann, Positron Emission Tomography Applied to Fluidization Engineering, Can. J. Chem. Eng. 83 (2005) 88–96,https://doi.org/10.1002/cjce.5450830116.
[15] T. Barth, J. Kulenkampff, M. Ludwig, S. Bras, M. Gründig, K. Franke, Study of particle deposition and resuspension in pebble beds using positron emission to-mography, in: 7th World Congr. Ind. Process Tomogr., 2013: pp. 2–5.
[16] G. Jonkers, K.A. Vonkeman, S.W.A. Van Der Wal, R.A. Van Santen, Surface catalysis studied by in situ positron emission, Nature 355 (1992) 63–66,https://doi.org/10. 1038/355063a0.
[17] J. Liu, J. Baeyens, Y. Deng, T. Tan, H. Zhang, The chemical CO2 capture by car-bonation-decarbonation cycles, J. Environ. Manage. 260 (2020) 110054. [18] A. Guida, X. Fan, D.J. Parker, A.W. Nienow, M. Barigou, Positron emission particle
tracking in a mechanically agitated solid-liquid suspension of coarse particles, Chem. Eng. Res. Des. 87 (2009) 421–429,https://doi.org/10.1016/j.cherd.2008. 12.001.
[19] Z. Yang, X. Fan, P.J. Fryer, D.J. Parker, S. Bakalis, Improved multiple-particle tracking for studyingflows in multiphase systems, AIChE J. 53 (2007) 1941–1951, https://doi.org/10.1002/aic.11224.
[20] M. Van de Velden, J. Baeyens, J.P.K. Seville, X. Fan, The solidsflow in the riser of a Circulating Fluidised Bed (CFB) viewed by Positron Emission Particle Tracking (PEPT), Powder Technol. 183 (2008) 290–296,https://doi.org/10.1016/j.powtec. 2007.07.027.
[21] X. Fan, D.J. Parker, Z. Yang, J.P.K. Seville, J. Baeyens, The effect of bed materials on the solid/bubble motion in afluidised bed, Chem. Eng. Sci. 63 (2008) 934–950, https://doi.org/10.1016/j.ces.2007.06.045.
[22] Y. Xu, T. Li, L. Lu, X. Gao, S. Tebianian, J.R. Grace, J. Chaouki, T.W. Leadbeater, R. Jafari, D.J. Parker, J. Seville, N. Ellis, Development and confirmation of a simple procedure to measure solids distribution influidized beds using tracer particles, Chem. Eng. Sci. 217 (2020) 115501, ,https://doi.org/10.1016/j.ces.2020.115501. [23] M. Asif, Conversion enhancement offixed-bed reactors using two-dimensional
hollow cylindrical catalyst pellet, Int. J. Chem. React. Eng. 11 (1) (2013) 159–168, https://doi.org/10.1515/ijcre-2012-0038.
[24] N.J. Medeiros, Computational Fluid Dynamics Simulations of Radial Dispersion in Low N Fixed Bed Reactors. (2015) Worcester Polytechnic Institute, Masters Theses 1306, retrieved from https://digitalcommons.wpi.edu/etd-theses/1306/. [25] L.C. Windes, A. Cinar, W.H. Ray, Dynamic estimation of temperature and
con-centration profiles in a packed bed reactor, Chem. Eng. Sci. 44 (10) (1989) 2087–2106,https://doi.org/10.1016/0009-2509(89)85144-9.
[26] M. Yalin, Investigation of concentration profiles in carbon nanotube production reactor. (2009) ODTÜ METU, Open METU, retrieved from http://citeseerx.ist.psu. edu/viewdoc/download?doi=10.1.1.632.8443&rep=rep1&type=pdf (retrieved on 10 July 2020).
[27] S. Mahmoudi, J. Baeyens, J.P.K. Seville, NO x formation and selective non-catalytic reduction (SNCR) in afluidized bed combustor of biomass, Biomass and Bioenergy 34 (2010) 1393–1409,https://doi.org/10.1016/j.biombioe.2010.04.013. [28] Deng, Ansart, Baeyens, Zhang, Flue gas desulphurization in circulatingfluidized
beds, Energies. 12 (2019) 3908. doi: 10.3390/en12203908.
[29] D. Moelans, P. Cool, J. Baeyens, E.F. Vansant, Immobilisation behaviour of bio-molecules in mesoporous silica materials, Catal. Commun. 6 (2005) 591–595, https://doi.org/10.1016/j.catcom.2005.05.007.
[30] D. Moelans, P. Cool, J. Baeyens, E.F. Vansant, Using mesoporous silica materials to immobilise biocatalysis-enzymes, Catal. Commun. 6 (2005) 307–311,https://doi. org/10.1016/j.catcom.2005.02.005.
[31] K. Everaert, J. Baeyens, Removal of PCDD/F fromflue gases in fixed or moving bed adsorbers, Waste Manage. 52 (2004) 1378–1388, https://doi.org/10.1016/S0956-053X(03)00136-3.
[32] K. Everaert, J. Baeyens, J. Degrève, Entrained-phase adsorption of PCDD/F from incineratorflue gases, Environ. Sci. Technol. (2003),https://doi.org/10.1021/ es020020w.
[33] K. Everaert, J. Baeyens, J. Degrève, Removal of pcdd/f from incineratorflue gases by entrained-phase adsorption, J. Air Waste Manag. Assoc. 52 (2002) 1378–1388, https://doi.org/10.1080/10473289.2002.10470872.
[34] K. Everaert, Catalytic combustion of volatile organic compounds, J. Hazard. Mater. 109 (2004) 113–139,https://doi.org/10.1016/j.jhazmat.2004.03.019.