CONTRIBUTION DES MECANISMES « BOTTOM-UP » ET « TOP-DOWN » A LA REGENERATION DES SAPINIERES SUR LTLE D'ANTICOSTI
par
Mathieu Dufresne
Memoire presente au Departement de biologie en vue de l'obtention du grade de maitre es sciences (M.Sc.)
FACULTE DES SCIENCES UNIVERSITE DE SHERBROOKE
1*1
Library and Archives Canada Published Heritage Branch Biblioth6que et Archives Canada Direction du Patrimoine de l'6dition 395 Wellington Street Ottawa ON K1A 0N4 Canada 395, rue Wellington Ottawa ON K1A0N4 CanadaYour file Votre r6f6rence ISBN: 978-0-494-65590-0 Our We Notre reference ISBN: 978-0-494-65590-0
NOTICE: AVIS:
The author has granted a
non-exclusive license allowing Library and Archives Canada to reproduce, publish, archive, preserve, conserve, communicate to the public by
telecommunication or on the Internet, loan, distribute and sell theses
worldwide, for commercial or non-commercial purposes, in microform, paper, electronic and/or any other formats.
L'auteur a accorde une licence non exclusive permettant a la Bibliotheque et Archives Canada de reproduire, publier, archiver, sauvegarder, conserver, transmettre au public par telecommunication ou par I'lnternet, preter, distribuer et vendre des theses partout dans le monde, a des fins commerciales ou autres, sur support microforme, papier, electronique et/ou autres formats.
The author retains copyright ownership and moral rights in this thesis. Neither the thesis nor substantial extracts from it may be printed or otherwise reproduced without the author's permission.
L'auteur conserve la propriete du droit d'auteur et des droits moraux qui protege cette these. Ni la these ni des extraits substantiels de celle-ci ne doivent etre imprimes ou autrement
reproduits sans son autorisation.
In compliance with the Canadian Privacy Act some supporting forms may have been removed from this thesis.
While these forms may be included in the document page count, their removal does not represent any loss of content from the thesis.
Conformement a la loi canadienne sur la protection de la vie privee, quelques formulaires secondaires ont ete enleves de cette these.
Bien que ces formulaires aient inclus dans la pagination, il n'y aura aucun contenu manquant.
I + I
Canada
Le 4 aout 2010
le jury a accepte le memoire de Monsieur Mathieu Dufresne dans sa version finale.
Membres du jury
Professeur Robert L. Bradley Directeur de recherche Departement de biologie
Professeur Jean-Pierre Tremblay Codirecteur de recherche Departement de biologie
Universite Laval
Professeur Marco Festa-Bianchet Membre
Departement de biologie
Monsieur John-William Shipley President rapporteur Departement de biologie
SOMMAIRE
Le broutement selectif exerce par la population introduite de cerf de Virginie sur File d'Anticosti y cause la perte des sapinieres au profit des pessieres blanches. Les travaux qui sont menes par la chaire de recherche industrielle CRSNG-Produits forestiers Anticosti s'inscrivent dans un effort commun ayant pour but la comprehension des consequences de la surabondance des ongules dans certains milieux. De tels travaux peuvent aussi mener a de nouvelles methodes de gestion des populations elevees d'ongules.
Dans le premier chapitre, nous presentons des resultats sur F impact de densites controlees et naturelles de cerf de Virginie sur la nitrification dans des coupes totales et des Tlots de sapinieres matures. Les donnees que nous avons obtenues dans les forets matures sont en accord avec ce que suggere la litterature, soit que les densites croissantes d'ongules entrainent une baisse de la nitrification. Dans les coupes totales par contre, nous avons constate des concentrations de nitrates (NO3") tres elevees dans les parcelles accueillant les plus fortes densites de cerf. Des donnees sur la disponibilite du carbone et sur le couvert vegetal nous ont permis de proposer des mecanismes qui pourraient expliquer ces resultats inattendus. Des resultats similaires aux notres sont generalement observes dans des ecosystemes fertiles comme les prairies, oil le broutement peut engendrer des boucles de retroaction positives via la rhizodeposition : rarement de telles relations ont ete trouvees en foret boreale, ou les fortes densites d'ongules ralentissent generalement les cycles biogeochimiques. Nous proposons deux autres explications originales; l'une aborde l'apport en feces et urine, F autre fait reference a la perte d'especes vegetales aptes a assimiler les nitrates efficacement.
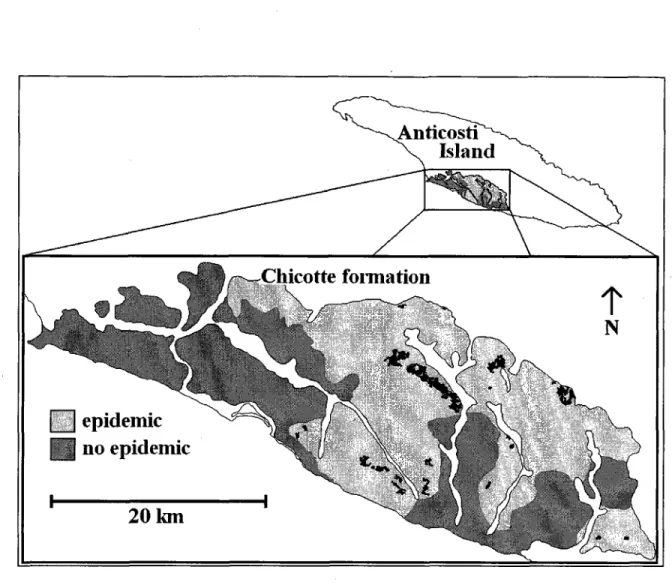
Pour le deuxieme chapitre, nous nous sommes interesses a la formation geologique de la riviere Chicotte, situee au centre sud de Pile d'Anticosti. On y observe une importante regeneration de sapin baumier et meme de bouleau blanc, une espece encore plus susceptible au broutement par le cerf. Nous avons tente d'identifier des proprietes latentes du sol qui pourraient expliquer cette regeneration inhabituelle. Selon nos analyses, seulement la profondeur du sol et le contenu en argile contribuent a expliquer la regeneration observee : le sapin baumier est plus abondant sur les sols minces, alors que le bouleau blanc est beaucoup plus abondant sur les sols profonds. Aussi, sur les sols minces, le sapin est davantage abondant lorsque le pourcentage d'argile est faible. La defense chimique des plantes et l'acces aux nutriments pour la croissance sont les principales hypotheses proposees pour expliquer cette dichotomie. Les connaissances que nous apportons pourraient permettre de predire P assemblage des communautes vegetales suite a des actions visant a diminuer les densites de cerf de Virginie sur Pile d'Anticosti.
Nous possedons des donnees sur 14 variables edaphiques mesurees sur les echantillons recoltes dans le dispositif experimental presente au premier chapitre. Nous presentons ces donnees dans le troisieme chapitre. Les variables etudiees montrent des tendances imprevisibles selon les replicats et par rapport aux deux niveaux de traitement (densite de cerf et couvert forestier). Nous ne traitons pas ces donnees de maniere plus poussee, mais il est souhaitable que celles-ci soient appariees a un jeu de donnees sur la vegetation issu des memes parcelles.
Au cours de mes sejours sur Anticosti, j'ai mis en place une experience de transplantation reciproque dont l'objectif etait de determiner la contribution respective du genotype et de Penvironnement sur Pexpression du phenotype d'une cohorte de sapins qui repoussent naturellement dans un secteur d'Anticosti sans etre consommes par le cerf. Malgre un effectif d'environ 300 sapins transplants, la protection des sapins par une quarantaine
d'exclos et les milliers de litres d'eau transports sur des kilometres en foret pour l'arrosage des transplants, le taux de mortalite fut tel que nous avons du abandonner l'experience a la troisieme saison. Neanmoins, un deuxieme projet sur les sols d'Anticosti est sur le point de debuter, et il est souhaitable que certains elements de cette experience soient repris, avec des methodes adaptees qui permettraient d'augmenter la survie des transplants. Par exemple, Putilisation de transplants de pepiniere pourrait permettre de determiner l'effet du site sur la chimie foliaire des semis.
REMERCIEMENTS
Je remercie tout d'abord mon directeur Robert Bradley et mon co-directeur Jean-Pierre Tremblay pour leur encadrement, leurs idees et leurs conseils. Je remercie aussi Marco Festa-Bianchet et Bill Shipley, membres de mon comite scientifique, pour les quelques reunions fructueuses.
Merci a Steeve Cote, Sonia de Bellefeuille, Pierre Beaupre et Alex (Gaetan) Laprise ainsi qu'aux autres membres de la chaire pour les rencontres enrichissantes. Je n'oublie pas Caroline Girard, qui a consacre beaucoup de son temps a tenter de me rendre fonctionnel avec Arcview, Bill Parsons, pour les discussions et conseils en statistiques et au labo, et Benoit Lapointe, l'homme orchestre du laboratoire. Merci aux assistants de terrain Denis, Francois, Yannick, et Gregory, ainsi qu'aux assistants de laboratoire Dominique, Melanie et Xavier, sans oublier les autres etudiants gradues du laboratoire d'ecologie a l'Universite de Sherbrooke.
Le financement de ce projet a ete assure par la chaire CRSNG-Produits forestiers Anticosti.
Merci aux membres ma famille pour leur soutien inconditionnel. Finalement, je garde une pensee pour Hubert St-Jean et son cafe, ainsi que pour Alexandre et son duo smoked meat et Houblon.
TABLE DES MATIERES
SOMMAIRE ii
REMERCIEMENTS v
TABLE DES MATIERES vi
LISTE DES FIGURES ix
INTRODUCTION 1
CHAPITRE 1
CLEARCUTTING AND DEER BROWSING INTENSITY INTERACT IN CONTROLLING NITRIFICATION RATES IN FOREST FLOOR HUMUS ON
ANTICOSTI ISLAND, CANADA 4
1.1 Introduction 9 1.2 Methods 11
1.2.1 Study site description and history 11 1.2.2 Experimental design and field sampling 12
1.2.3 Soil analyses 13 1.2.4 Statistical analyses 15
1.3 Results 16 1.4 Discussion 17 1.5 Acknowledgements 24
1.6 References 24
CHAPITRE 2
SOIL DEPTH AND CLAY CONTENT AS CONTRIBUTING FACTORS TO POST-DISTURBANCE BALSAM FIR AND PAPER BIRCH REGENERATION UNDER HEAVY BROWSING FROM DEER ON ANTICOSTI ISLAND,
CANADA ...30 2.1 Introduction 36
2.2 Methods 39 2.2.1 Study site description and field survey design 39
2.2.2 Field sampling and soil analyses 40
2.2.3 Statistical analyses 40
2.3 Results 42 2.4 Discussion 43 2.5 Acknowledgements 46
CHAPITRE 3
EFFETS IDIOSYNCRATIQUES DE LA DENSITE DE CERF DE VIRGINIE SUR LES CYCLES BIOGEOCHIMIQUES DE L'HUMUS FORESTIER EN
FORET BOREALE SIX ANS APRES UNE COUPE TOTALE 50
3.1. Introduction 53 3.2 Materiel et methodes 54 3.2.1 Dispositif experimental 54 3.2.2 Analyses de sol 54 3.2.3 Analyses statistiques 55 3.3 Resultats 56 3.4 Discussion 56 3.5 Remerciements 73 3.6 References bibliographiques 73 CONCLUSION 75 BIBLIOGRAPHIE 77
LISTE DES FIGURES
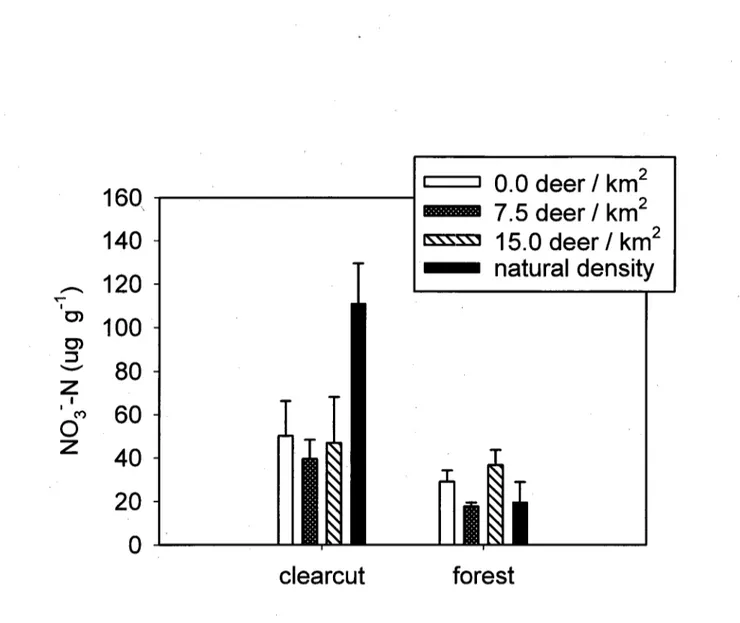
1. Effect of white-tailed deer density on potential nitrification in the forest floor of clearcut and forest plots in balsam fir dominated stands of Anticosti Island, Quebec, Canada. Bars represent the mean value of three replicate plots; vertical lines = 1 S.D
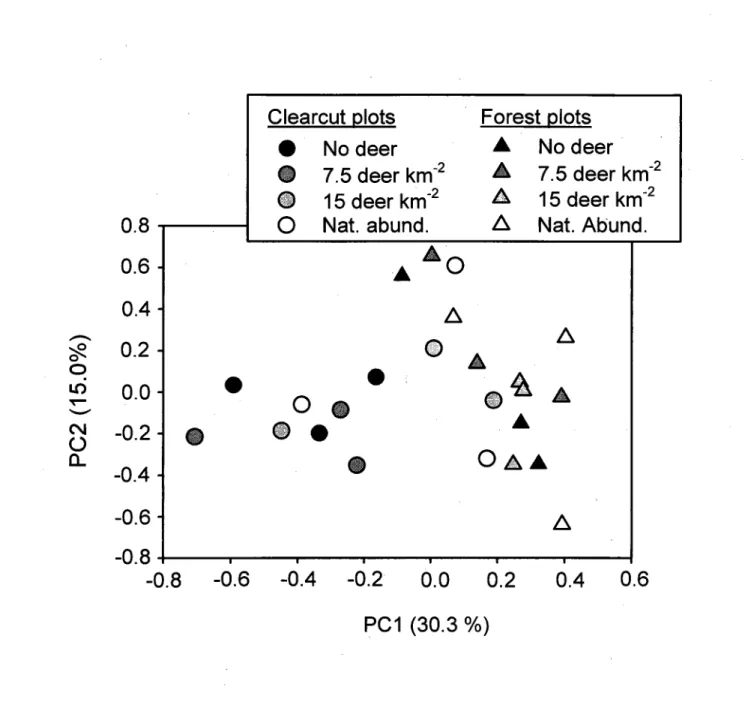
2. Ordination biplot of the 24 sample plots resulting from principal component analysis (PCA) of understory plant community composition
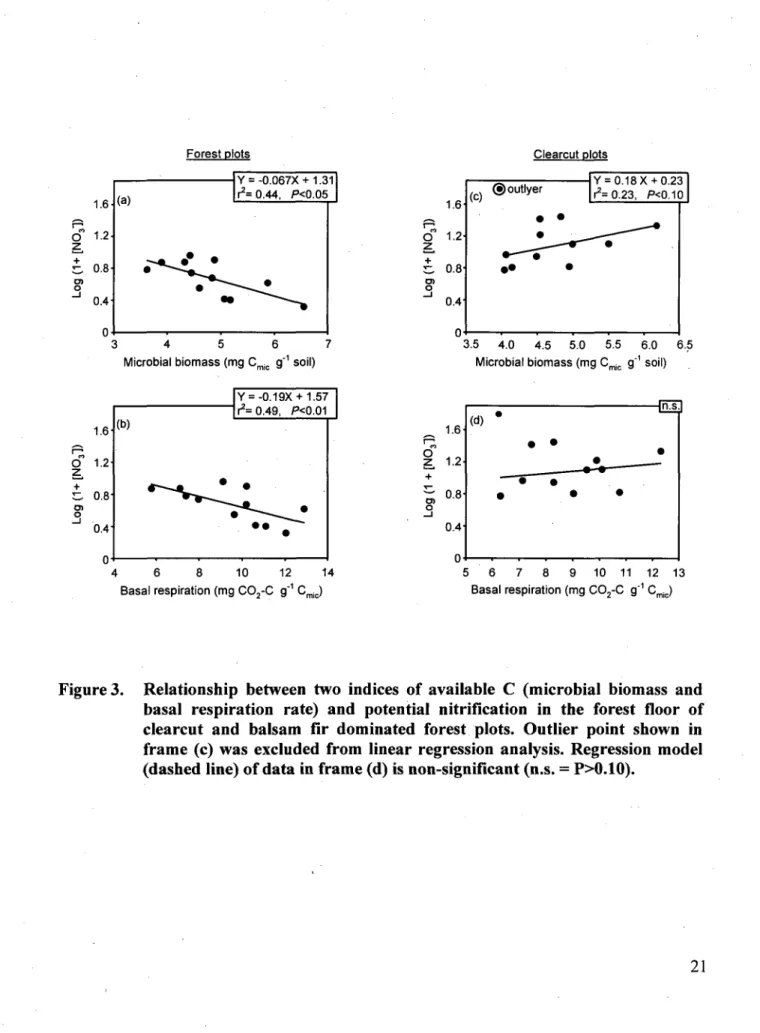
3. Relationship between two indices of available C (microbial biomass and basal respiration rate) and potential nitrification in the forest floor of clearcut and balsam fir dominated forest plots. Outlier point shown in frame (c) was excluded from linear regression analysis. Regression model (dashed line) of data in frame (d) is non-significant (n.s. = P>0.10)
5. Map of Anticosti Island outlining the Chicotte geologic formation. Black areas in the magnified map at the bottom refer to the 24 polygons containing study plots
17
19
21
4. The effect of deer population size on the percent cover of three nitrophilous plants species (a,b,c), on the sum their cover (d), and on total percent cover
of eight graminoid plant species in 7 year-old clearcut plots following six ^ consecutive years of controlled grazing....
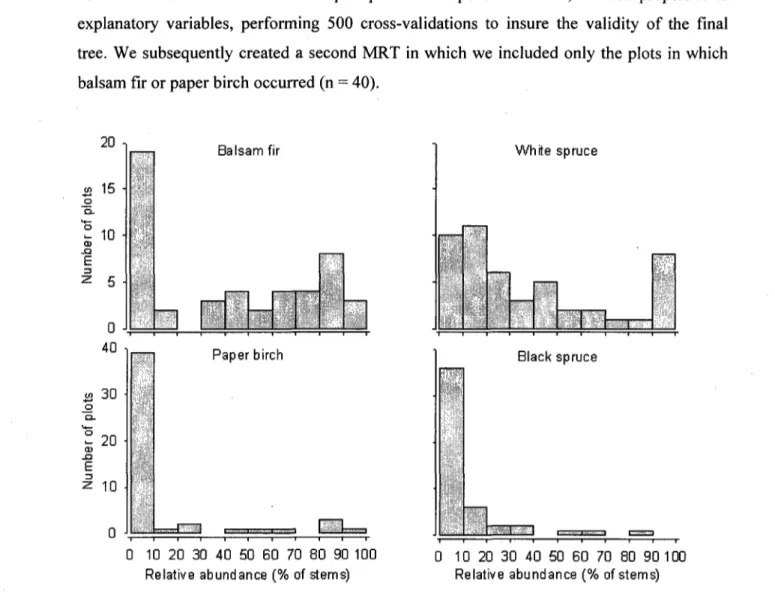
6. Frequency distribution of study plots (N = 49) according to the relative abundance of balsam fir, paper birch, white spruce and black spruce. In summer 2007, all stems taller than 2 m were counted for each arboreal species in circular 100 m plots. There were no other arboreal species but these four in the plots
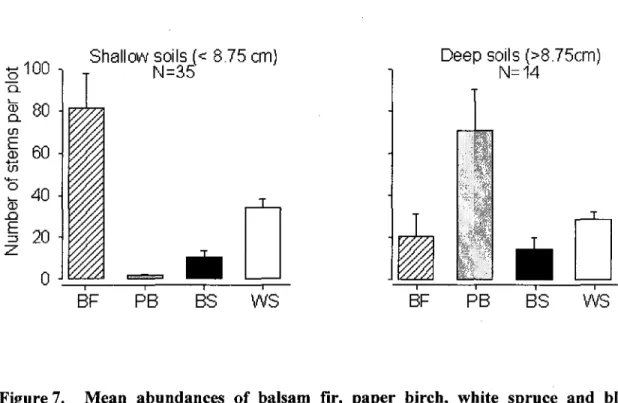
7. Mean abundances of balsam fir, paper birch, white spruce and black spruce (> 2 m) in the two groups of plots that were segregated by multivariate regression tree (MRT) according to soil depth. The MRT explained 16.1% of the total variance. Bars represent means ± 1SE
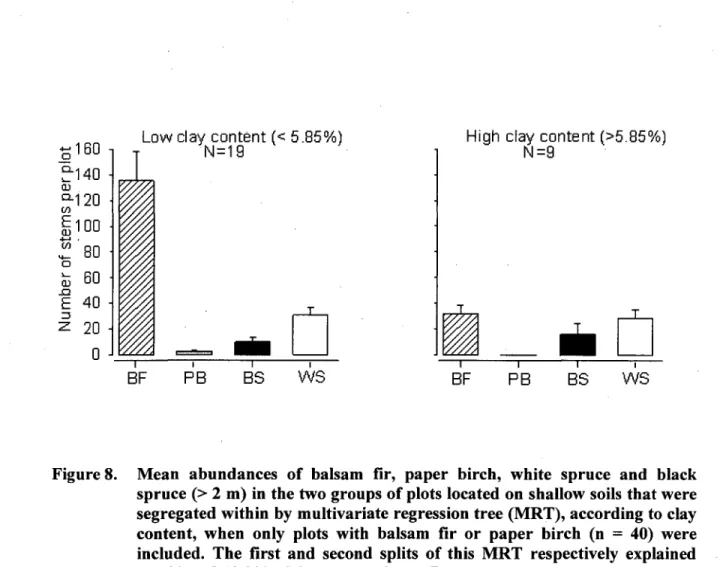
8. Mean abundances of balsam fir, paper birch, white spruce and black spruce (> 2 m) in the two groups of plots located on shallow soils that were segregated within by multivariate regression tree (MRT), according to clay content, when only plots with balsam fir or paper birch (n = 40) were included. The first and second splits of this MRT respectively explained 22.3% and 13.9% of the total variance. Bars represent means ± 1SE
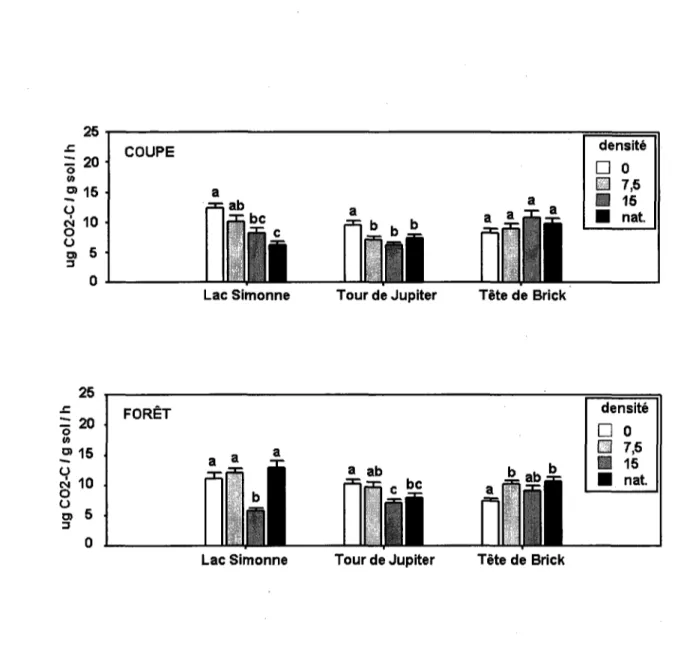
9. Valeurs moyennes de biomasse microbienne dans les 12 unites experimentales, pour chaque categorie de couvert. Chaque barre represente la moyenne de 20 quadrats ± un ecart-type. Les lettres differentes montrent les differences significatives selon des tests de Duncan entre les quatre niveaux de densite de cerf sous un type de couvert forestier dans un replicat
10. Valeurs moyennes de respiration basale microbienne dans les 12 unites experimentales, pour chaque categorie de couvert. Chaque barre represente la moyenne de 20 quadrats ± un ecart-type. Les lettres differentes montrent les differences significatives selon des tests de Duncan entre les quatre niveaux de densite de cerf sous un type de couvert forestier dans un replicat
11. Valeurs moyennes de quotient metabolique dans les 12 unites experimentales, pour chaque categorie de couvert. Chaque barre represente la moyenne de 20 quadrats ± un ecart-type. Les lettres differentes montrent les differences significatives selon des tests de Duncan entre les quatre niveaux de densite de cerf sous un type de couvert forestier dans un replicat
12. Valeurs moyennes de carbone total dans les 12 unites experimentales, pour chaque categorie de couvert. Chaque barre represente la moyenne de 20 quadrats ± un ecart-type. Les lettres differentes montrent les differences significatives selon des tests de Duncan entre les quatre niveaux de densite de cerf sous un type de couvert forestier dans un replicat
13. Valeurs moyennes de pourcentage de carbone microbien dans les 12 unites experimentales, pour chaque categorie de couvert. Chaque barre represente la moyenne de 20 quadrats ± un ecart-type. Les lettres differentes montrent les differences significatives selon des tests de Duncan entre les quatre niveaux de densite de cerf sous un type de couvert forestier dans un replicat
14. Valeurs moyennes de nitrate dans les 12 unites experimentales, pour chaque categorie de couvert. Chaque barre represente la moyenne de 20 quadrats ± un ecart-type. Les lettres differentes montrent les differences significatives selon des tests de Duncan entre les quatre niveaux de densite de cerf sous un type de couvert forestier dans un replicat
15. Valeurs moyennes d'ammonium dans les 12 unites experimentales, pour chaque categorie de couvert. Chaque barre represente la moyenne de 20 quadrats ± un ecart-type. Les lettres differentes montrent les differences significatives selon des tests de Duncan entre les quatre niveaux de densite de cerf sous un type de couvert forestier dans un replicat
16. Valeurs moyennes de RNI dans les 12 unites experimentales, pour chaque categorie de couvert. Chaque barre represente la moyenne de 20 quadrats ± un ecart-type. Les lettres differentes montrent les differences significatives selon des tests de Duncan entre les quatre niveaux de densite de cerf sous un type de couvert forestier dans un replicat
17. Valeurs moyennes d'azote total dans les 12 unites experimentales, pour chaque categorie de couvert. Chaque barre represente la moyenne de 20 quadrats ± un ecart-type. Les lettres differentes montrent les differences significatives selon des tests de Duncan entre les quatre niveaux de densite de cerf sous un type de couvert forestier dans un replicat.
18. Valeurs moyennes de ratio carbone - azote dans les 12 unites experimentales, pour chaque categorie de couvert. Chaque barre represente la moyenne de 20 quadrats ± un ecart-type. Les lettres differentes montrent les differences significatives selon des tests de Duncan entre les quatre niveaux de densite de cerf sous un type de couvert forestier dans un replicat
19. Valeurs moyennes de phosphate extractible dans les 12 unites experimentales, pour chaque categorie de couvert. Chaque barre represente la moyenne de 20 quadrats ± un ecart-type. Les lettres differentes montrent les differences significatives selon des tests de Duncan entre les quatre niveaux de densite de cerf sous un type de couvert forestier dans un replicat
20. Valeurs moyennes de potassium extractible dans les 12 unites experimentales, pour chaque categorie de couvert. Chaque barre represente la moyenne de 20 quadrats ± un ecart-type. Les lettres differentes montrent les differences significatives selon des tests de Duncan entre les quatre niveaux de densite de cerf sous un type de couvert forestier dans un replicat
21. Valeurs moyennes de magnesium extractible dans les 12 unites experimentales, pour chaque categorie de couvert. Chaque barre represente la moyenne de 20 quadrats ± un ecart-type. Les lettres differentes montrent les differences significatives selon des tests de Duncan entre les quatre niveaux de densite de cerf sous un type de couvert forestier dans un replicat
22. Valeurs moyennes de calcium extractible dans les 12 unites experimentales, pour chaque categorie de couvert. Chaque barre represente la moyenne de 20 quadrats ± un ecart-type. Les lettres differentes montrent les differences significatives selon des tests de Duncan entre les quatre niveaux de densite de cerf sous un type de couvert forestier dans un replicat
INTRODUCTION
Depuis une cinquantaine d'annees, certains biologistes utilisent les concepts de controle par les ressources (du bas vers le haut) et par les consommateurs (du haut vers le bas) pour decrire les interactions trophiques dans les ecosystemes (Lindemann, 1942 ; Hairston et al., 1960). Depuis la meme epoque, plusieurs cas de fortes populations d'ongules dans les ecosystemes sont rapportes (Leopold, 1933 ; Leopold et al., 1947). L'accumulation des connaissances dans ces deux domaines de la biologie suggerent de nos jours que les ongules peuvent exercer un fort controle du haut vers le bas sur les niveaux trophiques inferieurs (Hobbs, 1996 ; Cote et al., 2004).
L'influence des ongules sur les cycles biogeochimiques varie d'un habitat a l'autre (Hobbs, 1996). Par exemple, dans les prairies, le broutement peut engendrer des boucles de retroaction positives en augmentant la rhizodeposition de carbone labile par les plantes broutees, ce qui peut stimuler les communautes microbiennes du sol et augmenter leur taux de mineralisation des nutriments (Frank et al., 2000). En foret boreale par contre, le broutement selectif sur les plantes plus facilement digestibles peut causer une diminution de la qualite chimique de la litiere et un ralentissement des cycles biogeochimiques en augmentant l'apport en litiere des especes non-consommees dont les tissus sont plus recalcitrants a la decomposition (Pastor et al., 1993).
Tel que mentionne plus haut, 1'impact des ongules sur les niveaux trophiques inferieurs peut etre dominant dans certains ecosystemes. Cela n'exclut cependant pas la contribution de certains mecanismes du bas vers le haut au controle des interactions trophiques. Par exemple, Jones et al. (2008) ont montre que certaines caracteristiques du sol peuvent affecter la composition chimique des plantes consommees par le cerf de Virginie (Odocoileus
virginianus Zimmerman). lis ont d'ailleurs propose un impact potentiel de la chimie des
plantes sur la croissance, la lactation et le recrutement chez le cerf. De plus, de nombreux articles rapportent des relations negatives entre la fertilite du sol et 1'expression de fortes concentrations de composes secondaires efficaces dans la defense contre l'herbivorie chez les plantes (Bryant et al., 1983 ; Donaldson et al., 2006).
Suivant une introduction couronnee de succes sur l'ile d'Anticosti a la fin du 19e siecle, la population de cerf de Virginie a atteint un niveau d'effectif tel que le broutement selectif important compromet la regeneration des sapinieres a bouleau blanc, au profit de pessieres blanches pures et de forets-parcs dominees par les graminees. A cet effet, Potvin et al. (2003) anticipent l'eradication des sapinieres d'ici moins de 50 ans sur Anticosti. Neanmoins, on retrouve a quelques rares endroits sur le territoire de bonnes proportions de sapin baumier dans des peuplements regeneres en presence de fortes densites de cerf (Chouinard et Filion, 2005).
Un des quatre axes de recherche de la deuxieme- Chaire Industrielle CRSNG-Produits forestiers Anticosti visait a determiner les effets des hautes densites de cerf sur diverses composantes de la biodiversite, notamment les oiseaux, les insectes, les communautes vegetales et les sols. A cet effet, le premier mandat qui nous fut confie en rapport aux sols etait de recolter des echantillons dans un imposant dispositif experimental ou des densites de cerf controlees et naturelles de cerf etaient maintenues depuis plusieurs annees, sous deux couverts forestiers. Ce travail allait permettre de documenter les mecanismes de controle exerces par le cerf sur la communaute vegetale et les sols. Nous avons egalement pris l'initiative d'investiguer les sols d'une zone ou persiste une etonnante regeneration de sapin baumier (Chouinard et Filion, 2005). Par l'etude de ce systeme, nous esperions etre en mesure de proposer des methodes de gestion alternatives a celles actuellement employees pour regenerer les sapinieres sur l'Tle d'Anticosti. Actuellement, le seul moyen de permettre
a la regeneration potentielle de croitre est d'eriger des exclos de quelques kilometres carres sur des parterres de coupes, pour ensuite y appliquer une forte pression de chasse sportive. Cette methode permet generalement de diminuer les densites de cerf a des niveaux qui sont compatibles avec la regeneration des sapinieres. Le processus est par contre tres dispendieux, puisqu'il en coute approximativement 10000$ pour l'installation d'un kilometre lineaire de cloture.
Du point de vue academique, les trois chapitres presentes dans ce memoire nous permettent de decrire des mecanismes du haut vers le bas (chapitres un et trois), mais aussi du bas vers le haut (chapitre deux). Dans un ecosysteme qui a premiere vue semble presqu'exclusivement domine par des interactions du haut vers le bas de par l'effet du cerf sur les communautes vegetales, il est interessant de montrer qu'il subsiste potentiellement des mecanismes de controle originant des niveaux trophiques inferieurs (sols et plantes).
CHAPITRE 1
CLEARCUTTING AND DEER BROWSING INTENSITY INTERACT IN CONTROLLING NITRIFICATION RATES IN FOREST FLOOR HUMUS ON
ANTICOSTI ISLAND, CANADA
Reference complete
Dufresne, M., Bradley, R. L., Tremblay, J.-P., Poulin, M. et Pellerin, S. (2009). Clearcutting and deer browsing intensity interact in controlling nitrification rates in forest floor. Ecoscience 16: 361-368.
Avant-propos
L'objectif de ce chapitre etait d'identifier l'influence de l'intensite de broutement par le cerf de Virginie sur la nitrification dans l'humus forestier, six ans apres une coupe totale et dans des llots residuels de foret mature. Nous avions deux hypotheses. Premierement, nous supposons une relation negative entre la densite de cerf de Virginie et la nitrification dans l'humus, peu importe le niveau de couvert forestier. Deuxiemement, nous supposons que 1'impact de la densite de cerf sur la nitrification devrait etre plus grand dans les coupes que dans les Hots forestiers. La justification de la premiere hypothese reside dans le fait que le broutement intensif par les ongules dans les ecosystemes peu productifs comme les forets boreales engendre generalement un ralentissement des cycles biogeochimiques. Pour ce qui est de la deuxieme hypothese, nous nous appuyons sur plusieurs exemples de la litterature selon lesquels les coupes forestieres causent a court et moyen terme une augmentation de la disponibilite de l'azote dans les sols.
Nous avons done echantillonne l'humus forestier dans les 480 quadrats d'un dispositif constitue de trois replicats comprenant chacun quatre unites experimentales, soit un exclos de 10 hectares sans cerf, deux enclos a densites intermediaires (7,5 et 15 cerfs km"2) et une aire a densite naturelle de cerf (entre 27 et 56 cerfs km"2). Chaque unite renfermait 40 quadrats, egalement distribues entre deux traitements sylvicoles (coupe totale de 6 ans et forets matures). Le pourcentage de recouvrement des graminees et herbacees nitrophiles (qui ont une affinite pour l'azote sous forme de nitrate), comme l'epilobe a feuilles etroites
(Chamerion angustifolium [L.] Holub), le fraisier (Fragaria virginianct Duchesne) et le rubus
pubescent (Rubus pubescens Raf.), a egalement ete mesure dans les quadrats. En laboratoire, nous avons mesure les concentrations de nitrate des echantillons apres 30 jours d'incubation aerobie, en plus de mesurer deux indices de carbone disponible, soit la biomasse microbienne et la respiration microbienne.
La possibility de travailler avec un gradient de densites de cerf est l'un des points forts du dispositif que nous avons utilise, alors que plusieurs travaux ont deja ete faits en comparant les densites elevees et l'exclusion totale des ongules, sans densites intermediaires. Les valeurs elevees de nitrates que nous avons observees dans les coupes accueillant les plus fortes densites de cerf ne cadrent pas avec la litterature, ou il est souvent rapporte que les fortes densites d'herbivores en foret boreale diminuent la fertilite des sols via des effets indirects sur la communaute vegetale. Ces resultats nous ont permis d'avancer certaines idees novatrices en ce qui concerne l'effet de la surabondance des herbivores sur les processus du sol en foret boreale.
Pour ce travail, j'ai developpe les hypotheses en collaboration avec mon directeur Robert Bradley, j'ai procede a l'echantillonnage avec l'aide de mon co-directeur Jean-Pierre Tremblay et de Denis Duteau. J'ai procede aux extractions de nitrate et ai coordonne les activites au laboratoire pour le dosage de celui-ci, lequel a ete effectue par deux stagiaires. Je
me suis personnellement charge de la preparation des echantillons et de la mesure des indices de carbone disponible. Les donnees de vegetation ont ete pretees par Monique Poulin et Stephanie Pellerin, lesquelles ont aussi contribue a l'avancement du manuscrit. Cet article a ete publie dans la revue Ecoscience. Mes deux directeurs ont revise quelques versions preliminaires du manuscrit, en proposant des reflexions et des idees supplementaires.
CLEARCUTTING AND DEER BROWSING INTENSITY INTERACT IN CONTROLLING NITRIFICATION RATES IN FOREST FLOOR HUMUS ON
ANTICOSTI ISLAND, CANADA
Mathieu Dufresnea'b, *Robert L. Bradley3, Jean-Pierre Tremblayb, Monique Poulin0, Stephanie Pellerind
a Departement de biologie, Universite de Sherbrooke, Sherbrooke, Quebec, Canada, J1K 2R1;
b Departement de biologie, Centre d'etudes nordiques et Chaire CRSNG-Produits forestiers Anticosti en amenagement integre des ressources biologiques forestieres de Pile d'Anticosti, Universite Laval, Ste-Foy, Quebec, Canada, G1V 0A6;
c Departement de phytologie, Centre d'etudes nordiques, Universite Laval, Ste-Foy, Quebec, Canada, G1V 0A6;
d Institut de recherche en biologie vegetale, Montreal, Canada, H1X 2B2.
* Corresponding author : Telephone : 1-819-821-8000 #62080, fax : 1-819-821-8089 email : [email protected]
Abstract: Major forest disturbances such as clearcutting may increase nitrification rates in
the forest floor, but the magnitude of this NO3" flush varies among different forest ecosystems. Here, we tested the hypothesis that this variation could partly be due to differences in deer-browsing intensity. More specifically, we hypothesized that nitrification rates would decrease as deer browsing increased, and that this effect would be higher in clearcuts than in forests. Our experimental design consisted of three replicated blocks, each consisting of three plots (10-40 ha) in which white-tailed deer densities were kept at 0, 7.5, 15 individuals km"2 for six years, and a fourth plot where natural deer densities varied between 27 and 56 deer km"2. In the first year, 70% of mature balsam fir (Abies balsamea (L.) Mill.) forests in each plot were clearcut harvested. Average potential nitrification in forest floor samples was higher in clearcut than in forest plots. In clearcut plots, potential nitrification at the high deer density was about 2.5 times higher than at lower deer densities, thereby contradicting our first hypothesis. In forest plots, potential nitrification was negatively related to indices of soil available C, but was unrelated to deer density. The shrub and herb vegetation in clearcut plots was dissimilar to, and more altered by, deer browsing than the understory vegetation in forest plots. In clearcut plots, increasing deer density reduced the percent cover of nitrophilous herbaceous species and increased the percent cover of graminoid plants. Possible mechanisms that could explain the interaction between forest disturbance and deer browsing intensity in controlling the magnitude of the NO3" flush are (1) soil N inputs via feces and urine, (2) loss of soil NO3" sinks due to the disappearance of nitrophilous plant species, or (3) browser-induced succession towards rangeland plant communities that stimulate rhizodeposition and soil N dynamics.
Keywords: clearcutting, deer browsing, forest floor, nitrification, plant community
1.1 Introduction
Early studies at the Hubbard Brook Experimental Watershed demonstrated that clearcutting followed by extensive herbicide application increased the export of soil NO3" to groundwater and streams in large amounts (e.g. Likens et al., 1970). Since then, the role of forest disturbance on the flow and fate of this key soil mineral N form has received considerable attention. Over time, it has become apparent that the magnitude of the post-disturbance soil NO3" flush varies considerably among different forest ecosystems (e.g., Grenon et al., 2004). This variability has been attributed to various edaphic factors such as soil temperature and moisture (Barg & Edmonds, 1999), humus form, root density and soil available C (Lavoie & Bradley, 2003), soil pH (Paavolainen & Smolander, 1998), soil NH4+ concentrations (Bradley, 2001), soil enzyme expression (Joanisse et al., 2007), and to whether soil nitrifiers are predominantly autotrophic or heterotrophic (Bradley & Parsons, 2007). Linkages have been drawn between these edaphic factors and attributes of the plant community following disturbance, such as the chemical quality of the litter produced by early serai herbaceous vegetation (Bradley et al., 2002), the partial retention of trees (Lapointe et al., 2005), and the production of secondary metabolites by ericaceous shrubs (Joanisse et al., 2008). No studies to our knowledge have attempted, however, to show a relationship between browsing intensity by large herbivores and the magnitude of the post-harvest soil NO3" flush in forest ecosystems.
It is well documented that large herbivores such as moose, elk, bison or deer, can affect soil nitrification rates, although the direction of these effects varies among ecosystems. Positive effects are mainly observed in grasslands (e.g., Frank et al., 2000) where grazing is believed to increase rhizodeposition as a physiological response of plants to browsing. This plant response increases soil available carbon and microbial activity, which leads to positive feedbacks through soil food-webs with a concomitant increase in nitrification, which in turn
increases resource availability for plants. Indeed, there is a long story of cohabitation between browsers and plants. On the other hand, grazing commonly reduces nitrification rates in forest ecosystems because, as Pastor et al. (1993) suggested, less palatable plant species that are not consumed are those that produce low quality litter and decrease soil nutrient cycling. Thus, the effect of herbivores on forest floor nitrification rates following clearcutting ostensibly depends on the nature of the plant community, which in turn is controlled by the intensity of browsing. Given that clearcutting also changes the understory plant community (Kimmins et al, 2002), we predicted an interaction between this form of forest disturbance and deer browsing intensity in controlling soil nitrification rates.
Here, we report on a controlled grazing experiment where we tested for such an interaction using white-tailed deer (Odocoileus virginianus Zimmerman) enclosure and exclosure plots, comprising both mature balsam fir (Abies balsamea (L.) Mill.) forests and clearcuts. The study was conducted on Anticosti Island, Canada, where the population of white-tailed deer, introduced over a century ago, has risen to > 20 km" in the absence of predators (Rochette & Gingras, 2007), but may be > 50 km"2 in some areas (Tremblay et al., 2006). The effects of this natural deer density on the shrub and herbaceous vegetation, and on nitrification rates in the forest floor, were compared to experimental densities of 0, 7.5 and 15 deer km"2 that were maintained over a 6-year period. We focussed on the forest floor rather than mineral soil horizons, because this is where we find the highest fine-root biomass for nutrient uptake in coniferous forests (Pietikainen et al., 1999). We initially hypothesized that potential nitrification rates in both forests (Mclnnes et al., 1992) and regenerating clearcuts (Harrison & Bardgett, 2004) would decrease as deer browsing intensity increased. We also hypothesized that the impact of browsing would be higher in clearcuts than in forests, because we expected more palatable herbaceous species and higher nitrification rates in the non-browsed clearcuts. Results contradicted our first hypothesis, as we observed higher nitrification rates in clearcuts with high deer densities. We offer alternative explanations in
light of observed shifts in the abundance of nitrophilous and graminoid plants, and in soil available C, due to the interaction between clearcutting and deer browsing intensity.
1.2 Methods
1.2.1 Study site description and history
Anticosti Island covers an area of about 8,000 km2 and is located in the Gulf of the St-Lawrence River (49.1-50.0°N, 61.7-64.5°W), Quebec, Canada. The sub-boreal maritime climate is characterized by cool summers (15 °C in July) and cold winters (-10 °C in January). Annual precipitation generally exceeds 1000 mm, of which 40% falls as snow. The area belongs to the Eastern Balsam Fir-White Birch bioclimatic zone, according to Quebec's ecological classification system (Grondin et al., 1996). The most abundant tree species are balsam fir and white spruce (Picea glauca (Moench.) Voss.).
In 1896, 220 white-tailed deer were introduced on the island and, in the absence of natural predators, the population rapidly grew. Historical surveys estimate that deer populations across different sectors of the island have remained at 20-50 individuals km"2 for the past 80 years (Gingras et al., 1993; Potvin et al., 2000). These high densities maintain a thriving sport hunting industry, the mainstay of the local economy. Balsam fir is the principal winter forage for deer on Anticosti Island and, consequently, there is little natural regeneration of this species (Tremblay et al., 2007). For this reason, senescing balsam fir stands that were established before the introduction of deer on the island are mainly colonized with white spruce regeneration (Potvin et al., 2003), a species that is generally shunned by the deer (Sauve & Cote, 2007). Thus, it is feared that when existing balsam fir forests will have fallen, the deer population will crash (Potvin et al., 2003). In order to maintain deer populations and sustain balsam fir regeneration, commercial logging operations began in
1995, which included various silvicultural systems designed at conserving the natural diversity of plant species while creating a mosaic of food and cover habitats for the deer (Potvin & Boots, 2004). Among these, temporary deer exclosures up to 27 km in size have been erected at various locations on the island, to allow balsam fir regeneration to grow above the maximum browsing height.
1.2.2 Experimental design and field sampling
The design consisted of three replicated blocks, located 4 to 71 km apart and occurring over flat topography, each consisting of four experimental units. The first unit in each block consisted of a 10 ha exclosure from which all deer were removed (0 deer km"2). The second and third units consisted of 40 ha (7.5 deer km"2) and 20 ha (15 deer km"2) enclosures, each stocked for six consecutive years (2002-2007) with three yearling deer. The fourth unit in each block consisted of an unfenced 30 ha area where natural deer densities were estimated each year from line transect surveys of summer fecal pellets (Buckland et al., 2001), using DISTANCE 5.0 software (Thomas et al., 2002). For the three blocks, these estimated in situ densities were respectively 56, 56 and 27 deer km" over the six years. In summer 2001, clearcutting had been performed in the area where each block occurred, by harvesting all trees >9 cm dia. at breast height. The experimental units were later positioned in the three logged landscapes so that there is 30% of residual forest cover in each experimental unit. Given the random location of these forest patches, we are confident that clearcut and forest plots within each experimental unit were not located in areas that predisposed them to different nitrification rates. The resulting split-plot design included, therefore, eight treatments (i.e., four deer densities x two vegetation cover types), each replicated three times (see Tremblay et al., 2005 for a complete description). Deer were introduced in the enclosures immediately following snowmelt (early May) and were removed at the onset of snowfall (late October), since we were chiefly interested by the effects of deer on the
recovery of the ground and shrub layer following a long history of browsing. All enclosure and exclosure plots were bounded with 3 m-high wire game fencing.
Between July 6th and August 2nd 2007, 20 random quadrats ( l m ) were established in each of the 24 plots. Around the periphery of each quadrat, we collected six cores (~20 cm3) of F-layer forest floor material (Soil Classification Working Group, 1998). The cores from each quadrat were pooled into one sample, passed through a 5 mm mesh sieve, placed in a plastic bag over ice, and transported to the University of Sherbrooke for further analyses. As part of a related study, we noted the percent cover of all herbaceous and shrub species in each of the 480 quadrats.
1.2.3 Soil analyses
Potential nitrification rates were measured in all 480 forest floor samples using an aerobic incubation technique, similar to that used by Harrison & Bardgett (2004) in a similar study on red deer (Cervus elaphus L.). We first determined moisture content by weight loss after drying 5-10 g subsamples at 101°C for 72 hours. We then weighed 25-30 g of fresh forest floor material directly into mason jars and covered these with polyethylene film to prevent desiccation and allow gas exchange with ambient air. The jars were incubated for 30 d in the dark at 22°C. We then added 100 mL of IN KC1 solution to each jar and stirred these for 60 min on a rotary shaker. Solutions were passed through Whatman No.5 filter paper and the filtrates analysed colorimetrically for NO3VN concentrations (Cd-reduction + sulphanilamide) using a Technicon Autoanalyser (Pulse Instrumentation, Saskatoon, Canada).
Indices of available C were derived by soil respirometry (Bradley & Fyles, 1995a) and included measurements of basal respiration rate and microbial biomass. Basal respiration rate
was determined by weighing 5 g (dry wt. equiv.) of forest floor material from each quadrat into 73 ml gas sampling jars, allowing 5 d for soils to condition to room temperature, flushing the headspace with ambient air for 5 min, sealing jars with air-tight lids equipped with rubber septa, and sampling aliquots of headspace air with a needle and syringe after 4 h. Air samples were analysed for C 0 2 concentrations using a model CP-2002 P Micro-GC (Chrompack, Middelburg, The Netherlands) equipped with a TCD, with He as carrier gas. Room temperature was noted during each measurement, and ambient C 0 2 concentration was measured several times daily. For each measurement, ambient C 0 2 concentration was subtracted from sampled C 0 2 concentration and the difference was adjusted according to Ideal Gas Laws and centered at 22°C using Q 10=2.
Microbial biomass was determined by weighing 5 g (dry wt. equiv.) of forest floor material from each quadrat into 500 ml plastic containers, and amending these with ground and sieved (65 nm) glucose (1500 |ig C g-1 soil) (Bradley & Fyles, 1995a). The amendments were applied as 250 mg mixtures with talc and dispersed throughout the samples using a kitchen handmixer with one beater. The glucose-amended forest floor samples were then transferred into 125 ml gas sampling jars and left uncovered for 100 min to reach optimum substrate induced respiration (SIR) rates (Anderson & Domsch, 1978). These were then flushed for 5 min with ambient air, sealed for 30 min, and headspace air was analysed for C 0 2 concentration using the GC (as described above). SIR rates were converted to MB using equations derived by Anderson & Domsch (1978).
1.2.4 Statistical analyses
For each treatment, we computed potential nitrification rate, basal respiration rate and microbial biomass in the forest floor by averaging values of the 20 sample quadrats in each plot. Skewness in the nitrification data could not be removed by transformation, therefore we used DISTLM v.5 software (Anderson, 2004a), which is a distribution-free permutation-based ANOVA, to test the effects of deer density, forest cover, and their interaction on this variable. The experimental layout was a split-plot design, with deer density as the whole-plot factor and forest cover as the sub-plot factor. Where significant interactions were found, we compared the effects of deer density within each level of forest cover using simple main effects contrasts (Woodward et al., 1990). Relationships between indices of available C and log-transformed values of potential nitrification in clearcut and forest plots were analyzed using simple linear regressions (SAS Institute Inc., 2003).
In order to compare the relative impact of deer densities on plant communities in forest versus clearcut plots, we averaged the percent cover of each plant species within each treatment plot and analyzed these by principal component analysis (PCA) using the "vegan" library in "R" statistical software (Oksanen et al., 2008). The dispersion of first and second principal component scores for forest and clearcut plots were then compared using Levene's test for equality of variances (Levene, 1960). We also compared the dispersion of these data within each cover type using PERMDISP software (Anderson, 2004b), a non-parametric permutation-based multivariate test for equality of variances. Rare species accounting for less than 1% of total cover were removed from these analyses because they contributed many zero values to the data matrix. The relationships between deer densities in clearcut plots, the three most abundant nitrophilous (Godefroid, 2004; Sujetoviene, 2007) species (Chamerion
angustifolium (L.) Holub, Fragaria virginiana Duchesne and Rubus pubescens Raf.) and the
(Michx.) Nutt., Luzula acuminata Raf., Phleum pratense L., Poa sp., Schizachne
purpurascens (Torr.) Swallen, and unidentified Poaceae) were analyzed using linear and
logarithmic regression models (SAS Institute Inc., 2003).
1.3 Results
Potential nitrification rates were higher in clearcut (61.9 ± 11.2 (ug g-1) than in forest plots (25.7 ± 3.6 |xg g-1), but the response to cutting depended strongly on deer population density
( F jnt e r a c t i o n = 6 . 7 3 , PO.Ol, 8 d.f.). More specifically, potential nitrification in clearcut plots was
significantly (F=31.49, PO.OOl, 8 d.f.) higher at the highest (i.e. natural) deer density, whereas deer density had no effect on potential nitrification in forest plots (Fig. 1). Deer density had no effect on indices of available C in forest plots, but potential nitrification rate decreased as microbial biomass (P<0.05) and basal respiration rate (PO.Ol) increased (Fig. 2a, b). In contrast, potential nitrification in clearcut plots increased with microbial biomass (P<0.10), but only after eliminating one outlier (Fig. 2c).
Results from PCA based on vegetation inventory data showed a clear segregation of clearcut and forest plots along the first principal component, which accounted for 30% of the total variability in the data set (Fig. 3). Levene's test revealed a greater variability of first principal component scores (P=0.05, F=4.19, 1 d.f.) among clearcut than among forest plots. PERMDISP analysis on the other hand, which uses all of the information in the data set, revealed a lower significance level (P=0.11, F=2.68, 1 d.f.) for this comparison. The three most common nitrophilous herbaceous species found in clearcut plots decreased as deer density increased (Fig. 4a,b,c). The estimated sum of their cover was 30% in the absence of deer, and only 3% at the highest deer density (Fig. 4d). In contrast, when the sum of graminoid plant cover was regressed against deer density, it increased from 2% in the absence of deer to 18% at the highest deer density (Fig. 4e).
O) O) CO
160
140
120
100
8 0
60
-40
20 H
0I
0.0 deer / km
7.5 deer / km
2sssssa 15.0 deer/km
2natural density
i
clearcut
forest
Figure 1. Effect of white-tailed deer density on potential nitrification in the forest floor of clearcut and forest plots in balsam fir dominated stands of Anticosti Island, Quebec, Canada. Bars represent the mean value of three replicate plots; vertical lines = 1 S.D.
1.4 Discussion
Our results show that a soil NO3" flush is detectable six years after clearcutting on Anticosti Island, and that the magnitude of this flush is influenced by deer density. Given that natural deer densities may vary considerably from year to year due to factors such as winter severity,
predation rate or hunting kills, our results suggest that regional differences in the timing and magnitude of the post-disturbance soil NO3" flush can be partly attributed to temporal variations in the top-down effects of large herbivores such as white-tailed deer. Based on evidence obtained from this and other studies, we propose and discuss the merits of possible mechanisms that could explain this interaction between forest disturbance and deer browsing intensity.
Pastor et al. (1993) proposed that moosebrowsing reduces the quantity and chemical quality of plant litter in forest ecosystems, which in turn depresses C and N cycling in the forest floor. In our study, however, there was no relationship between deer browsing and these two variables in forest plots. Results from PCA and PERMDISP imply that the vegetation response to a reduction in deer browsing pressure is faster in clearcut than in forest plots, which may explain why deer density had no effect on potential nitrification in forest plots. The fact that available C and potential nitrification were negatively correlated (Fig. 2a,b) suggests that net nitrification in forest plots was controlled by microbial immobilization of NO3' (Hart et al., 1994), more so than by deer browsing effects on gross nitrification rates.
In clearcut plots, high deer densities had the opposite effect on potential nitrification than we had predicted based on results from previous studies (Pastor et al., 1993; Harrison & Bardgett, 2004), which suggests that intense browsing either increased litter quality or triggered alternative mechanisms that would lead to higher potential nitrification rates. Higher litter quality induced by browsing is unlikely, given the high correlation between digestibility and decomposability of plant material (Cornelissen et al., 2004).
0s O Uf) CM O Q_ 0.8
0.6
0.40 . 2 0 . 0 0 . 2-
0.4 0 . 6 0.4 -- 0 . 8Clearcut plots
Forest plots
# No deer
A No deer
• 7.5 deer km"
2A 7.5 deer km"
2© 15 deer km"
2A 15 deer km"
2O Nat. abund.
A Nat. Abund.
O
O
O
A
-0.8 -0.6 -0.4 -0.2 0.0 0.2 0.4 0.6
PC1 (30.3 %)
Figure 2. Ordination biplot of the 24 sample plots resulting from principal component analysis (PCA) of understory plant community composition.
Alternatively, feces and urine constitute an easily-decomposable, nutrient-rich resource that can stimulate soil C and N mineralization (Molvar et al., 1993). To corroborate this hypothesis, we would need to show that deer defecated more frequently in clearcut than in forest plots, as the effect of deer densities on potential nitrification occurred only in clearcut plots. In a prior study, Coulombe (2006) concluded that deer in these experimental plots spent roughly the same amount of time per area in clearcut and forest plots during summer, but data are lacking on their defecation habits. Even if deer were to defecate more in clearcut plots, some have argued that N inputs via feces and urine of large herbivores are too small to compensate negative effects of browsing on N cycling in forest ecosystems (Pastor et al.,
1988; Hobbs, 2006). To verify this, we gleaned data from Pletscher (1987), who estimated annual soil N inputs via the feces and urine of a mature white-tailed deer to be about 5.62 kg y"1. Extrapolating these estimates further, total soil N inputs via feces and urine in our highest natural density plots would be about 3.14 kg ha"1 y"1, or two orders of magnitude lower than recommended forest N fertilization rates (Strengbom & Nordin 2008). It has also been argued that deer fecal droppings are very local, which would reduce the likelihood of establishing sampling quadrats exactly where droppings occur (Augustine & Frank, 2001). To that point it can be argued that white-tailed deer defecate on average 12.7 times per day (Eberhart & van Etten, 1956), and assuming that each dropping affects an area of about 1 m2, it is thus possible for 26% of the total area in our high deer density plots to be littered annually with fecal droppings. Furthermore, this may be a conservative estimate, as it excludes the area affected by urine inputs. Thus, although the total annual N-input by feces and urine appears to be modest, there likely was a l-in-4 probability for each quadrat in high density plots to have been established over an area locally affected by current-year droppings. In short, there are grounds not to dismiss soil N inputs via feces and urine as a possible explanation for differences in potential nitrification among our experimental plots, but more research is required to validate this claim.
Forest plots 1.6 FC5 O o 1.2 z + 0.8 0.8 O) o 0.4 0 (a) Y = -0.067X + 1.31 l2= 0.44, P<0.05 3 4 5 6 7 Microbial biomass (mg C : g"1 soil)
O z + 1.6 1.2 0.8 0.4 0 (b) Y = -0.19X + 1.57 ^=0.49, P<0.01 4 6 8 10 12 14 Basal respiration (mg C02-C g"1 Cmlc) Clearcut plots 1.6 r5 o 1.2 2 ^ 0.8 o> o 0.4 0 (c) ®outlyer Y = 0.18 X +0.23 0.23, P<0.10 3.5 4.0 4.5 5.0 5.5 6.0 6.5 Microbial biomass (mg Cmic g"1 soil)
O)
o
5 6 7 8 9 10 11 12 13 Basal respiration (mg C02-C g"1 Cmlc)
Figure 3. Relationship between two indices of available C (microbial biomass and basal respiration rate) and potential nitrification in the forest floor of clearcut and balsam fir dominated forest plots. Outlier point shown in frame (c) was excluded from linear regression analysis. Regression model (dashed line) of data in frame (d) is non-significant (n.s. = P>0.10).
2 5 §•015 ! § 10 I® .5 8 6> = m U. 2 0 25 : "> o 30 ' 01 s o g 8 20 10 m 40 cn 30 ~o -c o ® .1 § 20 E 8 5^10 CD (a) • Y = 16.35(e"0067X) R2 = 0.54, P<0.01 R2 = 0.54, P<0.01 • \ • • • ~ • 8 6 • 8 « 20 <b <u 15 0 a. 10 S 10 ^ 5 u: 0 sn 0) 0 a> 40 (b) • Y = 4.18(e"0055x) • . R2 = 0.52, P<0.01 • • — • (c) • Y = - 0 . 1 6 X + 10.92 R2 = 0.34, P<0.05 • • • • • • <d) Y = 30.64(e"° M1x) • R2 = 0.59, P<0.01 • • (e) Y = 0.28X + 2.21 R2 = 0.49, P<0.05 * - — f — " • 0 20 40 Deer density (# individuals km"2
60
Figure 4. The effect of deer population size on the percent cover of three nitrophilous plants species (a,b,c), on the sum their cover (d), and on total percent cover of eight graminoid plant species in 7 year-old clearcut plots following six consecutive years of controlled grazing.
A second plausible explanation for observing higher NO3" concentrations in high deer density clearcut plots is a shift in plant community composition in these plots that would stimulate potential nitrification. Although several studies have reported an increase in the recruitment of white spruce due to browsing (Rooney & Waller, 2003; Mclnnes et al., 1992), which would ostensibly reduce soil nitrification, such is not the case on Anticosti Island where white spruce recruitment is as high in deer exclosures as in natural deer density plots following eight decades of chronic heavy browsing (Tremblay et al., 2007). Even if white spruce recruitment had been higher in high deer density plots, the relative slow growth and high needle longevity of this species implies that its presence would have little effect on soil nutrient cycling in the first decade following disturbance. It is essential to understand that the potential nitrification assay we used considers the initial (i.e., pre-incubation) soil NO3" pool to be part of the NO3" pool that is potentially available (Powers, 1980). Hence, the elimination of fast-growing early-seral nitrophilous species such as C. angustifolium, F.
virginiana and R. pubescens at high deer densities may have increased pre-incubation soil
NO3" pools and, consequently, potential nitrification in clearcut plots. The importance of the vegetation sink in controlling forest floor NO3" following clearcutting has been inferred by various root trenching experiments (e.g. Vitousek et al., 2008) and N budget studies (Kimmins et al., 2002).
A third plausible explanation for the higher soil NO3" concentrations measured on high deer density clearcut plots concerns the progressive conversion of early-seral forest vegetation to graminoid range land plant communities. Given the small size of our sampling quadrats, data shown in Fig. 4e do not represent the full extent of this phenomenon. In a recent landscape-level study of plant community dynamics on Anticosti Island, Barrette et al. (in prep.) concluded that about two-thirds of recently disturbed forest sites have regressed toward an open rangeland structure dominated by graminoids, notably Calamagrostis canadensis. Although some have claimed that grasses are rarely consumed by white-tailed deer (e.g.
Horsley et al, 2003), visual observations of their feeding habits on Anticosti Island has confirmed that C. canadensis is extensively browsed, especially the young shoots (Tesky, 1992). This perennial grass species is tolerant to browsing because of its basal leaf meristem (Gloser, 2002) and, like most grasses, it is expected to shunt a large proportion of its photosynthate belowground (Jackson et al., 1997). Increased rhizodeposition, resulting from a browser-induced succession towards rangeland plant communities, could stimulate microbial growth and soil nitrogen dynamics (Bradley & Fyles, 1995b; Frank et al., 2000).
In summary, our results confirm that clearcutting on Anticosti Island may increase nitrification rates in the forest floor. We have also shown that differences in deer-browsing intensity may significantly affect the magnitude of this NO3" flush. Indeed, the two proposed explanations that address plant community composition and rhizodeposition are the most plausible. We conclude, therefore, that the size of large herbivore populations be factored into conceptual or predictive model calculations of forest soil N cycling.
1.5 Acknowledgements
The study was funded by the NSERC-Produits forestiers Anticosti Industrial Research Chair. We are grateful to Dr. W. F. J. Parsons for statistical advice.
1.6 References
Anderson, M.J., 2004a. DISTLM v.5: A FORTRAN computer program to calculate a distance-based multivariate analysis for a linear model. Department of Statistics, University of Auckland, New Zealand.
Anderson, M.J., 2004b. PERMDISP: a FORTRAN computer program for permutational analysis of multivariate dispersions (for any two-factor ANOVA design) using permutation tests. Department of Statistics, University of Auckland, New Zealand.
Anderson, T.H., & K.H. Domsch, 1978. A physiological method for the quantitative measurement of microbial biomass in soil. Soil Biology & Biochemistry, 10: 215-221.
Augustine, D.J., & D.A. Frank, 2001. Effects of migratory ungulates on spatial heterogeneity of soil nitrogen properties on a grassland ecosystem. Ecology, 82: 3149-3162.
Barg, A.K., & R.L. Edmonds, 1999. Influence of partial cutting on site microclimate, soil nitrogen dynamics, and microbial biomass in Douglas-fir stands in western Washington. Canadian Journal of Forest Research, 29: 705-713.
Barrette, M., Belanger, L. & L. DeGrandpre. In prep. Gradual cover degradation and ecological shift of overmature primeval balsam fir forest under novel chronic deer browsing, Anticosti Island, Quebec.
Bradley, R.L., 2001. An alternative explanation for the post-disturbance NO3" flush in some forest ecosystems. Ecology Letters, 4:412-416.
Bradley, R.L., & J.W. Fyles, 1995a. A kinetic parameter describing soil available carbon and its relationship to rate increase in C mineralization. Soil Biology & Biochemistry, 27:
167-172.
Bradley, R.L. & J.W. Fyles, 1995b. Growth of paper birch (Betula papyrifera) seedlings increases soil available C and microbial acquisition of soil-nutrients. Soil Biology & Biochemistry, 27: 1565-1571.
Bradley, R.L. & W.F.J. Parsons, 2007. Net and gross mineral N production rates at three levels of forest canopy retention: evidence that NH4+ and NO3" dynamics are uncoupled. Biology and Fertility of Soils, 43: 599-602.
Bradley, R.L., Kimmins, J.P. & W.L. Martin, 2002a. Post-clearcutting chronosequence in the B.C. coastal western hemlock zone: II. Tracking the assart flush. Journal of Sustainable Forestry, 14: 23-43.
Bradley, R.L., Kimmins, J.P. & W.L. Martin, 2002b. Post-clearcutting chronosequence in the B.C. coastal western hemlock zone: III. Sinks for mineralised or dissolved organic N. Journal of Sustainable Forestry, 14: 45-68.
Buckland, S.T., Anderson, D.R., Burnham, K.P., Laake, J.L., Borchers, D.L. & L. Thomas. 2001. Introduction to distance sampling: estimating abundance of biological populations. Oxford University Press, New York.
Cornelissen, J.H.C., Quested, H.M., Gwynn-Jones, D., Van Logtestijn, R.S.P., De Beus, M.A.H., Kondratchuk, A., Callaghan, T.V. & R. Aerts, 2004. Leaf digestibility and litter decomposability are related in a wide range of subarctic plant species and types. Functional Ecology, 18: 779-786.
Coulombe, M.-L.,2006. Effets de la densite de population sur le comportement d'approvisionnement et le budget d'activite du cerf de Virginie (Odocoileus virginianus) a File d'Anticosti. Memoire de maitrise, Universite Laval, Quebec.
Eberhardt, L. & R.C. van Etten, 1956. Evaluation of the pellet group count as a deer census method. Journal of Wildlife Management, 20: 70-74.
Frank, D.A., Groffman, P.M., Evans, R.D. & B.F. Tracy, 2000. Ungulate stimulation of nitrogen cycling and retention in Yellowstone Park grasslands. Oecologia, 123: 116-121. Gingras, A., Potvin, F. & B. Rochette, 1993. Inventaire aerien du cerf dans trois zones forestieres de l'lle d'Anticosti, en relation avec une epidemie apprehendee d'arpenteuse de la pruche. Rapport 2132. Ministere du Loisir, Chasse et Peche, Quebec, Canada.
Gloser, V., 2002. Seasonal changes of nitrogen storage compounds in a rhizomatous grass Calamagrostis epigeios. Biologia Plantarum, 45: 563-568.
Godefroid, S. 2001. Temporal analysis of the Brussels flora as indicator for changing environmental quality. Landscape and Urban Planning, 52: 203-224.
Grenon, F., Bradley, R.L., Joanisse, G., Titus, B.D. & C.E. Prescott, 2004. Mineral N availability for conifer growth following clearcutting: responsive versus non-responsive ecosystems. Forest Ecology and Management, 188: 305-316.
Grondin, P., Ansseau, C., Belanger, L., Bergeron, J.-F., Bergeron, Y., Bouchard, A., Brisson, J., De Grandpre, L., Gagnon, G., Lavoie, C., Lessard, G., Payette, S., Richard, P.J.H., Saucier, J.-P., Sirois, L. & L. Vasseur, 1996. Ecologie forestiere. Pages 134-279 in Ordre des ingenieurs forestiers du Quebec (eds.). Manuel de Foresterie. Presses de l'Universite Laval, Quebec, Canada.
Harrison, K.A. & R.D. Bardgett, 2004. Browsing by red deer negatively impacts on soil nitrogen availability in regenerating native forest. Soil Biology & Biochemistry, 26:
115-126.
Hart, S.C., Nason, G.E., Myrold, D.D. & D.A. Perry, 1994. Dynamics of gross nitrogen transformations in an old-growth forest: the carbon connection. Ecology, 75: 880-891.
Hobbs, N.T., 2006. Large herbivores as sources of disturbance in ecosystems. Pages 261-288 In K. Danell, R. Bergstrom, P. Duncan, & J. Pastor (eds.). Large Herbivore Ecology, Ecosystem Dynamics and Conservation. Cambridge University Press, Cambridge, U.K. Horsley, S.B., Stout, S.L. & D.S. DeCalesta, 2003. White-tailed deer impact on the vegetation dynamics of a northern hardwood forest. Ecological Applications, 13: 98-118. Jackson, R.B., Mooney, H.A. & E.D. Schulze, 1997. A global budget for fine root biomass, surface area, and nutrient contents. Proceedings of the National Academy of Sciences of the United States of America, 94: 7362-7366.
Joanisse, G.D., Bradley, R.L., Preston, C.M. & A.D. Munson, 2007. Soil enzyme inhibition by condensed litter tannins may drive ecosystem structure and processes: the case of Kalmia angustifolia. New Phytologist, 175: 535-546.
Joanisse, G.D., Bradley, R.L., & C.M. Preston. 2008. Do late-successional tannin-rich plant communities occurring on highly acidic soils increase the DON/DIN ratio? Biology and Fertility of Soils, 44: 903-907.
Kimmins, J.P., Martin, W.L. & R.L. Bradley, 2002. Post-clearcutting chronosequence in the B.C. coastal western hemlock zone III. Sinks for mineralized or dissolved organic N. Journal of Sustainable Forestry, 14:45-68.
Lapointe, B., Bradley, R.L. & B. Shipley. 2005. Mineral nitrogen and microbial dynamics in the forest floor of clearcut or partially harvested successional boreal forest stands. Plant and
Soil, 271: 27-37.
Lavoie, M. & R.L. Bradley, 2003. Short-term increases in relative nitrification rates due to trenching in forest floor and mineral soil horizons of different forest types. Plant and Soil, 252: 367-384.
Levene, H., I960., Robust tests for equality of variances. Pages 278-292 in Olkins, I. (ed.). Contributions to Probability in Statistics. Stanford University Press, Stanford, U.S.
Likens, G.E., Bormann, F.H., Johnson, N.M., Fisher, D.W. & R.S. Pierce, 1970. Effects of clearcutting and herbicide treatment on nutrient budgets in the Hubbard Brook watershed ecosystem. Ecological Monographs, 40: 23-47.
Mclnnes, P.F., Naiman, R.J., Pastor, J. & Y. Cohen, 1992. Effects of moose browsing on vegetation and litter of the boreal forest, Isle Royale, Michigan, USA. Ecology, 73: 2059-2075.
Molvar, E.M., Bowyer, R.T. & V. van Ballenberghe, 1993. Moose herbivory, browse quality, and nutrient cycling in an Alaskan treeline community. Oecologia, 94: 472-479. Oksanen, J., Kindt, R., Legendre, P., O'Hara, B., Simpson, G.L. & M.H.H. Stevens, 2008. vegan : Community Ecology Package. R package version 1.11-0. http://cran.r-project.org/, http://vegan.r-forge.r-project.org/
Paavolainen, L. & A. Smolander, 1998. Nitrification and denitrification in soil from a clear-cut Norway spruce (Picea abies) stand. Soil Biology & Biochemistry 30: 775-781.
Pastor, J., Naiman, R.J., Dewey, B & P. Mclnnes, 1988. Moose, microbes, and the boreal forest. Bioscience, 38: 770-777.
Pastor, J., Dewey, B., Naiman, R.J., Mclnnes, P.F. & Y. Cohen, 1993. Moose browsing and soil fertility in the boreal forests of Isle Royale National Park. Ecology, 74: 467-480.
Pietikainen, J., Vaijarvi, E., Ilvesniemi, H., Fritze, H. & C.J. Westman, 1999. Carbon storage of microbes and roots and the flux of C 0 2 across a moisture gradient. Canadian Journal of Forest Research, 29: 1197-1203.
Pletscher, D.H., 1987. Nutrient budgets for white-tailed deer in New England with special reference to sodium. Journal of Mammalogy, 68: 330-336.
Potvin, F. & B. Boots, 2004. Winter habitat selection by white-tailed deer on Anticosti Island 2: relationship between deer density from an aerial survey and the proportion of balsam fir forest on vegetation maps. Canadian Journal of Zoology, 82: 671-676.
Potvin, F., Beaupre, P., Gingras, A. & D. Pothier, 2000. Le cerf et les sapinieres de File d'Anticosti. Rapport 4286-00-02, Societe de la Faune et des Pares du Quebec, Quebec, Canada.
Potvin, F., Beaupre, P. & G. Laprise, 2003. The eradication of balsam fir stands by white-tailed deer on Anticosti Island, Quebec: a 150 year process. Ecoscience, 10: 487-495.
Powers, R.F., 1980. Mineralizable soil nitrogen as an index of nitrogen availability to forest trees. Soil Science Society of America Journal, 44: 1314-1320.
Rochette, B. & A. Gingras, 2007. Inventaire aerien du cerf de Virginie de Pile d'Anticosti -Ete 2006. Direction de l'amenagement de la faune de la Cote-Nord. Ministere des ressources naturelles et de la faune, Quebec, Canada.
Rooney, T.P. & D.M. Waller, 2003. Direct and indirect effects of white-tailed deer in forest ecosystems. Forest Ecology and Management, 181: 165-176.
SAS Institute Inc., 2003. SAS 9.1 - The Power to Know. SAS Institute Inc. Cary, NC.
Sauve, D.G. & S.D. Cote, 2007. Winter forage selection in white-tailed deer at high density: Balsam fir is the best of a bad choice. Journal of Wildlife Management, 71: 911-914.
Soil Classification Working Group, 1998. The Canadian System of Soil Classification (3rd ed.). NRC Research Press, Ottawa, Canada. 164 pp.
Strengbom, J. & A. Nordin, 2008. Commercial forest fertilization causes long-term residual effects in ground vegetation of boreal forests. Forest Ecology and Management, 256:
2175-2181.
Sujetoviene, G. 2007. Plants of a coniferous forest as indicators of nitrogen enrichment in soils under the influence of atmospheric deposition. Pp. 122-123 In Proceedings of the Eco-Balt International Conference (May 10-11, 2007), Riga, Latvia.
Tesky, J.L., 1992. Calamagrostis canadensis. In Fire Effects Information System. U.S. Department of Agriculture, Forest Service, Rocky Mountain Research Station, Fire Sciences Laboratory. Available online: http://www.fs.fed.us/database/feis/.
Thomas, L., Laake, J.L., Strindberg, S., Marques, F.F.C., Buckland, S.T., Borchers, D.L., Anderson, D.R., Burnham, K.P. Hedley, S.L., Pollard, J.H. & J.R.B. Bishop, 2002. Distance 4.0 V. Release 1. Research Unit for Wildlife Population Assessment, University of St. Andrews, UK.
Tremblay, J.P., Huot, J. & F. Potvin, 2006. Divergent nonlinear responses of the boreal field layer along an experimental gradient of deer densities. Oecologia, 150: 78-88.
Tremblay, J.P., Huot, J. & F. Potvin, 2007. Density-related effects of deer browsing on the regeneration dynamics of boreal forests. Journal of Applied Ecology, 44: 552-562.
Tremblay, J.P., Thibault, I., Dussault, C., Huot, J. & S.D. Cote, 2005. Long-term decline in white-tailed deer browse supply: can lichens and litterfall act as alternative food sources that preclude density-dependant feedbacks? Canadian Journal of Zoology, 83: 1087-1096.
Woodward, J.A., Bonett, D.G. & M.-L. Brecht, 1990. Pages 171-223 in Introduction to Linear Models and Experimental Design. Harcourt Brace Jovanovich Inc., San Diego, CA.
CHAPITRE 2
SOIL DEPTH AND CLAY CONTENT AS CONTRIBUTING FACTORS TO POST-DISTURBANCE BALSAM FIR AND PAPER BIRCH REGENERATION UNDER
HEAVY BROWSING FROM DEER ON ANTICOSTI ISLAND, CANADA
Reference complete
Dufresne, M„ Bradley, R. L., Tremblay, J.-P. et Cote, S.D. (2010). Soil depth and clay content as contributing factors to post-disturbance balsam fir and paper birch regeneration under heavy browsing from deer on Anticosti Island, Canada. Soumis a Ecoscience, XX: 000-000.
Avant-propos
L'objectif de ce chapitre est d'identifier certaines variables du sol qui pourraient influencer le succes de regeneration de la sapiniere a bouleau blanc de l'Est en contexte de forte pression d'herbivorie par le cerf de Virginie. L'hypothese de base est que certaines caracteristiques du sol correspondant a une faible fertilite (faible profondeur, faible contenu en argile, faibles concentrations des cations basiques, pH acide) facilitent la regeneration naturelle du sapin baumier en lui conferant de fortes concentrations de composes secondaires de defense dans les feuilles.
Pour verifier nos hypotheses, nous avons concentre nos efforts sur un secteur precis de Pile d'Anticosti. Cette zone situee dans le centre sud de Pile, dominee par des peuplements de sapin baumier, a subi une epidemie d'arpenteuse de la pruche (Lambdina fiscellaria