Editorial Manager(tm) for Water Management Manuscript Draft
Manuscript Number: WATER-D-09-00042R3
Title: River modelling and flood mitigation in a Belgian catchment Article Type: River Modelling and Flood Mitigation
Corresponding Author: Mr Bruno Khuat Duy, PhD
Corresponding Author's Institution: University of Liege; F.R.S.-FNRS First Author: Bruno Khuat Duy, PhD
Order of Authors: Bruno Khuat Duy, PhD; Pierre Archambeau, PhD; Benjamin J Dewals, PhD; Sebastien Erpicum, PhD; Michel Pirotton, Pr
Abstract: This paper describes the steps followed to propose solutions to recurring flooding problems in a Belgian catchment. Firstly, the hydraulic capacity (maximum discharge before bank overflow) of the cross sections was computed all along the river by an iterative 1D steady-state approach. In order to carry out these simulations, cross sections from site surveys of the river were integrated into the model, as well as hydraulic structures such as culverts, footbridges, and pipes. Secondly, the flooding problem was analysed with a time-dependant approach consisting of simulating floods following extreme rainfall events. The hydrological aspect was studied in a spatially distributed way using a multi-layer hydrological model. The available data on the basin such as the digital elevation model (DEM), the landuse, and the pedology were exploited to identify the basic modelling parameters. The hydrological contribution was routed by a 1D network resulting from the merging of the DEM-based and the cross section-based river networks. According to the results of the aforementioned steps, various local and catchment-wide solutions against flooding were proposed and analyzed. The comparison of simulated situations before and after these improvements allowed checking the effectiveness of the proposed solutions.
1 2 3 4 5 6 7 8 9 10 11 12 13 14 15 16 17 18 19 20 21 22 23 24 25 26 27 28 29 30 31 32 33 34 35 36 37 38 39 40 41 42 43 44 45 46 47 48 49 50 51 52 53 54 55 56 57 58 59
Journal: Proceedings of ICE, Water Management
Paper Title: River modelling and flood mitigation in a Belgian catchment
Keywords: hydrology, distributed, river management, flood, hydraulic structures Date : 08/12/2009
Authors :
First name Last name Qualifications Affiliations
Bruno Khuat Duy PhD a,b
Pierre Archambeau PhD a
Benjamin J. Dewals PhD a,b
Sébastien Erpicum PhD a
Michel Pirotton Professor, PhD a
Affiliations: a
Department ArGEnCo, Research unit of Applied Hydrodynamics and Hydraulic Constructions, University of Liege, Belgium
b
Fund for Scientific Research F.R.S.-FNRS, Belgium
Contact :
Bruno Khuat Duy – emails: [email protected]; [email protected] Number of words (incl. Title, abstract and references) : 4375
Number of words (excl. Title, abstract and references) : 3720 Number of tables : 1
Number of figures : 11 *Main Text
1 2 3 4 5 6 7 8 9 10 11 12 13 14 15 16 17 18 19 20 21 22 23 24 25 26 27 28 29 30 31 32 33 34 35 36 37 38 39 40 41 42 43 44 45 46 47 48 49 50 51 52 53 54 55 56 57 58 Abstract
This paper describes the steps followed to propose solutions to recurring flooding problems in a Belgian catchment. Firstly, the hydraulic capacity (maximum discharge before bank overflow) of the cross sections was computed all along the river by an iterative 1D steady-state approach. In order to carry out these simulations, cross sections from site surveys of the river were integrated into the model, as well as hydraulic structures such as culverts, footbridges, and pipes. Secondly, the flooding problem was analysed with a time-dependant approach consisting of simulating floods following extreme rainfall events. The hydrological aspect was studied in a spatially distributed way using a multi-layer hydrological model. The available data on the basin such as the digital elevation model (DEM), the landuse, and the pedology were exploited to identify the basic modelling parameters. The hydrological contribution was routed by a 1D network resulting from the merging of the DEM-based and the cross section-based river networks. According to the results of the aforementioned steps, various local and catchment-wide solutions against flooding were proposed and analyzed. The comparison of simulated situations before and after these improvements allowed checking the effectiveness of the proposed solutions.
1 2 3 4 5 6 7 8 9 10 11 12 13 14 15 16 17 18 19 20 21 22 23 24 25 26 27 28 29 30 31 32 33 34 35 36 37 38 39 40 41 42 43 44 45 46 47 48 49 50 51 52 53 54 55 56 57 58 59 1. Introduction
As extreme rainfall events are occurring increasingly, efficient management of river basins is necessary. This implies careful studies of the catchments, including both hydrological and hydraulic aspects of the flood production mechanisms. A detailed hydraulic study of the river is necessary to estimate the acceptable discharges and to point out the problems leading to local overflowing. The hydrological part is required to compute the runoff production during a particular rainfall event, which is necessary to assess the efficiency of solutions such as the water storage in storm basins. In this paper, an application of a complete modelling system developed at the University of Liege (WOLF) to the “Rieu des Barges” river catchment is described. The modelling steps are detailed, showing how the available data (such as the digital elevation model, landuse maps, river cross sections and hydraulic structure descriptions) were exploited to derive potential solutions to mitigate the floods.
2. The modelling system WOLF
The herein described study was completed using the modelling system “WOLF”, developed at the University of Liege. WOLF includes a set of complementary and interconnected modules for simulating free surface flows: process-oriented hydrology, 1D & 2D hydrodynamics (Dewals et al., 2008b, Roger et al., 2009, Erpicum et al., 2009b), sediment (Dewals et al., 2008a) or pollutant transport, air entrainment, as well as an optimisation tool based on Genetic Algorithms. Other functionalities of WOLF 2D include the use of moment of momentum equations, the application of the cut-cell method, as well as computations considering vertical curvature effects by means of curvilinear coordinates in the vertical plane (Dewals et al., 2006).
The hydrological component of the modelling system WOLF is physically-based and spatially distributed. It computes the main hydrological processes using a multi-layer model with depth-integrated equations (figure 1). The overland flow is computed using the diffusion wave equation,
1 2 3 4 5 6 7 8 9 10 11 12 13 14 15 16 17 18 19 20 21 22 23 24 25 26 27 28 29 30 31 32 33 34 35 36 37 38 39 40 41 42 43 44 45 46 47 48 49 50 51 52 53 54 55 56 57 58
which is obtained by ignoring the inertia terms compared with the gravitational ones, friction and pressure heads in the well-known shallow water equations (Archambeau et al., 2004). The velocities are linked to the friction slope using the Manning-Strickler friction law.
Figure 1: Flow layers computed in the hydrological model
The infiltration is calculated using a Green-Ampt infiltration law (Chow et al., 1988) with the impact of the landuse taken into account by using effective values for the infiltration coefficients, as proposed by Nearing (Nearing et al., 1996). The subsurface flow is computed with the depth-integrated Darcy equations. The subsurface flow is therefore modelled with a diffusive wave equation similar to the surface flow equation.
The river flow inputs generated from the hydrology module are routed in the river network by way of the 1D module, which solves the conservative form of the 1D Saint-Venant equations. The hydrological inflows are treated as lateral inputs (source terms). The hydrological and the river flow equations are therefore uncoupled. The spatial discretisation of the 1D equations is performed by a widely used finite volume method. Flux treatment is based on an original flux-vector splitting technique developed for WOLF. Fluxes are split according to the sign of the flow velocity, requiring a suitable downstream or upstream reconstruction for both parts of the convective term according to a stability analysis (Erpicum et al., 2009a). Efficiency, simplicity and low computational cost are the main advantages of this scheme. An explicit Runge-Kutta scheme or an implicit algorithm (based on the GMRES) is applied to solve the ordinary differential equation operator, and an original treatment of the confluences based on Lagrange multipliers allows the modelling of large river networks in a single way. Both free-surface and pressurized flows can be modelled simultaneously using the same set of equations thanks to the Preissmann Slot artifice (Preissmann, 1961). Indeed, it is well known that the only difference between the Saint-Venant equations for open channel flow and the incompressible pressurized flows set of equations lies in the pressure gradient term. Analytical
1 2 3 4 5 6 7 8 9 10 11 12 13 14 15 16 17 18 19 20 21 22 23 24 25 26 27 28 29 30 31 32 33 34 35 36 37 38 39 40 41 42 43 44 45 46 47 48 49 50 51 52 53 54 55 56 57 58 59
developments, initially presented by Preismann, show that this difference is overcome by adding a narrow slot at the top of the pressurized flows. In this way, pressurized flow can be calculated through the free-surface set of equations.
A number of other sophisticated computational rainfall-runoff models have been developed and implemented in the last two decades, including Mike Basin and Mike SHE (Graham and Butts, 2005), HEC HMS (Feldman, 2000) or SWMM (Rossman, 2004) to name just a few. In contrast with Mike Basin, which is based on the lumped conceptual hydrological model NAM (DHI, 2000), the present modelling system WOLF relies on a spatially distributed and process-oriented approach like in MIKE SHE. In addition, similarly with Mike SHE, fully dynamic flow modelling is used in WOLF to compute flood routing in rivers, while simplified approaches such as Muskingum-Cunge or kinematic wave approximation are used in Mike Basin, HEC HMS and SWMM. However, the later models enable continuous simulations, while WOLF applies mainly for event-based simulations.
3. The “Rieu des Barges” basin
The “Rieu des Barges” is a river located in Belgium. Following some important rainfall events in the last years, the river basin suffered from numerous damages from overland flow and river bank overflows. The flood frequency and subsequent damage brought the need for a study to propose mitigation solutions. The total surface of the river basin is 38.6 km². The basin slopes are variable, with a mean value of 2 %. The land cover is mainly composed of crops (77 %) and meadows (14 %). The urban areas cover 3.5 % of the basin.
4. Methodology
The study was completed following 4 main steps. The first one covered the pre-processing of the hydrological data (for the runoff computation) and of the hydraulic data (for the river flow computation). In the second one, the “Rieu des Barges” was studied from a hydrodynamic point of view, in order to draw conclusions on the acceptable discharges, sensitive areas and overflowing
1 2 3 4 5 6 7 8 9 10 11 12 13 14 15 16 17 18 19 20 21 22 23 24 25 26 27 28 29 30 31 32 33 34 35 36 37 38 39 40 41 42 43 44 45 46 47 48 49 50 51 52 53 54 55 56 57 58
zones. In the third step, a coupled hydrology-hydrodynamics approach was used to study a flood event. The fourth step consisted in analysis of the preceding results and in an assessment of mitigation solutions.
5. Data processing
The necessary data were prepared using the GIS interface of WOLF, using pre-processing tools to convert raw data. The soil properties were extracted from pedologic maps using pedotransfer functions (Rawls and Brakensiek, 1989). The Digital Elevation Model (DEM) was processed in order to remove depressions, using an algorithm proposed by Martz and Garbrecht (Martz and Garbrecht, 1999), and a “stream burning” method (Saunders, 1999, Callow, 2007) was applied in order to make the DEM-based flowpaths coherent with the real ones obtained from site surveys. Specific engineering structures which significantly modify the flowpaths were taken into account in this process. For example, a high speed railway crosses the catchment, and the flows are therefore re-routed through drainage channels along the railway.
Site measurements of the cross sections were available on the two main rivers of the catchment (“Rieu des Barges” and “Rieu de Taintignies”), as well as a description of existing hydraulic structures along these rivers (such as culverts and pipes). A few pre-processing steps were necessary to prepare this data for the 1D simulations.
Some cross sections were only composed of 3 points (corresponding approximately to the lower point of the bed and to the tops of the two banks. Linear interpolation between these points would have produced a triangular section which would not have been realistic (figure 2, dotted line). Therefore, additional points were added to these sections using fixed values for the bank angles (30° from the vertical axis) and the bed angle (5° from the horizontal axis). These values are based on visual site estimations. Moreover, as most of the cross section data were limited to the top of the banks, an enlargement was added to every section to represent the floodplains (figure 2). This
1 2 3 4 5 6 7 8 9 10 11 12 13 14 15 16 17 18 19 20 21 22 23 24 25 26 27 28 29 30 31 32 33 34 35 36 37 38 39 40 41 42 43 44 45 46 47 48 49 50 51 52 53 54 55 56 57 58 59
enlargement of the section width at the top of the banks was arbitrarily fixed at 10 m. As the aim of the study is a situation without any bank overflowing, this value does not have any impact on the simulations of the final state (river with various improvements for the flood mitigation). Therefore, the purpose of this enlargement is only to improve the analysis of the initial situation, and it was not worth carrying out additional site surveys to refine this estimation.
Figure 2: Typical pre-processing of the cross section data.
The river sections were then interpolated on a regular mesh (5 m cells), and the hydraulic structures were added. The closed-sections were treated the same way as open sections, except that an artificial slot was added at the top of the section (figures 3a and 3b). In the classical Preissmann theory, the slot width reflects the pipe dilation and the water compressibility under a pressure fluctuation, and has therefore very small orders of magnitude (about 10-5 m for the pipes existing in the “Rieu des Barges” river) (Kerger et al., 2009). Using this value would have led to extremely small time steps. However, in hydrological simulations, it is not necessary to compute highly transitive phenomena such as a water hammer. As the evolution of the flow over time is much more gradual, a much larger Preissmann slot can be used to compute the pressurized flows (a 0.1 m width was used in this application).
Figure 3: Modelling of closed sections.(a) Real configuration. (b) Modelling with the Preissmann slot. (c) Modelling with the Preissmann slot and an additional enlargement.
Using these pre-processing steps to prepare the data from site surveys, the main river can be modelled with the 1D model. In order to cover the whole catchment, the river network had to be completed using other data inputs. An automatic process was developed in order to combine the 1D network created previously (using the cross section data and including the hydraulic structures) with a second 1D river network generated on the basis of the DEM (modified as described above). Both networks were merged using the following steps:
1 2 3 4 5 6 7 8 9 10 11 12 13 14 15 16 17 18 19 20 21 22 23 24 25 26 27 28 29 30 31 32 33 34 35 36 37 38 39 40 41 42 43 44 45 46 47 48 49 50 51 52 53 54 55 56 57 58
the river branches were split into multiple parts at each characteristic point (confluences and ends) of both networks;
the DEM-based river parts were replaced by the corresponding parts from the other (more accurate) network, where available;
special treatments were applied to deal with the inconsistencies between both networks, such as bed level discontinuities at the junctions;
the split river parts were merged back to form the complete river network.
The resulting network therefore covers the whole catchment, and includes detailed data such as cross sections and hydraulic structures where they were available.
Existing and planned storm basins were also included in the simulations. In particular, two storm basins have a special operating mode. The first one, located on a tributary of the main river (figure 4 – basin n°1), collects the water from the drainage system of a part of the railway (which crosses the tributary), and the river discharge exceeding 1 m³/s. Theses inputs are routed to a buffer tank and are then pumped to the main reservoir. The stored water is evacuated through an opening, with a discharge function of the water depth in the basin. The real water depth-volume relations were therefore implemented for the simulations.
Figure 4: Position of existing and planned storm basins. The black lines represent the river and the catchment limits, and the gray line stands for the drainage paths along the railway.
The second basin (figure 4 – basin n°2), receives the inputs from another portion of the railway drainage system. The water simply enters the basin by gravity. The water is evacuated through two constant discharge pumps. Each one starts when the water surface in the basin reaches a specific elevation (43.45 m and 44.16 m above sea level), and stops when the reservoir is nearly empty (water surface elevation = 42.24 m). This operating mode implies a discontinuous outflow. Moreover,
1 2 3 4 5 6 7 8 9 10 11 12 13 14 15 16 17 18 19 20 21 22 23 24 25 26 27 28 29 30 31 32 33 34 35 36 37 38 39 40 41 42 43 44 45 46 47 48 49 50 51 52 53 54 55 56 57 58 59
as the first pump only activates when the level reaches 43.45 m, the initial water surface elevation (at the beginning of the storm) was fixed to this value in order to represent the worst case.
6. Simulations and results.
As mentioned in the methodology, the river was first studied using a purely hydrodynamic approach. A steady-state discharge was set in the river as a linear function of the drained basin. This discharge was progressively increased to a maximum of 0.35 m³/s/km² (over this value, most of the river overflows), and, for each point of the river, the value corresponding to the first overflow was noted. This method therefore links an “acceptable discharge” to each point of the river and shows the limiting cross sections. The river sections that did not overflow at the maximum simulated discharge (and have therefore an acceptable discharge over 0.35 m³/s/km²) are not represented in figure 5. Figure 5: Acceptable discharge in the river before bank overflow.
In Figure 5 and subsequent similar graphs, the distance along the river is measured from the most upstream point where cross section data is available (this point has a drainage basin area of 2.2 km²). The large dots show the cells where cross section data were available from site surveys, while the small ones correspond to the cells with interpolated cross sections. As can be seen in this figure, the acceptable discharge increases towards the downstream end of the river, but many restrictive areas present overflows at relatively low discharges.
The free surface corresponding to a fixed discharge can also be plotted all along the river. It allows a better understanding of the flow dynamics and emphasises the parts of the river where an important head loss exists.
Figure 6: Water levels in the river for a linear input of 0.25 m³/s/km².
Each sensitive area was studied to find the causes of the overflow. Following this analysis, various local solutions (such as the enlargement of some pipes and culverts, or the removal of some
1 2 3 4 5 6 7 8 9 10 11 12 13 14 15 16 17 18 19 20 21 22 23 24 25 26 27 28 29 30 31 32 33 34 35 36 37 38 39 40 41 42 43 44 45 46 47 48 49 50 51 52 53 54 55 56 57 58
obstacles) were proposed to decrease the risks of flooding. We found that these local improvements should be combined with other catchment-wide solutions (such as the installation of storm reservoirs) for optimal efficiency. However, due the presence of uninhabited woods along the river, some areas can be flooded harmlessly and do not need any specific modification.
After these steady-state simulations, the river basin was studied as a whole, combining the hydrological and hydrodynamic approaches for the simulation of an extreme rainfall event. The rainfall distribution was generated for three return periods (10, 25 and 100 years), using the alternative block method (Chow et al., 1988). However, the results presented in this paper correspond to the 25 years return period rainfall, which was contractually fixed as the design storm. The rainfall was specified as uniform over the catchment and its intensity was multiplied by an areal reduction factor of 0.75.
A fundamental question arose from these simulations about the modelling of the flow through structures such as pipes and culverts. When they are simply considered as closed sections, the water has no other choice but to pass through the structure. Therefore, when the discharge becomes significant, the water level upstream of the structure increases until there is a sufficient head to force the whole discharge through the structure. This effect can therefore cause an unrealistic water storage upstream of the structure. In real conditions, when the level exceeds a threshold, the water can overflow the structure. However, no data were available to identify the pipes and culverts which can be overflowed and the corresponding water level threshold. Therefore, two extreme cases were defined. In the first one, no longitudinal overflow was allowed. In the second one, there was an enlargement of the closed section starting 0.50 m above the top of the waterway, with a lateral slope of 10% (figure 3c).
Figures 7 and 8 show the hydrographs at 6 locations along the river for a 25-year return period storm, for each situation.
1 2 3 4 5 6 7 8 9 10 11 12 13 14 15 16 17 18 19 20 21 22 23 24 25 26 27 28 29 30 31 32 33 34 35 36 37 38 39 40 41 42 43 44 45 46 47 48 49 50 51 52 53 54 55 56 57 58 59
Figure 7: Hydrographs for a 25-year return period flood (no structure overflow allowed). Figure 8: Hydrographs for a 25-year return period flood (structure overflow allowed).
In the first case, the water storage upstream of the structures considerably decreases the discharge peaks (attenuation effect) and increases the maximum water levels. In the second case, the water levels are lower, but the discharges are higher (no attenuation effect). Therefore, in a conservative approach, the first case was used to estimate the maximum water levels in the river, while the second case was preferred to compute the maximum discharges.
The maximum water levels at each river section were computed and the resulting water levels in the river were found to remain similar to those computed in the steady approach. The lessons drawn from the previous analyses are therefore still applicable for the unsteady simulations.
Various solutions were proposed in order to mitigate the potential floods. In addition to some local improvements in areas where important head losses were identified (cf. the analysis with the steady flow), retention basins were pointed out as a relevant catchment-wide solution. After an analysis of the possible locations (depending on the potential sites identified by the local water authorities and their interest from a hydraulic point of view), three main sites were located to install retention basins. Three characteristics needed to be determined: the threshold river discharge from which the basin starts to store the water (bypass discharge), the emptying discharge (evacuation from the basin), and the basin volume. The total of the two first characteristics (bypass and emptying discharge) depends on the acceptable river discharges (see Figure 5). However, due to the very low hydraulic capacity of some river parts, this approach would have led to excessive storage volumes. Therefore, in some areas, the discharge left in the river still exceeds the acceptable threshold, and additional local works and improvements had to be considered.
1 2 3 4 5 6 7 8 9 10 11 12 13 14 15 16 17 18 19 20 21 22 23 24 25 26 27 28 29 30 31 32 33 34 35 36 37 38 39 40 41 42 43 44 45 46 47 48 49 50 51 52 53 54 55 56 57 58
Figure 9 shows the simulated discharges in the Rieu des Barges when adding the three storage basins. It can be seen that the effect of a reservoir decreases towards the downstream end of the river, and it is therefore necessary to distribute the basins along the whole river. The graph also shows the river sections where the acceptable discharge is exceeded.
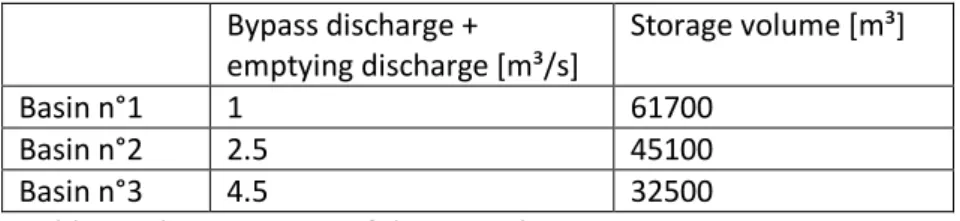
The simulations also provided the change in stored water volume during the flood for each reservoir. The maximum volume could therefore be used for the sizing of the potential retention basins. For a 25-year return period, the following volumes were found (table 1).
Bypass discharge + emptying discharge [m³/s] Storage volume [m³] Basin n°1 1 61700 Basin n°2 2.5 45100 Basin n°3 4.5 32500
Table 1: Characteristics of the storm basins.
Even with three storm basins, the acceptable discharge is found to be still exceeded in some sections. A number of reasons can explain this:
the basin volumes have to be limited due to ground occupation and cost limits;
unlicensed constructions have been erected in some sections of the river, resulting in significant local narrowing of the river;
the acceptable discharge may be underestimated in some sections due to inaccuracy in data. In some areas, while the “acceptable discharge” (corresponding to a flow maintained in the main channel) is exceeded, local overflowing of the banks is harmless and can therefore still be acceptable. In contrast, in other areas, additional local solutions are necessary, such as the raising of the banks or modifications of the river course. For example, in an area in the downstream part of basin, the river narrows without any possible enlargement due to the presence of neighbouring houses. An important reduction of the flood discharge is therefore needed, and the possible diversion of a part
1 2 3 4 5 6 7 8 9 10 11 12 13 14 15 16 17 18 19 20 21 22 23 24 25 26 27 28 29 30 31 32 33 34 35 36 37 38 39 40 41 42 43 44 45 46 47 48 49 50 51 52 53 54 55 56 57 58 59
of the discharge through a culvert parallel to the river was analysed. The flow distribution is computed on the basis of the maximum allowed discharge in the river (figure 9).
The study pointed out the importance of the flow dividing device. A structure made of two weirs was proposed to divide the flow between the river and the culvert (figure 10). This ensures a distribution of the flow which only depends on the total discharge, and is independent from the water level in the river and the culvert due to supercritical flow conditions on the weirs.
The dimensions of the structures were defined in order to obtain the desired flow division. The level of the weir diverting into the river was specified as lower than the other one, so that at low flows, the entire discharge stays in the river.
Figure 10: Example of a local solution: diversion of the discharge through a parallel culvert. Figure 11: Flow division between the river and the culvert, and corresponding water levels.
The flood event was then simulated in this new configuration and, as expected, the results indicate that the bank overflows along the downstream part of the river can be avoided by the proposed solution.
7. Conclusion
This paper presents a practical application of a complete modelling system including in a unique framework a pre-processing tool, a hydrological model and a module for the 1D simulation of river flows. The modelling system WOLF was used to find and assess solutions for the flood mitigation in the “Rieu des Barges” catchment. The study was conducted following four main steps. In the first one (data processing), the Digital Elevation Model was modified in order to be consistent for hydraulic numerical modelling, the distributed model parameters were generated from landuse and pedologic maps, and an automatic process was applied in order to generate a complete 1D network by combining data from the digital elevation model, and from site surveys. Existing and projected storm
1 2 3 4 5 6 7 8 9 10 11 12 13 14 15 16 17 18 19 20 21 22 23 24 25 26 27 28 29 30 31 32 33 34 35 36 37 38 39 40 41 42 43 44 45 46 47 48 49 50 51 52 53 54 55 56 57 58
basins were also included in the simulations with a specific implementation of the way they operate. In the second step, a study of the river hydrodynamics allowed locating problematic areas, proposing local solutions, and assessing the maximum acceptable river discharge. In the third step, a coupled hydrology-hydrodynamics approach was used to compute the hydrographs in the river for an extreme flood event generated using the alternative block method. Finally, various improvements to mitigate the harmful effect of floods were modelled.
The study showed that catchment-wide solutions such as the implementation of storm basins are an interesting solution, but have to be combined with local improvements, such as the diversion of a part of the river discharge, the raising of the banks or the removing of obstructing structures.
References
Archambeau, P., Dewals, B., Detrembleur, S., Erpicum, S. & Pirotton, M. (2004) A set of efficient numerical tools for floodplain modeling. In Jirka, G. H. & Uijttewaal, W. S. J. (Eds.) Shallow Flows. Leiden, etc, Balkema.
Callow, J. N. (2007) How does modyfying a DEM to reflect known hydrology affect subsequent terrain analysis? Journal of Hydrology, 332, 30-39.
Chow, V. T., Maidment, D. & Mays, L. W. (1988) Applied Hydrology, McGraw-Hill.
Dewals, B. J., Erpicum, S., Archambeau, P., Detrembleur, S. & Pirotton, M. (2006) Depth-integrated flow modelling taking into account bottom curvature. J. Hydraul. Res., 44, 787-795.
Dewals, B. J., Erpicum, S., Archambeau, P., Detrembleur, S. & Pirotton, M. (2008a) Hétérogénéité des échelles spatio-temporelles d'écoulements hydrosédimentaires et modélisation numérique. Houille Blanche-Rev. Int., 109-114.
Dewals, B. J., Erpicum, S. & Pirotton, M. (2008b) Numerical modelling and theoretical analysis of geometrically-controlled flow instabilities in rectangular basins. 4th Int. Conf. on Advanced Computational Methods in Engineering. Liege, Belgium.
1 2 3 4 5 6 7 8 9 10 11 12 13 14 15 16 17 18 19 20 21 22 23 24 25 26 27 28 29 30 31 32 33 34 35 36 37 38 39 40 41 42 43 44 45 46 47 48 49 50 51 52 53 54 55 56 57 58 59
DHI (2000) NAM Technical Reference and Model Documentation, DHI Water and Environment, Denmark.
Erpicum, S., Dewals, B. J., Archambeau, P. & Pirotton, M. (2009a) Dam-break flow computation based on an efficient flux-vector splitting. J. Comput. Appl. Math., accepted.
Erpicum, S., Meile, T., Dewals, B. J., Pirotton, M. & Schleiss, A. J. (2009b) 2D numerical flow modeling in a macro-rough channel. Int. J. Numer. Methods Fluids, published online: 13 Feb 2009. Feldman, A. (2000) Hydrologic Modeling System-HEC-HMS-Technical Reference Manual.
Graham, D. N. & Butts, M. B. (2005) Flexible integrated watershed modeling with MIKE SHE. In Singh, V. P. & Frevert, D. K. (Eds.) Watershed Models. CRC Press.
Kerger, F., Archambeau, P., Erpicum, S., Dewals, B. J. & Pirotton, M. (2009) Simulation numérique des écoulements mixtes hautement transitoires dans les conduites d'évacuation des eaux. Houille Blanche-Rev. Int., accepted.
Martz, L. W. & Garbrecht, J. (1999) An outlet breaching algorithm for the treatment of closed depressions in a raster DEM. Computers & Geosciences, 25, 835-844.
Nearing, M. A., Liu, B. Y., Risse, L. M. & Zhang, X. (1996) Curve numbers and Green-Ampt effective hydraulic conductivities. Water Resources Bulletin, 32.
Preissmann, A. (1961) Propagation des intumescences dans les canaux et rivieres. Proc. First Congress of the French Association for Computation. Grenoble, France.
Rawls, W. J. & Brakensiek, D. L. (1989) Estimation of soil water retention and hydraulic properties. In Morel-Seytoux, H. J. (Ed.) Unsaturated Flow in Hydrologic Modeling. Kluwer Academic Publishers.
Roger, S., Dewals, B. J., Erpicum, S., Pirotton, M., Schwanenberg, D., Schüttrumpf, H. & Köngeter, J. (2009) Experimental und numerical investigations of dike-break induced flows. J. Hydraul. Res., in press.
1 2 3 4 5 6 7 8 9 10 11 12 13 14 15 16 17 18 19 20 21 22 23 24 25 26 27 28 29 30 31 32 33 34 35 36 37 38 39 40 41 42 43 44 45 46 47 48 49 50 51 52 53 54 55 56 57 58
Saunders, W. (1999) Preparation of DEMs for use in environmental modelling analysis. 1999 ESRI User Conference. San Diego, California.
Figure 1
Figure 2
Figure 3
Figure 4
Figure 5
Figure 6
Figure 7
Figure 8
Figure 9
Figure 10
Figure 11