Indicator mineral exploration methodologies for VMS
deposits using geochemistry and physical characteristics
of magnetite
Thèse
Sheida Makvandi
Doctorat interuniversitaire en sciences de la Terre
Philosophiae doctor (Ph.D.)
Québec, Canada
! ! ! !Résumé
Pour évaluer le potentiel de la magnétite en tant que minéral indicateur des dépôts de Sulfures Massifs Volcanogènes (SMV), la composition des éléments traces et les caractéristiques (morphologie, taille des grains et textures de surface) de la magnétite provenant de différents contextes ont été investiguées. Les caractéristiques physiques et les associations minérales de la magnétite du dépôt d’Izok Lake (Nunavut, Canada), de la roche encaissante et du till recouvrant la zone à proximité ont été étudiés en utilisant la microscopie optique, le Microscope Électronique à Balayage (MEB) et l’Analyseur de Libération Minérale (MLA). Les résultats permettent de distinguer la magnétite magmatique, métamorphique et supergène dans un environnement de SMV, et indiquent que 1) la taille des grains de magnétite et leur relation texturale avec les associations minérales caractérisent la roche encaissante, 2) l’angularité de la magnétite du till est indicatrice de la forme originel du minérale, et 3) les textures de surface de la magnétite détritique sont diagnostiques des processus affectant les grains durant l’érosion, le transport, et après la déposition dans les sédiments glaciaire.
La composition de la magnétite provenant d’Izok Lake (Nunavut, Canada) et d’Halfmile Lake (Nouveau-Brunswick, Canada) et de leurs roches encaissantes a été étudiée en utilisant le MEB, la microsonde électronique, et l’ablation laser- spectrométrie de masse à plasma à couplage inductif (LA-ICP-MS). Les données censurées ont été transformées en utilisant la routine R robCompositions, puis converties en utilisant les log-ratios centrés pour éviter tout effet de fermeture. L’analyse en Composantes Principales (ACP) permet de discriminer différents types de roche encaissantes et des dépôts basés sur la teneur de la magnétite en Si, Ca, Zr, Al, Ga, Mn, Mg, Ti, Zn, Co, Ni et Cr.
Les données de composition de la magnétite de seize dépôts SMV (mafique, bimodal mafique, bimodal felsique, felsique-silicoclastique), et de trois Formations de Fer Rubanées (FFR) associés à des SMV ont été investiguées par analyse discriminante par les moindres carrés partiels (PLS-DA) pour distinguer les différentes compositions de magnétite basées sur les teneurs en Si, Ca, Al, Mn, Mg, Ti, Zn, Co et Ni. Le résultat indique quatre types de magnétite en association avec les dépôts de SMV: magmatique, hydrothermale,
magnétite des SMV et BIF des autres types de gites minéraux. Les analyses en PCA et PLS-DA des échantillons de la roche encaissante/dépôt SMV et FFR produisent un modèle de discrimination de la composition de la magnétite dans le till qui peut être utilisé pour identifier, en exploration minérale, la magnétite dérivée de l'érosion d'un SMV par un glacier.
Abstract
To evaluate the potential of magnetite as an indicator mineral for Volcanogenic Massive Sulfide (VMS) deposits, trace element compositions and physical characteristics (morphology, grain size, and surface textures) of magnetite from various VMS settings were investigated. Physical characteristics and mineral associations of magnetite from the Izok Lake deposit (Nunavut, Canada), its host bedrocks, and till covering the nearby area were studied using optical microscopy, Scanning Electron Microscopy (SEM), and Mineral Liberation Analysis (MLA). The results distinguish magmatic, metamorphic and supergene magnetite in the VMS setting, and indicate that 1) the grain-size distribution of magnetite and its textural relationships with mineral associations fingerprint the host bedrocks, 2) the angularity of magnetite in till is indicative of the original shape of the mineral, and 3) the surface textures of detrital magnetite are diagnostic of processes affecting grains during erosion, transport, and after deposition in glacial sediments.
Variation in magnetite composition from the Izok Lake (Nunavut, Canada) and Halfmile Lake (New Brunswick, Canada) deposits and their host rocks were studied using SEM, Electron Probe Micro-Analyzer (EPMA), and Laser Ablation Inductively Coupled Plasma Mass Spectrometry (LA-ICP-MS). The data were transformed for censored values using the R-package robCompositions. Transformed data were converted using centered log-ratio to overcome the closure effect, and then were investigated by Principal Component Analysis (PCA) to discriminate different rock/deposit samples based on Si, Ca, Zr, Al, Ga, Mn, Mg, Ti, Zn, Co, Ni and Cr contents of magnetite.
The data from sixteen VMS deposits from four subtypes (mafic, mafic, bimodal-felsic, and felsic-siliciclastic), and three VMS-associated Banded Iron Formations (BIF) were also investigated by Partial Least Squares Discriminant Analysis (PLS-DA). PLS-DA to distinguish different compositions of magnetite based on Si, Ca, Al, Mn, Mg, Ti, Zn, Co and Ni contents. The results indicate four types of magnetite in association with VMS deposits: 1) magmatic, 2) hydrothermal, 3) metamorphic, and 4) zoned magnetite. PLS-DA separates VMS and VMS-associated BIF magnetite from that of other mineral deposit types including Ni-Cu, porphyry, IOCG and IOA deposits. PCA and PLS-DA of magnetite data
from VMS bedrock/deposit and BIF samples yield discrimination models that can be used to classify magnetite compositions in till samples for mineral exploration.
Table of Content Résumé ... iii Abstract ... v List of Tables ... ix List of Figures ... xi Acknowledgments ... xv Foreword ... xvii Chapter 1 Introduction ... 1 Bckground ... 1 1.1. Research objectives ... 7 1.2. Thesis outline ... 8 1.3. Chapter 2 “The surface texture and morphology of magnetite from the Izok Lake volcanogenic massive sulfide deposit and local glacial sediments, Nunavut, Canada: Application to mineral exploration” ... 11
Résumé: ... 11 Abstract: ... 12 Introduction: ... 13 2.1. Methodology ... 18 2.2. Results ... 21 2.3. Discussion ... 41 2.4. Conclusions ... 51 2.5. Chapter 3 “Principal Component Analysis of magnetite composition from volcanogenic massive sulfide deposits: Case studies from the Izok Lake (Nunavut, Canada) and Halfmile Lake (New Brunswick, Canada) deposits” ... 53
Résumé: ... 53 Abstract: ... 54 Introduction ... 55 3.1. Geologic settings ... 60 3.2. Methodology ... 62 3.3.
Conclusions ... 104
3.6. Chapter 4 “Partial Least Squares Discriminant Analysis of trace element compositions of magnetite from various VMS deposit subtypes: Application to mineral exploration” ... 107
Résumé: ... 107
Abstract: ... 108
Introduction ... 109
4.1. Sample selection and compositional diversity in selected VMS deposits ... 113
4.2. Methodology ... 116 4.3. Results ... 121 4.4. Discussion ... 134 4.5. Conclusions ... 146 4.6. Chapter 5 Thesis conclusions and recommendations for future work ... 149
General conclusions ... 150
5.1. Recommendations for future work ... 152
5.2. Bibliography ... 155
Appendices ... 187
Appendix-I: Variable contributions for Mag from VMS deposits in Fig. 4-4B………..187
Appendix-II: Variable contributions for Mag from the VMS deposits Fig. 4-6B…………...189
Appendix-III: Variable contributions for Mag from mineral deposits in Fig. 4-7B………....191
Appendix-IV: The range of detection limits for A) EMPA and B) LA-ICP-MS analyes…...192
Appendix-V: EMPA raw data for Mag from the Izok Lake area………193
Appendix-VI: LA-ICP-MS raw data for Mag from the Izok Lake area………..203
Appendix-VII: EPMA raw data for Mag from the Halfmile Lake area………..209
Appendix-VIII: LA-ICP-MS raw data for Mag from the Halfmile Lake area………222
Appendix-IX: EPMA raw data for Mag from the other VMS settings………...227
List of Tables
Table 2-1. The Izok Lake studied bedrock samples description. ... 22! Table 2-2. The Izok Lake studied till samples description. ... 24! Table 2-3. The proportion of microtextures found on the surface of magnetite in bedrock samples. ... 24! Table 2-4. The proportion of microtextures found on the surface of magnetite in till samples from the Izok Lake area. ... 29! Table 3-1. Trace element compositions of associated spinel group minerals in Figure 3-2G, obtained by EPMA (in wt%). ... 70! Table 3-2. Average compositions and standard deviations (Std) for minor and trace elements (in ppm; obtained by LA-ICP-MS) in magnetite from Izok Lake bedrock samples. ... 77! Table 3-3. Average compositions and standard deviations (Std) for minor and trace elements (in ppm; obtained by LA-ICP-MS) in magnetite from Halfmile Lake bedrock samples. ... 83! Table 4-1. List of VMS deposits studied. ... 117! Table 4-2. Mean compositions of magnetite (in ppm) from VMS deposits BIFs studied. ... 130!
List of Figures
Figure 2-1. Simplified bedrock geology map of the Izok Lake deposit. ... 16!
Figure 2-2. Locations of bedrock and till samples in the Izok Lake area ... 19!
Figure 2-3. Typical morphology and microtextures of magnetite from Izok Lake massive sulfide lenses. ... 26!
Figure 2-4. Typical surface textures of magnetite from gahnite- rich dacite (A to D), iron formations (E to G), and gabbro (H & I). ... 27!
Figure 2-5. Typical morphology of till magnetite ... 28!
Figure 2-6. A selection of mechanical textures on the surface of Izok Lake till magnetite. ... 33!
Figure 2-7. Different forms of dissolution characterizing the surface of till magnetite grains. ... 34!
Figure 2-8. A to C) Precipitation texture overprinting dissolution texture (shown by arrows). D) Overgrowth rims of Mag2 precipitated on surfaces of till magnetite. E) Widespread precipitation of Mag2 masked mechanical microtextures. F) A dissolution pit filled by precipitation of Mag2. ... 35!
Figure 2-9. Histograms show the proportions of euhedral, subhedral, and anhedral crystals of magnetite from different Izok Lake bedrock samples. ... 35!
Figure 2-10. Izok Lake till magnetite grains classified into 5 roundness classes of Powers’ angularity chart. . 37!
Figure 2-11. Distribution of magnetite grains from Izok Lake till samples among different roundness classes. ... 37!
Figure 2-12. Equivalent Ellipse enclosed in a particle to calculate the angularity by the MLA. ... 38!
Figure 2-13. Box-and-whisker plots showing values of angularity of magnetite grains obtained from equation (1) in Izok Lake bedrock and till samples. ... 38!
Figure 2-14. Cumulative weight percent passing graphs showing grain size distribution of magnetite in A) bedrock samples and B) till samples. ... 40!
Figure 2-15. The diagram shows comparison between frequency of occurrences of microtextures in Izok Lake till magnetite, Wahianoa magnetite, and Weichselian quartz. ... 46!
Figure 3-1. A) Location map of the Halfmile Lake area in eastern Canada. B) Simplified bedrock geology map of the Halfmile Lake district. C) Locations of till samples in the Halfmile Lake area.. ... 61!
Figure 3-2. Backscattered electron images of mineral grains in the Izok Lake bedrock samples ... 72!
Figure 3-3. Backscattered electron images of mineral grains in the Halfmile Lake bedrock samples. ... 76!
Figure 3-4. Principle component analysis results of electron microprobe data for magnetite from the Izok Lake bedrock samples. ... 80!
Figure 3-5. Principle component analysis results of laser ablation inductively coupled mass spectrometry data for magnetite from the Izok Lake bedrock samples. ... 81!
Figure 3-6. Projection of A) EPMA and B) LA-ICP-MS data of magnetite in till samples from the Izok Lake deposit area into t1-t2 models defined by p1-p2 in Figure 3-4B and Figure 3-5B. C) Histograms show proportions of magnetite grains in till with the signature of mineralization, unmineralized bedrock, and unclassified grains in A. ... 82!
Figure 3-7. PCA results of EPMA data for magnetite from Halfmile Lake bedrock samples. ... 85!
Figure 3-8. PCA results of LA-ICP-MS data for magnetite from Halfmile Lake Lake bedrock samples. ... 86! Figure 3-9. Projection of A) EPMA and B) LA-ICP-MS data of magnetite in till samples from the Halfmile Lake deposit area into t1-t2 models defined by p1-p2 in Figure 3-7B and Figure 3-8B. C)
Figure 3-10. PCA of EPMA data for Mag from Izok Lake and Halfmile Lake deposit districts ... 92! Figure 3-11. PCA of LA-ICP-MS data for Mag from Izok Lake and Halfmile Lake depoit districts. ... 93! Figure 3-12. PCA of LA-ICP-MS data for magnetite from Izok Lake and Halfmile Lake depoit districts. ... 94! Figure 3-13. Projection of A) EPMA and B) LA-ICP-MS data of till magnetite from Izok Lake and Halfmile Lake deposit districts into t1-t2 models defined by PCA in Figure 3-11B and Figure 3-12B. ... 94! Figure 3-14. Chemical maps of zoned Mag from Halfmile Lake alteration zone by EPMA. ... 99! Figure 4-1. Locations of studied VMS deposits and VMS-associated BIFs on simplified bedrock geology maps of A) Canada and B) Oman. ... 118! Figure 4-2. A selection of figures showing mineral aggregates from VMS deposits and VMS-associated BIFs studied. ... 126! Figure 4-3. Chemical maps of zoned Mag from the Ansil bimodal-mafic VMS deposit by EPMA ... 127! Figure 4-4. PLS-DA of LA-ICP-MS data for Mag from various subtypes of VMS deposits, their host bedrocks, and VMS-associated BIFs. ... 131! Figure 4-5. PLS-DA of LA-ICP-MS data for Mag from the studied VMS deposits and VMS-associated BIFs of the Bathurst Mining Camp ... 132! Figure 4-7. PLS-DA of LA-ICP-MS data for Mag from various ore deposit types including VMS,
Acknowledgments
My sincere gratitude is expressed to my dear supervisor, Professor Georges Beaudoin, for his professional guidance and continuous encouragement throughout my thesis work. His vast knowledge and incisive insight have been inspiring. His support, and valuable comments and suggestions have always lighted the way throughout my PhD research. I sincerely appreciate M. Beth McClenaghan, Massoud Ghasemzadeh-Barvarz, Eric C. Grunsky, Daniel Layton-Matthews and Carl Duchesne for their contributions to this research, and also for their suggestions and scientific/technical support.
I would also like to acknowledge my committee members who graciously agreed to serve on my committee, when they were probably up to their neck in work. Thank you and the best of luck in your future endeavors.
I also wish to acknowledge the kind, cordial and helpful staffs of Département de géologie et de génie géologique of Université Laval, especially Marc Choquette for his technical supports for SEM and EPMA, and also the secretarial staffs for putting up with me and answering all my questions.
I would like to thank my colleagues and friends (Émilie Boutroy, Erik Lalonde, Marion Lesbros, Thomas Raskevicius, Nelly Maneglia, Clovis Cameron Auger, and Anne-Aurélie Sappin) for their moral support, and for creating such a good atmosphere in our office/research group.
Finally, but most importantly, I would like to extend my deepest gratitude to my family for allowing me to realize my own potential. All the support they have provided me over the years was the greatest gift anyone has ever given me. Without my parents’ encouragement, sacrifices and patience, I may never have gotten to where I am today. Also, I need to thank my best friend, my husband, Mousa, for his endless support, inspiration, and encouragement throughout this research effort, and always at difficult times. This dissertation would not have been accomplished without the help and moral support of my loved ones.
Foreword
Magnetite is common in many different mineral deposit types. This widespread distribution as well as the potential of magnetite to fingerprint the chemistry of its host rocks has caused an increasing interest in investigating trace element compositions of magnetite from different mineral deposit types. Despite numerous studies demonstrating the application of magnetite chemistry in provenance studies and mineral exploration, magnetite compositions from volcanogenic massive sulfide settings is almost unstudied. In addition, in the majority of magnetite studies, the potential of detrital magnetite chemistry and physical characteristics (e.g., shape, grain-size distribution, and surface textures) to track mineral deposits from distances have not been considered. Thus, my PhD studies have been done with the aim of 1) characterizing physical and chemical characteristics of magnetite from various VMS deposits, their host bedrocks, and from till covering the deposit nearby areas, and 2) establishing criteria to use these characteristics of magnetite in exploration for VMS deposits under layers of overburden cover.
This doctoral thesis presented to the department of Geology and Geological engineering of Laval University, has been carried out under supervision of Professor Georges Beaudoin. This research was funded by a partnership between the Geological Survey of Canada under its Geo-mapping for Energy and Minerals 1 (GEM-1) program (2008-2013), Natural Science and Engineering Research Council (NSERC) of Canada, and industrial partners Overburden Drilling Management Limited, MMG Limited, Teck Resources Limited, and AREVA Resources Canada. The thesis includes three research papers in which I have been the principal researcher and the first author. Two articles have already been published and the third is under revision at the time of the thesis submission.
My contribution to this PhD project has been: 1) to write the research plan, 2) to do sample selection, preparation, examination by various analytical techniques such as SEM, MLA, EMPA, and LA-ICP-MS, and data collection, 3) to establish statistical methodology to transform geochemical censored data, to overcome the effect of closure of compositional data, and to present data using state of the art discrimination techniques, and 4) to write up research papers.
As it is mentioned above, this PhD thesis includes three research papers. The first paper entitled “The surface texture and morphology of magnetite from the Izok Lake volcanogenic massive sulfide deposit and local glacial sediments, Nunavut, Canada: Application to mineral exploration” is co-authored by Georges Beaudoin (research supervisor from ULaval), M. Beth McClenaghan (research scientist from the GSC, Ottawa), and Daniel Layton-Matthews (associate professor in economic geology and petrology from the Queen's University). The article is already published in the Journal of Geochemical Exploration, 2015, V. 150, pages 84-103.
The second paper entitled “Principal component analysis of magnetite composition from volcanogenic massive sulfide deposits: Case studies from the Izok Lake (Nunavut, Canada) and Halfmile Lake (New Brunswick, Canada) deposits” is co-authored by Massoud Ghasemzadeh-Barvarz (PhD in chemical engineering, postdoctoral fellow at Pfizer Inc.), Georges Beaudoin, Eric C. Grunsky (retired GSC research geostatistician, and current adjunct professor at the University of Waterloo), M. Beth McClenaghan, and Carl Duchesne (professor in in chemical engineering from ULaval). This article is already published in the journal of Ore Geology Reviews, 2016, V. 72, pages 60-85.
The third manuscript is entitled “Partial Least Squares Discriminant Analysis of trace element compositions of magnetite from various subtypes of VMS deposits: Application to mineral exploration. It is also co-authored by M. Ghasemzadeh-Barvarz, G. Beaudoin, E.C. Grunsky, M.B. McClenaghan, and C. Duchesne, and is submitted to the journal of Ore Geology Reviews at the time of the thesis submission.
Chapter 1
Introduction
Bckground
1.1.
1.1.1. Indicator mineral methods
Growing demands of industries for raw materials have always forced the human to find better ways to discover mineral resources. Development of indicator mineral methods may be considered part of the mineral’s industry efforts to discover new resources. These methods may be the result of innovative uses of some former exploration methods (e.g., traditional geochemical analysis and heavy minerals). A great advantage of indicator mineral methods is tracing the dispersion of eroded mineral deposits in surficial sediments. In contrast to indicator mineral methods, traditional mineral exploration techniques such as geophysical exploration cannot trace ore bodies or alteration zones from distances. These methods face challenges when applied to areas of transported cover (Jackson, 2009). Overall, different mineral exploration methods are complementary to each other.
Study of different characteristics of indicator minerals may provide information applicable to evaluate mineral potential of the study area, determine mineral deposit types, distinguish specific sources (for gold e.g. Desborough, 1970; Antweiler and Campbell, 1977; Antweiler and Campbell, 1982; Von Gehlen, 1983; Knight and McTaggart, 1986; Hallbauer and Utter, 1977), determine secondary from primary deposits (for gold e.g. Wilson, 1984), and to determine the location of deposits. Presence of indicator minerals such as omphacite, pyrope and manganiferous ilmenite in sediments fingerprints kimberlitic bodies, and the chemistry of these minerals is useful to assess the fertility for diamonds (Golubev, 1995; Dredge et al., 1996; Clements et al., 2009; Kaminsky and Belousova, 2009). Grant et al. (1991) also indicated that the integration of morphological
affecting grains during weathering and/or transport. For instance, rims in gold grains are commonly generated by the removal of Ag, Hg and Cu, and not because of Au precipitation (Grant et al., 1991).
The two most fundamental properties that characterize a mineral and make it distinguishable from other minerals are its chemical composition and crystal structure. In nature, there is no truly pure mineral because similarity in atomic number/radius always allows some elements substituting for mineral forming elements. Some minerals, such as magnetite, are able to preferentially incorporate extensive substituting elements in their crystallographic structure that results in exhibition of extensive variation in chemical composition, called a solid solution. The extent of the elemental substitution and the type of substituting elements are strongly controlled by the environment in which the mineral has formed (Barnes and Roeder, 2001).
The chemistry of some indicator minerals is useful for tracing more than one type of mineral deposits. For instance, cinnabar is an indicator for mercury (Plouffe, 2001), and gold mineralization (Stendal and Theobald, 1994), whereas fluorite is an indicator for tungsten Mississippi Valley Type Pb-Zn, molybdenum and/or tin mineralization (Stendal and Theobald, 1994; Friske et al., 2001). The chemistry of some indicator minerals is a discriminant tool to determine the mineral deposit type. For instance, gold grains from epithermal environments are Ag-rich and Cu-poor, whereas gold grains from Au-Cu porphyry deposits are Cu-rich with variable content of Ag (Townley et al., 2003). Apatite is a ubiquitous accessory mineral in a wide range of rock types and useful to record trace elements chemistry of rock systems at the time of its crystallization (Sha and Chapell, 1999; Belousova et al., 2001). Similarly, magnetite is a major to accessory mineral in many types of mineral deposits/geologic settings. The composition of magnetite has been used to distinguish various mineral deposit types including Ni-Cu, porphyry, iron oxide copper gold (IOCG), iron oxide-apatite (IOA), banded iron formation, skarn, Mg-skarn, and the Bayan Obo REE-Fe-Nb deposit (Lindsley, 1976; Ghiorso and Sack, 1991; Razjigaeva and Naumova, 1992; Carew, 2004; McClenaghan, 2005; Singoyi et al., 2006; Gosselin et al., 2006; Beaudoin and Dupuis, 2009; Dupuis and Beaudoin, 2011; Gao et al., 2013; Hu et al., 2014; Boutroy, 2013; Boutroy et al., 2012a,b, 2014; Dare et a., 2012, 2014, 2015; Nadoll et
al., 2012, 2014, 2015; Huang et al., 2015; Chung et al., 2015; Chen et al., 2015a,b; Liu et al., 2015a,b; Zhao and Zhou, 2015).
Indicator mineral studies often result in obtaining multiple beneficial information applicable in other geological domains. The study of a single indicator mineral, such as zircon, enables geologists to extract data about crystal structure, chemistry of major and trace elements, patterns of REEs, U-Pb ratios, and Hf isotope ratios (Jackson, 2009). The chemistry of minerals can also be used as a petrogenetic indicator. Zircon from different igneous rocks shows a variable composition with an increase in trace elements concentration from ultramafic through mafic to granitic rocks. Belousova et al. (2002) used binary diagrams as well as classification trees to discriminate different host rocks of zircon. Dare et al. (2014) suggested using trace element compositions of magnetite as petrogenetic indicators for various magmatic and hydrothermal mineral deposits.
The study of indicator mineral inclusions also provides useful information about genetic history of minerals, the composition of host rocks or the type of deposits (Slansky et al., 1991; Auge and Legendre, 1992; Cabri et al., 1996; Leake et al., 1998; Mortensen et al., 2005; Shcheka, 2004; Shcheka et al., 2004; Podlipsky et al., 2007). For instance, chromite inclusions in xenomorphic Pt-Fe alloy grains indicate an association with dunite (Shcheka, 2004). Enargite inclusions in gold grains represent a high sulfidation epithermal source, however, argentite inclusions indicate a mesothermal provenance for gold (Mortensen et al., 2005). In Pt-group minerals, there is a correlation between the presence of inclusions with the minerals morphology and/or chemistry. Iridium, Ru and Os inclusions are observed in small xenomorphic Pt-Fe alloy crystals, whereas they are completely absent in coarse idiomorphic grains. Lack of inclusions indicates a low concentration of PGEs, and also association with the late apatite-magnetite-phlogopite clinopyroxenite intrusions (Shcheka, 2004). Furthermore, the inclusions mineral chemistry can be used to develop trace element criteria and discriminant diagrams that are applicable in recognition of the mineral potential of an area (Jackson, 2009). For example, the majority of garnet inclusions in diamond have depleted trace element patterns characterized by low contents of Zr (<20 ppm), Y (< 8ppm), Ti (10-2000 ppm) and HREE. The REE-depleted pattern observed on
inclusion free, whereas Cr-magnetite inclusions fingerprint non-kimberlitic forsterite. Nadoll (2011) stated that the composition of inclusions in magnetite depends on the geological environment. Tracy (1982) suggested that the occurrence, abundance, and geochemistry of inclusions in magnetite are useful for provenance studies.
In addition to mineral chemistry, surface textures and morphology of minerals are useful for indicator mineral studies. Surface physical features of indicator minerals can be used to predict the presence of mineral deposits or to estimate distance of transport from the source (Pokhilenko et al., 2010). Hence, study of these features can provide information about travel distance from sources as well as information related to the transport mechanisms and the sedimentary environments (Townley et al., 2003). Over more than a century, the shape of placer gold particles has been used as a distance-to-source indicator (Fisher, 1945; Utter, 1979; Youngson and Craw, 1999; Knight and McTaggart, 1986; Knight et al., 1999). The morphological transformation of these particles is a function of distance and of the environment of transport (Hallbauer and Utter, 1977; Averill and Zimmerman, 1986; Giusti, 1987; HÈrail et al., 1989; DiLabio, 1991; Townley et al., 2003).
As shown above, during recent decades, breakthroughs have been achieved in using indicator minerals in discovery of Au, Cu, Ni, PGE, Zn, and diamond (Stendal and Theobald, 1994; Nadoll, 2012, 2014; Hicken et al., 2013a,b; Budulan et al., 2013, 2015; McClenaghan et al., 2007, 2009, 2012a,b, 2015; Boutroy et al., 2014). However, these methods are not well developed for exploration of some other deposit types including volcanogenic massive sulfide (VMS) deposits. In addition, these methods must be developed for using a variety of potentially useful minerals, such as magnetite, for discovery of metallic mineral deposits. Thus, the present study was undertaken with the aim of developing new indicator mineral methodologies using magnetite to trace VMS deposits in glaciated terrain in Canada and elsewhere.
1.1.2. Magnetite as an indicator for metallic mineral deposits
Although a variety of minerals is used as indicator minerals for exploration of metallic ore deposits, the indicator mineral methodologies are not well developed for some other potentially useful minerals such as rutile, magnetite, zircon, garnet, tourmaline, and apatite
(Averill, 2001; Belousova et al., 2002; McClenaghan, 2005). Physical properties and chemical compositions make some minerals suitable to trace particular mineral deposits. The requirements for being considered as a useful indicator mineral are: 1) silt to sand grain size, though Michaud and Averill (2009) believed coarse grains are also applicable, 2) a range of composition that is sufficiently sensitive to the environment of crystallization, including important genetic information about mineralization and host rock, 3) ability to survive during weathering and/or mechanical transport, and 4) relative ease of recognition and separation from exploration sample media (Averill, 2001; McClenaghan et al., 2009). Magnetite is an ideal indicator mineral for mineral exploration because it is resistant to weathering and transport (due to its hardness (mohs scale: 5.5-6.5), and redox sensitivity), it can be easily separated from sample media, by heavy liquid separation (specific gravity of 3.2) and/or using a hand magnet, and because of its chemical formula (Fe3O4) and spinel
structure that allow it to incorporate a large number of foreign cations. All these properties make magnetite a nearly common mineral found in a wide variety of igneous, metamorphic and sedimentary environments. It is present in many magmatic-hydrothermal ore deposits as a major (e.g. IOCG deposits) or as an accessory mineral (e.g. VMS deposits). Spinel group minerals such as magnetite display a wide range of chemical compositions owing to several solid-solution substitutions of divalent and trivalent cations (Deer et al., 1997). Incorporation of substituting elements into magnetite depends on the availability of these elements and their partition coefficients between magnetite and co-forming/existing minerals, which in turn, are controlled by the composition of parental magmatic/hydrothermal fluids, the composition of host bedrocks, the composition of co-forming minerals, temperature, pressure, and oxygen fugacity (Nadoll et al., 2010, 2012, 2014; Dare et al., 2014). This enables magnetite to fingerprint the chemistry of source rocks, and makes it useful for both petrogenetic and provenance studies (Dupuis and Beaudoin, 2011; Dare et al., 2014). Dupuis and Beaudoin (2011) established stepwise discrimination diagrams classifying various mineral deposit types including VMS deposits based on magnetite composition. Their results show that Al/(Zn+Ca) vs. Cu/(Si+Ca) diagram can isolate magnetite from Cu-Zn-Pb VMS deposits from that of other deposit
commonly forms in semi-conformable alteration zones where there is an increase in Ca-Si-Fe content, and in amphibolite facies assemblages, which affect rocks immediately above related subvolcanic intrusions (Galley et al., 2007).
1.1.3. Importance of developing exploration methods for VMS deposits
Unlike some mineral deposit types such as Ni-Cu and porphyry, methods using indicator minerals in the exploration for VMS deposits are not well developed. Considering that VMS deposits are major sources of Zn, Cu, Pb, Ag, and Au, significant sources of Co, Sn, Se, Mn, Cd, In, Bi, Te, Ga and Ge, and also contain notable amounts of As, Sb and Hg, developing exploration methods for these deposits is highly desirable. In Canada, 27% of Cu, 49% of Zn, 20% of Pb, 40% of Ag, and 3% of Au are historically provided from VMS deposits (Galley et al., 2007).
Volcanogenic massive sulfide deposits form by discharge of hydrothermal solutions into or onto the seafloor. Their immediate host rocks can be either volcanic or sedimentary. They typically occur as lenses of polymetallic massive sulfides that precipitated from metal-enriched fluids associated with seafloor hydrothermal convection in a wide range of ancient and modern geological settings. VMS deposits commonly form in extensional tectonic settings, both oceanic seafloor spreading and arc environments (Galley et al., 2007). Based on the lithotectonic classification, VMS deposits are divided into 5 subtypes: (1) siliciclastic-felsic in a mature epicontinental arc, (2) bimodal-felsic in an epicontinental arc, (3) bimodal-mafic in an oceanic suprasubduction rifted arc, (4) mafic in a primitive oceanic backarc, and (5) pelite-mafic in a mature oceanic backarc (Franklin et al., 2005; Mosier et al., 2009). VMS deposits are characterized by ore mineral assemblages including sphalerite, pyrite, chalcopyrite, pyrrhotite and galena, whereas quartz, calcite, albite, sericite, chlorite, amphibole and tourmaline are found as gangue minerals in these deposits (Franklin et al., 2005; Galley et al., 2007; Zaccarini and Garuti, 2008). Mineral assemblages in alteration zones associated to VMS deposits commonly include: magnetite, palagonite, clays, garnet, staurolite, kyanite, andalusite, phlogopite, gahnite, actinolite, clinozoisite, sericite, hematite, and barite.
Research objectives
1.2.
The study was undertaken with the purpose of developing indicator mineral methodologies for VMS deposits using magnetite. Followings are steps considered to reach the purpose:
• To measure the composition of magnetite using accurate and sensitive analytical instruments yielding in situ high spatial resolution analysis such as the electron probe micro-analyzer (EPMA) and laser-ablation inductively coupled mass spectrometry (LA-ICP-MS). Using optical microscopy, scanning electron microscope (SEM), and mineral liberation analysis (MLA) to examine magnetite surface textures, shape, angularity, grain size, mineral association and inclusions. • To characterize physical features of magnetite (e.g., morphology, surface textures,
grain size distribution, and mineral association) from the Izok Lake deposit and its host bedrocks, and to establish criteria to 1) distinguish different sources of magnetite in till, 2) estimate grains transport distance from the source, and 3) determine transport media.
• To establish criteria to transform compositional data for censored values and the closure prior to data presentation and interpretation.
• Statistical analysis in high dimensional and highly correlated geochemical data to 1) detect sources of variations in data, 2) detect discriminator elements, 3) classify different rock/deposit samples based on magnetite compositions, and 4) form discrimination models to distinguish different sources of magnetite in unconsolidated sediments.
• To characterize magnetite compositions in two case studies, Izok Lake bimodal-felsic and Halfmile Lake bimodal-felsic-siliciclatic VMS deposits, their host bedrocks, and respective alteration zones, and establishing statistical models to distinguish different sources of magnetite in till collected from the areas nearby the deposits. • To characterize magnetite in various VMS settings of different subtypes to establish
classification models to discriminate between different VMS deposits, and to separate magnetite from VMS deposits from that of other deposit types from the literature.
Thesis outline
1.3.
The PhD dissertation presents the research findings as a collection of three manuscripts, and includes five chapter as followings:
Chapter 1 is the general introduction, the problem identification, the objectives, and the thesis outlines.
Chapter 2 examines magnetite grains from the Izok Lake VMS deposit, its host bedrocks, and from till covering the deposit nearby area for their shape, angularity, surface textures, grain size distribution, and mineral associations. This chapter presents data on magnetite shape, angularity, grain size, and mineral associations from the rock/deposit samples can be used to distinguish till magnetite provenances. Furthermore, Chapter 2 presents the application of magnetite surface textures to determine the nature of sample media, and to detect processes affecting grains during erosion, transport and after deposition in sedimentary basins.
Chapter 3 characterizes magnetite compositions from the Izok Lake and Halfmile Lake VMS deposits, their host bedrocks, and till covering the nearby areas of the deposits by EPMA and LA-ICP-MS. Chapter 3 establishes statistical methodology for treating geochemical censored data and overcome the problem of closure. It investigates the EPMA and LA-ICP-MS data by PCA to find the best low-dimensional representation of the variation in the multivariate dataset that causes distinguishing different rock/deposit sources of magnetite. This chapter also shows the application of PCA models defined by rock/deposit samples to distinguish different compositions of magnetite in till, and so detecting chemical signatures of VMS deposits in sediments. This part of the thesis indicates the use of magnetite chemistry in sediment provenances and in exploration of VMS deposits in glaciated terrains.
Chapter 4 investigates magnetite grains from various VMS deposits, VMS-associated BIFs, and VMS deposits host bedrocks by the optical microscopy, SEM, EPMA and LA-ICP-MS to determine different types of magnetite, and to distinguish different compositions of magnetite associated with mineralization of massive sulfides. The compositional data were investigated by the state-of-the-art multivariate classification technique, PLS-DA, to classify different deposit/rock samples, and to detect discriminator
elements for VMS deposits. This chapter also establishes discrimination models for VMS deposits by PLS-DA of EPMA data from this study and that from Dupuis and Beaudoin (2011). To establish discrimination models classifying magnetite from various mineral deposit types, magnetite data from studied VMS deposits and VMS-associated BIFs are integrated with that from the Ni-Cu, IOCG, IOA, porphyry deposit types and the Bayan Obo REE-Fe-Nb deposit from the literature. PLS-DA models defined by magnetite data from various mineral deposit types are used to determine provenances of magnetite from till samples collected from the Izok Lake and Halfmile Lake areas.
Chapter 5 summarizes the major achievements and conclusions of the research project. Appendices I to IX contain additional material that is not or only partially included in the manuscripts. Appendices I to III present PLS-DA variable contributions for Figures 4-4B, 4-6B and 4-7B respectively. Appendix IV present the range of detection limits for EPMA and LA-ICP-MS. Appendices V and VI present the EMPA and LA-ICP-MS raw data respectively for magnetite from the Izok Lake deposit, its host berocks and till covering the deposit nearby area. Appendices VII and VIII present the EMPA and LA-ICP-MS raw data respectively for magnetite from the Halfmile Lake deposit, its host berocks and till covering the deposit nearby area. The EMPA and LA-ICP-MS raw data from the Ansil, Horne, Lac Dufault, Bell-Allard, Amulet A-Upper & Lower, Normetal, Quemont, Poirier, Little Bay, Turgeon, Lasail, Brunswick #6, and Brunswick #12 VMS deposits as well as the Austin Brook oxide- and sulfide-facies BIFs are respectively presented in Appendices IX and X.
Chapter 2
.
“The surface texture and morphology of magnetite from the Izok Lake volcanogenic massive sulfide deposit and local glacial sediments, Nunavut, Canada: Application to
mineral exploration”
Résumé:
La magnétite est un minéral commun trouvé dans un large panel de gîtes minéraux et dans différents environnements géologiques. L’étude des textures de surface et de la morphologie de la magnétite peut fournir des informations utiles pour 1) discriminer différents types de magnétite comme celles attribuées aux environnements magmatiques, métamorphiques et supergènes, 2) identifier les roches encaissantes, 3) la provenance des sédiments, et 4) reconnaître les processus chimiques et mécaniques affectant les grains pendant l’érosion, le transport et après la déposition dans les environnements sédimentaires. Dans cette étude, les grains de magnétite du gisement de sulfures massifs volcanogènes Izok Lake (Nunavut, Canada) et du till recouvrant la région ont été investigués par microscopie électronique à balayage, analyse de libération minérale, et microscopie optique pour documenter les associations minérales, les textures de surface, les formes de grains et la distribution des tailles de grains. Des évidences telles que 1) les relations de contact entre la magnétite et la sphalérite, 2) les inclusions de sphalérite et de chalcopyrite dans la magnétite, et 3) les intercroissances de magnétite avec de l’actinolite et de la gahnite suggèrent que dans le gisement d’Izok Lake et dans la zone de réseaux de veinules (stringer) riche en gahnite, la magnétite a été formé par remplacement des sulfures lors du métamorphisme régional de faciès schiste vert supérieur à amphibolite. La magnétite des formations de fer peut résulter des réactions d’oxydation-dissolution de l’almandin, ou de la
magmatique, euhedral à grains fins avec de l’ilménite, du plagioclase et de la hornblende a été identifiée dans le gabbro encaissant. Des intercroissances de magnétite à la surface de magnétite pré-existante et d’autres minéraux métamorphiques surimpriment les processus supergènes affectant les roches encaissantes et les sédiments après le métamorphisme. La magnétite du till autour du gisement d’Izok Lake est principalement marquée de micro-textures d’origine mécanique telles que broutures en forme de croissants, cannelures profondes, escaliers avec des marches conchoïdales (arc-shaped steps). Ces textures sont la preuve d’un transport par d’épais feuillets de glace continentale. Une petite proportion des grains de magnétite est caractérisée par des factures de percussion en forme de V. Ces fractures indiquent que les grains ont été transportés en milieu fluviatile et/ou glacio-fluviatile. La forme, la distribution de la taille des grains, et les associations de magnétite dans le till suggèrent qu’à proximité du gisement d’Izok Lake, la majorité du till provient du gisement bien qu’une forte proportion des grains soit dérivée des formations de fer, du gabbro encaissant et des dikes Mackensie.
Abstract:
Magnetite is a common mineral found in a wide range of mineral deposits and in different geological environments. The study of surface textures and morphology of magnetite can provide information that is useful to 1) discriminate different types of magnetite such as that attributed to magmatic, metamorphic and supergene environments, 2) identify host bedrocks, 3) sediment provenance, and 4) recognize chemical and mechanical processes affecting grains during erosion, transport, and after deposition in sedimentary environments. In this study, magnetite grains from the Izok Lake volcanogenic massive sulfide deposit (Nunavut, Canada) and from till covering the area have been investigated using scanning electron microscopy, mineral liberation analysis, and optical microscopy to document their mineral associations, surface textures, grain shape and size distribution. Evidences such as 1) contact relations between magnetite and sphalerite, 2) sphalerite and chalcopyrite inclusions in magnetite, and 3) intergrowths of magnetite with actinolite and gahnite suggest that in Izok Lake deposit and related gahnite-rich stringer zone, magnetite formed by replacement of sulfide minerals during regional, upper greenschist to
amphibolite facies metamorphism. Magnetite from iron formation also formed as a result of oxidation-dissolution of almandine, or breakdown of Fe-bearing minerals during metamorphism. Euhedral, fine-grained magmatic magnetite in association with ilmenite, plagioclase and hornblende was identified in bedrock gabbro. Magnetite overgrowths on the surface of existing magnetite and other metamorphic minerals fingerprinted the supergene processes affecting bedrocks and sediments after metamorphism.
Magnetite in till around the Izok Lake deposit is mostly imprinted by mechanical microtextures such as crescentic gouges, deep grooves, arc-shaped steps, and troughs that are diagnostic of transportation by thick continental ice sheets. A small proportion of magnetite grains characterized by V-shaped percussion cracks also indicate transportation by fluvial and/or glaciofluvial environments. Shape, grain-size distribution, and mineral association of magnetite in till suggest that in vicinity of the Izok Lake deposit, till has mainly been fed by the deposit and related alteration zones, though, a high proportion of grains have been derived from iron formations, bedrock gabbro, and Mackenzie dikes.
Introduction:
2.1.
The surface texture and shape of detrital mineral grains can be used to document their geological history from hypogene formation through erosion, transportation and deposition (e.g. Townley et al., 2003; McClenaghan, 2005). These eroded minerals may undergo mechanical abrasion and chemical alteration during transport from bedrock to depositional environments. During transport, minerals crack and/or fracture because of grain-to-grain impact (Mahaney, 2002). Before, during, or after deposition detrital grains can be modified by dissolution of chemically unstable interlocked minerals (e.g. sulfides), and precipitation of supergene minerals.
Each chemical or mechanical process may impart specific microtextures on mineral surfaces (Mahaney, 2002). The study of microtextures and shape of detrital grains may help to 1) distinguish chemical and/or mechanical processes responsible for the formation of these textures on mineral surfaces, 2) identify mode of transport (Kleesment, 2009), and 3) provide an estimation of transport distance from the source (e.g. Golubev, 1995; DiLabio,
textures of kimberlite indicator minerals (e.g. pyrope and chromite) in glaciated terrains and showed that these features reflect the distance and mode of glacial transport. However, Pokhilenko et al. (2010) concluded that these minerals are not useful indicators for short-term glacial transport, since their grain shape and surface textures were not changed after a few tens of kilometers of ice transport. Dill (2007) suggested that physically resistant minerals, such as corundum, kyanite and zircon, are reliable minerals for morphology-based environmental analysis in short-distance placer deposits, whereas Fe- and Ti-rich minerals, such as ilmenite and Ti-bearing magnetite, are good measures of long distance of transport.
The shape of gold particles has been used to estimate the distance of transport from the source (e.g. Fisher, 1945; Utter, 1979; Averill and Zimmerman, 1986; Knight and McTaggart, 1986; Grant et al., 1991; Stendal and Theobald, 1994; Youngson and Craw, 1999; Knight et al., 1999). Some researchers have suggested that the morphological evolution of gold particles is a function of the transport media as well as the distance of transport (e.g Hallbauer and Utter, 1977, Giusti, 1987; Hèrail et al., 1989; DiLabio, 1991; Townley et al., 2003). DiLabio (1991) proposed a simple classification for characterization of the shape and surface textures of gold particles in till. He stated that the proportion of “pristine”, “modified” and “reshaped” gold grains along the down-ice path shows the relative proximity to the ore zone. In vicinity of the ore zone, there are higher proportions of pristine gold particles. DiLabio (1991) concluded that the abundance of reshaped gold grains in a till sample indicates the remoteness to the source area.
Most previous textural studies of glacial sediments have primarily focused on quartz grains (e.g. Mahaney, 1991; Mahaney and Kalm, 2000; Mahaney et al., 1991, 2001; Alekseeva, 2005; Mathur et al., 2008; Sweet and Soreghan, 2010; Narayana et al., 2010). These studies reveal that quartz grains in till display characteristic microtextures (e.g. deep directional grooves, arc-shaped steps) that are specific to glacial dispersal trains. Evidence of these quartz textures has not been reported from other sedimentary environments. Mahaney et al. (1991) and Mahaney (1995) used fractures and abrasion features imprinted on quartz grains to identify local ice transport, overlying ice thickness, and depositional environments. Crescentic gouges are typically formed on the surface of quartz grains that are transported
by continental glaciers with a thickness of >800 m. These textures have never been observed on grains transported by cirque glaciers with thicknesses of less than ~200m. In this study, we examine the micro-scale surface textures and morphological features of magnetite grains from the ferromagnetic fractions of bedrock and till at the Izok Lake volcanogenic massive sulfide deposit (Nunavut, Canada) to evaluate if they may be useful for mineral exploration. Specifically, the objectives are to determine if the surface textures and morphological features in till can be used to 1) identify the nature of host bedrock, 2) determine the transport mechanisms, 3) estimate the distance of transport from the source, and 4) identify supergene processes that affected grains after deposition in sedimentary basins. Surface textures and morphology of magnetite grains from massive sulfides and host rocks are compared to that of magnetite grains in up- and down-ice till collected from various distances from the Izok Lake deposit to document the textures formed during erosion, transport and/or deposition. Magnetite is the focus of this study because: 1) it is a common iron oxide mineral found in different geological environments, 2) it is easily separated from sediments/disaggregated samples because it has the highest magnetic susceptibility among all naturally occurring minerals, 3) its physical properties (e.g. hardness, lack of cleavage) and mechanical behaviour (conchoidal fractures) are similar to quartz (Mandolla and Brook, 2010), and therefore surface textures of magnetite can be studied as indicators of transport media as well as depositional environments, and 4) its chemical composition allows discrimination of different types of mineral deposits (e.g. Beaudoin et al., 2007, 2009; Dupuis and Beaudoin, 2011; Dare et al., 2011, 2012; Nadoll et al., 2012, 2014; Sappin et al., 2014).
2.1.1. Geological setting
The Izok Lake deposit is an Archean bimodal-felsic Zn-Pb-Cu-Ag volcanogenic massive sulfide deposit located at 65° 38' 00'' N, 112° 47' 45'' W in the northern part of the Slave Structural Province, Nunavut Territory, Canada (Figure 2-1; Morrison, 2004; Hicken, 2012; Paulen et al., 2013). The deposit is situated under Izok Lake, which is 20 km west of Itchen Lake and 30 km north of Point Lake. The deposit is hosted within 2.7-2.67 Ga granite
Fyson, 1992; Morrison, 2004; Bleeker and Hall, 2007; Paulen et al., 2013). In the Izok Lake area, the PLF consists of felsic to mafic meta-volcanic, and meta-sedimentary rocks (Figure 2-1), and has been intruded by 2.68 and 2.58 Ga syn-volcanic to post-volcanic granitic plutons, and by the Helikian Mackenzie gabbro dikes swarm (Bleeker et al., 1999). These intrusive bodies seem to be volcanic feeders to the overlying flows. The gabbro is typically medium to coarse-grained, with an equigranular texture, and is massive to weakly foliated (Morrison, 2004). The gabbro dykes trend north to northwest, and cut the massive sulfide lenses of the Izok Lake deposit (Buchan and Ernst, 2004).
Figure 2-1. Simplified bedrock geology map of the Izok Lake deposit showing lithologies and massive sulfide lenses (modified from Morrison, 2004), and Location map of the Izok Lake area in Canada.
East of Izok Lake, the end of felsic volcanism is marked by a series of dacitic flows overlying rhyolite (Figure 2-1; Morrison, 2004). Felsic volcaniclastic rocks, dacitic, andesitic and basaltic flows, thin sulfide-rich iron formations, and turbiditic sedimentary rocks form the hanging wall of the Izok Lake deposit (Figure 2-1). Irregular granitic pegmatite, and diabase dikes subsequently cut all these lithologies (Morrison, 2004; Hicken, 2012). Carbonate and sulfide facies iron formations overlay dacite and basalt to the
east and north of Izok Lake (Thomas, 1978). Carbonate facies iron formation is well-bedded and consists of carbonate layers interwell-bedded with cherty beds. In southeast of the deposit, carbonate facies grades into a sulfide facies iron formation containing pods of zinc-rich massive sulfides.
The volcanic rocks in the Izok Lake belt have been altered by hydrothermal fluids followed by metamorphic overprint (Thomas, 1978; Money and Heslop; 1972; Morrison, 2004). A large, Na-depleted, sericitic alteration zone encloses the Izok Lake massive sulfide lenses, whereas the immediate footwall and hanging-wall rocks to the deposit are affected by aluminous alteration typified by the assemblage muscovite-biotite-sillimanite (Morrison, 2004). A metamorphosed magnesium enrichment alteration zone composed of chlorite, biotite and cordierite, formed in close association with the Izok Lake orebody (Thomas, 1978). Thomas (1978) suggested that the Mg alteration has been overprinted by locally intense silicification and sodium metasomatism. Volcanic and sedimentary rocks in the northern and central parts of the Izok Lake area are metamorphosed to the upper amphibolite-sillimanite grade forming a gahnite-rich zone at the margin of the massive sulfide bodies and the underlying stringer zone (Thomas, 1978; Bostock, 1980; Morrison and Balint, 1993, 1999). The gahnite-rich dacite hosting the stringer zone consists of gahnite, sillimanite, magnetite, illmenite, pyrite, pyrrhotite, chalcopyrite, sphalerite, quartz, biotite, plagioclase, and hornblende (Thomas, 1978; Bostock, 1980; Morrison and Balint, 1993, 1999; Morrison, 2004; Hicken, 2012; Hicken et al., 2013a). South of the Izok Lake area, the metamorphic grade decreases to the greenschist facies.
The Izok Lake deposit comprises 5 massive sulfide lenses with 14.8 Mt indicated resources grading 12.8% Zn, 2.5% Cu, 1.3% Pb, and 71 g/t Ag (Costello et al., 2012). The massive sulfides contain 25% pyrite, 24% sphalerite, 9% chalcopyrite, 8% pyrrhotite, 3% galena, and 3% magnetite (Morrison, 2004). In addition to these massive sulfide lenses, several gossans have been discovered in the Izok Lake area including a zinc-rich gossan on the west side of Iznogoudh Lake, referred to as the WIZ showing (Heslop, 1976; Money and Heslop, 1976; Figure 2-2). Several diabase dikes of the Mackenzie Swarm, trend north to northwest, crosscut the massive sulfide lenses of the Izok Lake deposit (Buchan and Ernst, 2004). The Mackenzie dikes are composed of plagioclase, pyroxenes, and 1-15%
fine-grained Fe-Ti oxides (Baragar et al., 1996). Magnetite is dominant in Mackenzie dikes, whereas ilmenite is subordinate or rare.
The Izok Lake area is a glaciated terrain affected by four phases of ice flow (Kerr et al., 1995; Dredge et al., 1996; Stea et al., 2009). Figure 2-2 shows the ice flow patterns in the Izok Lake region. Paulen et al. (2013) demonstrated that the oldest ice flow was directed towards the southwest (210° to 254°) followed by a flow directed towards the northwest (300° to 325°). The third ice flow from east to west-northwest (279° to 296°) was the dominant phase that shaped the present-day landscape of the area. Evidence of the youngest glacial flow direction towards the northwest (296° to 318°) is faint and rare, and are only found on outcrops east of Iznogoudh Lake (Paulen et al., 2013). Undulating topography, glacially streamlined bedrock hills surrounded by surficial sediments and abundant lakes are characteristic of the area. Till cover in the Izok area is generally thin, varying between < 0.5 m to 3 m (Dredge et al., 1996; Hicken et al, 2013).
Methodology
2.2.
2.2.1. Sampling methods
A total of 22 bedrock samples and 85 till samples were collected by Geological Survey of Canada (GSC) in the Izok Lake region in 2009 and 2010 (McClenaghan et al., 2012b; Hicken et al., 2013a,b). Heavy mineral concentrates (HMC) of GSC bedrock and till were prepared by the Overburden Drilling Management Limited (ODM; Ottawa, Canada) using methods described in McClenaghan et al. (2012b). Massive sulfide and host rock samples were disaggregated using Electric Pulse Disaggregation (EPD). Electric Pulse Disaggregation liberates minerals from rock by applying a high-voltage electric current, which breaks the rock along grain boundaries. The resulting mineral morphologies after EDP reflect the original shape and grain size (Rudashevski et al., 2002; Cabri et al., 2008). A heavy mineral preconcentrate was then produced for each disaggregated rock and for till samples using a shaking table (McClenaghan, 2011). The table preconcentrate was refined using methylene iodide diluted to a specific gravity of 3.2. The heavy mineral concentrate was then further separated into ferromagnetic and non-ferromagnetic fractions using a hand magnet. The ferromagnetic fraction contains mainly mineral grains and aggregates in which
magnetite and/or pyrrhotite are principle components. The < 0.25 mm ferromagnetic fraction was archived, whereas the 2 to 0.25 mm ferromagnetic fractions of selected GSC till and bedrock samples were shipped to Université Laval (ULaval) for further preparation and examination of grains.
Figure 2-2. Locations of bedrock and till samples in the Izok Lake area (modified from Hicken, 2012). In the map, the prefix 09-MPB has been removed from the sample names, as sample 09-MPB-R64 is shown as R64.
Each ferromagnetic fraction was homogenized by hand shaking the container. Each sample was poured onto a sheet of paper and divided into four sections, and one of the four sections was selected as a subsample, according to the method described by Gerlach and Nocerino, (2003). The minimum number of grains for a representative subsample, based on previous microtexture investigations, has been determined to be 25 (Krinsley and
document the range in shape of gold grains in stream sediments. Krinsley and Doornkamp (1973), Baker (1976), and Mahaney (2002), also stated that study of at least 25 quartz grains was sufficient to record variations in surface textures and morphology of quartz in a sample. The splitting procedure was repeated until the subsample contained between 25 and 50 ferromagnetic particles. A ferromagnetic particle is a mineral aggregate in which magnetite may be a component. In this study, 150 magnetite grains from 6 bedrock samples, and 225 magnetite grains identified in ferromagnetic fractions of 9 till samples were examined for their surface textures using Scanning Electron Microscopy (SEM). The 6 rock samples include 1) sample R60 from massive sulfides, 2) sample 09-MPB-R64 from massive sulfides adjacent to gahnite-rich zone, 3) sample 09-MPB-R61 from gahnite-rich dacite within the deposit stringer zone, 4) samples MPB-R42 and 5) 09-MPB-R90 from iron formations located 6 km up ice to the east of the deposit, and 6) sample 09-MPB-R92 from the bedrock gabbro. The location of till samples, and directions of ice flows as identified by Paulen et al. (2013) are illustrated in Figure 2-2. Other subsamples were also prepared from the bedrock and till samples to determine modal mineralogy, mineral association, grain size distribution, and angularity of magnetite grains using Mineral Liberation Analysis (MLA).
2.2.2. Analytical methods
2.2.2.1. Scanning Electron Microscopy (SEM)
The SEM was used to examine and document the surface microtextures, morphological features, and shape of magnetite grains in the ferromagnetic fraction. Subsamples were cleaned using acetone in an ultrasonic bath for 5 minutes. Longer immersion in ultrasonic baths may alter existing surface textures and even create new microtextures (Porter, 1962; 1973; Vos et al., 2014). Grains were mounted on 3 mm thick carbon discs taped to 12.5 mm aluminum stubs. Grains were coated with gold and palladium. A JEOL JSM-840A SEM at ULaval equipped with Back-Scattered Electron (BSE) and Secondary Electron (SE) modes were used to examine magnetite grains. The accelerating voltage was 15 KeV and the beam current was 60 µA, at a working distance of 20 mm. Magnetite grains in each subsample were identified during Scanning Electron Microscopy using Energy Dispersive X-ray.
2.2.2.2. Mineral Liberation analysis (MLA)
The subsamples for the MLA were mounted in epoxy, and the surface of the mounts was polished. The analyses were performed using the MLA 650 Field Emission Gun Environmental SEM at Queen’s University, using an accelerating voltage of 25 kV and beam currents of 10-15 nA. The MLA software collects BSE images over the sample frame to automatically discriminate mineral grain boundaries and map distribution. Each particle is subdivided into grains, and grain boundaries are distinguished based the greyscale variations in the BSE images. Each grain is further analyzed by X-ray, and the collected spectra are compared to the library of reference spectra for mineral identification (Fandrich et al., 2007; Sylvester, 2012). For each sample, MLA produces different data sets including modal mineralogy, mineral association, particle properties, grain properties (including angularity, area, perimeter, weight proportion, length, breadth, angle length, aspect ratio, and form factor), particle size distribution, and grain size distribution (Fandrich et al., 2007). Quantitative mineralogical data (e.g. modal mineralogy, and grain properties and size distribution) generated by the MLA measurement software for each sample are presented by DataView software and can be exported by the operator (Fandrich et al., 2007). Table 2-1 and Table 2-2 summarize the modal mineralogy and weight proportion of minerals in the ferromagnetic fractions of the Izok Lake bedrock and till samples, respectively.
Results
2.3.
2.3.1. Surface textures of magnetite in bedrock samples
Table 2-3 summarizes the proportion of different microtextures found on the surface of magnetite grains in bedrock samples. The proportion of a surface texture in bedrock samples indicates the percentage of grains that are characterized by the given texture. The occurrence of each surface texture has been assessed independently to that of other microtextures, as even if one texture is overprinted by another both textures have been counted.
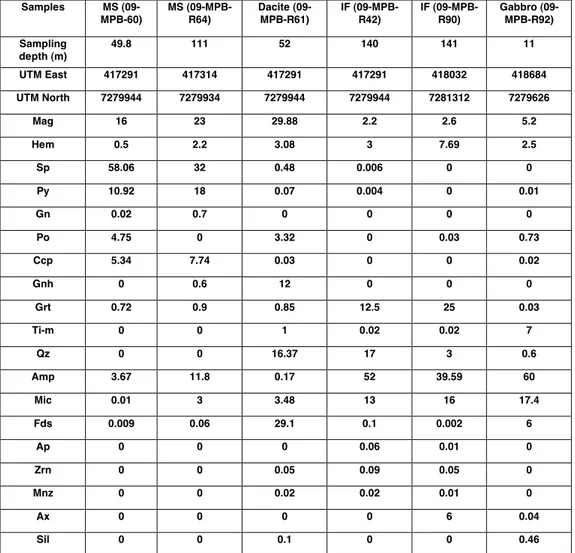
Table 2-1. The Izok Lake studied bedrock samples description. Weight proportions of minerals in ferromagnetic fractions of each sample are presented.
Samples MS (09-MPB-60) MS (09-MPB-R64) Dacite (09-MPB-R61) IF (09-MPB-R42) IF (09-MPB-R90) Gabbro (09-MPB-R92) Sampling depth (m) 49.8 111 52 140 141 11 UTM East 417291 417314 417291 417291 418032 418684 UTM North 7279944 7279934 7279944 7279944 7281312 7279626 Mag 16 23 29.88 2.2 2.6 5.2 Hem 0.5 2.2 3.08 3 7.69 2.5 Sp 58.06 32 0.48 0.006 0 0 Py 10.92 18 0.07 0.004 0 0.01 Gn 0.02 0.7 0 0 0 0 Po 4.75 0 3.32 0 0.03 0.73 Ccp 5.34 7.74 0.03 0 0 0.02 Gnh 0 0.6 12 0 0 0 Grt 0.72 0.9 0.85 12.5 25 0.03 Ti-m 0 0 1 0.02 0.02 7 Qz 0 0 16.37 17 3 0.6 Amp 3.67 11.8 0.17 52 39.59 60 Mic 0.01 3 3.48 13 16 17.4 Fds 0.009 0.06 29.1 0.1 0.002 6 Ap 0 0 0 0.06 0.01 0 Zrn 0 0 0.05 0.09 0.05 0 Mnz 0 0 0.02 0.02 0.01 0 Ax 0 0 0 0 6 0.04 Sil 0 0 0.1 0 0 0.46
Abbreviations. MS: massive sulfides. IF: iron formations. Mag: Magnetite. Hem: Hematite. Sp: Sphalerite. Py: Pyrite. Gn: Galena. Po: Pyrrhotite. Ccp: Chalcopyrite. Ghn: Gahnite. Grt: Garnet group minerals such as pyrope, almandine, spessartine, and andradite. Ti-m: Ti-bearing minerals such as ilmenite, titanomagnetite, and titanite. Qz: Quartz. Amp: Amphibole group minerals such as actinolite, hornblende, and grunerite. Mic: Mica group minerals such as biotite and muscovite. Fds: Feldspare group minerals such as albite, anorthite, and orthoclase. Ap: Apatite. Zrn: Zircon. Mnz: Monazite. Ax: Axinite. Sil: Sillimanite.
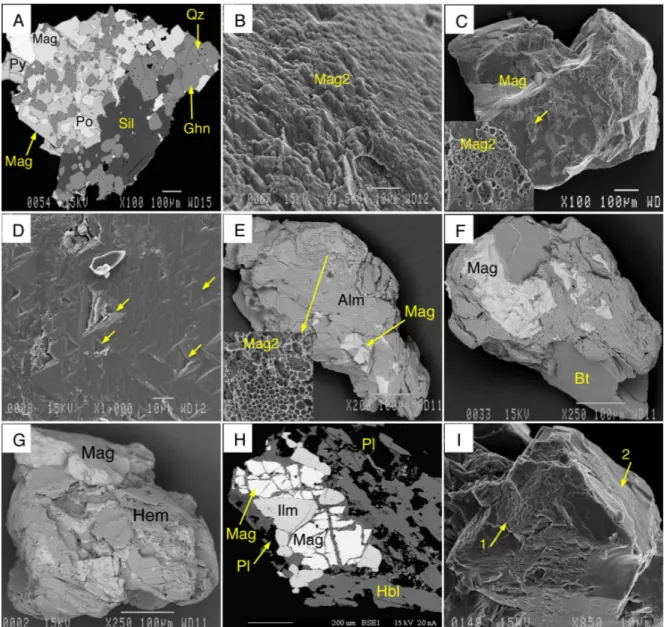
A variety of grain morphologies and surface microtextures were observed on magnetite from the Izok Lake massive sulfides (Figure 2-3). Grains from massive sulfide samples are dominated by mineral aggregates in which magnetite is associated with sulfide and silicate minerals (Figure 2-3A). Magnetite from massive sulfides (MS-Mag) is subhedral to anhedral, medium to coarse grained (0.05-0.8 mm), and commonly hosts sphalerite and chalcopyrite inclusions (Figure 2-3B). Pyrite, sphalerite, and chalcopyrite are the abundant sulfide minerals in association with MS-Mag. Pyrite is typically cubic shaped, whereas
MS-Mag is intergrown with sphalerite and contains inclusions of muscovite and sphalerite. Muscovite, biotite, and amphibole (actinolite with lesser amounts of hornblende) are either associated with sulfides and MS-Mag, or are inclusions in these minerals. Mineral aggregates from the central parts of massive sulfide lenses (sample 09-MPB-R60) tend to be coarse-grained, whereas samples from margins of the massive sulfides (sample 09-MPB-R64) are characterized by fine-grained magnetite with sulfide inclusions (Figure 2-3A & B).
Figure 2-3C shows irregular grains of magnetite in sphalerite. Sphalerite contains inclusions of chalcopyrite, whereas magnetite contains inclusions of both sphalerite and chalcopyrite. Despite the central parts of massive sulfides where magnetite is intergrown with actinolite (Figure 2-3B), towards the margins, near the contact between massive sulfides and gahnite-rich host rocks, banded actinolite and magnetite are common (Figure 2-3D). In massive sulfides, parting planes are a characteristic texture in 10% of magnetite grains (Figure 2-3E). Parting planes form as a result of external stress in minerals, without formation of cleavage planes (Chang et al., 1998). External stress breaks minerals along their planes of structural weakness. Parallel micro-intergrowths of fine layers of magnetite in sphalerite can cause octahedral parting planes (Figure 2-3E). Dissolution textures are the most widespread surface texture characterizing 50% of MS-Mag (Figure 2-3F). Dissolution textures are commonly overprinted by precipitation textures. Porous magnetite (Mag2) is a precipitation product observed on the surface of 20% of the grains (Figure 2-3G). In Figure 2-3H, the surface of an actinolite aggregate is covered by a thin layer of porous Mag2. Mag2 precipitated on the surface of early-formed grains locally forms layers of non-porous crystals as shown in Figure 2-3I.