HAL Id: hal-02399183
https://hal.archives-ouvertes.fr/hal-02399183
Submitted on 9 Dec 2019
HAL is a multi-disciplinary open access
archive for the deposit and dissemination of
sci-entific research documents, whether they are
pub-lished or not. The documents may come from
teaching and research institutions in France or
abroad, or from public or private research centers.
L’archive ouverte pluridisciplinaire HAL, est
destinée au dépôt et à la diffusion de documents
scientifiques de niveau recherche, publiés ou non,
émanant des établissements d’enseignement et de
recherche français ou étrangers, des laboratoires
publics ou privés.
Characterization of home-made graphite/PDMS
microband electrodes for amperometric detection in an
original reusable glass-NOA®-PDMS electrophoretic
microdevice
J. Gouyon, F. D’orlyé, S. Griveau, F. Bedioui, A. Varenne
To cite this version:
J. Gouyon, F. D’orlyé, S. Griveau, F. Bedioui, A. Varenne.
Characterization of home-made
graphite/PDMS microband electrodes for amperometric detection in an original reusable
glass-NOA®-PDMS electrophoretic microdevice.
Electrochimica Acta, Elsevier, 2020, 329, pp.135164.
�10.1016/j.electacta.2019.135164�. �hal-02399183�
Characterization of home-made graphite/PDMS microband electrodes for amperometric
1
detection in an original reusable glass-NOA
®-PDMS electrophoretic microdevice
2
Gouyon J.1,2,d’Orlyé F.1, Griveau S.1, Bedioui F.1, Varenne A.1 3
1
Chimie ParisTech, PSL University, CNRS 2027, Institute of Chemistry for Life and Health Sciences, SEISAD 75005 Paris,
4
France
5
2
French Environment and Energy Management Agency, 20, avenue du Grésillé- BP 90406 49004 Angers Cedex 01 France
6
E-mail adress: anne.varenne@chimieparistech.psl.eu (Varenne A.)
7
Abstract
8A new dismountable and reusable microchip for electrophoretic separation coupled to amperometric detection was 9
developed. For this purpose, a new home made three-microbands electrode system was developed and 10
microfabricated based on screen-printing for the inclusion of graphite/polydimethylsiloxane (C-PDMS) composite in 11
microchannels down to 30 µm width. The composition of the composite as well as the fabrication methodology were 12
optimized for an easy handling and an optimized electrochemical behavior. The electrochemical characterization of 13
this composite material was first performed in bulk format (disc-shaped electrode, 6 mm diameter). It was then 14
transposed to the micrometric scale for its integration in an original glass-NOA81®-PDMS microfluidic device 15
allowing for reversible sealing. The microband electrodes were characterized by scanning electron microcopy and 16
cyclic voltammetry, illustrating a good control of the microelectrode width. Then, the analytical performances of the 17
C-PDMS composite microelectrodes were evaluated using Ru(NH3)63+ and FcMeOH as model electroactive
18
molecules. The electrophoretic separation and quantitation of Ru(NH3)63+ were then performed in a background
19
electrolyte made of hydrochloric acid and sodium chloride, leading to a LOD and a LOQ of 3.4 µmol.L-1 and 11.3 20
µmol.L-1 , respectively. The re-openable NOA-based microdevice permits to regenerate the electrode surface by 21
simply repositioning the microband on a new spot, allowing for robust analysis in a reusable system. 22
Keywords
23Microelectrode – Screen Printing – Chronoamperometry – Electrophoresis – Microchip 24
1. Introduction
25Microchip electrophoresis is a separation method dedicated to short-time analysis of diluted samples when coupled 26
with quite sensitive detection methods. Diverse strategies have been developed for detection within microfluidic 27
channels, such as optical detections [1] (UV absorption, laser induced fluorescence (LIF)), mass spectrometry [2] or 28
electrochemical detections [3]. The use of conductive surfaces directly integrated into the microchannels for 29
electrochemical detection is of interest since the integration and miniaturization of electrodes are simple, allow for a 30
good sensitivity (similar to LIF) and are relevant for the detection of many analytes, as long as they are 31
electroactive [4]. 32
The development of amperometric detectors in microchip electrophoresis device has been studied with different 33
electrode materials and geometries for a wide range of applications. The main advantages of this detection mode are 34
its low cost and easy integration into electronics since the signal is electric by nature. In addition, it provides high 35
sensitivity in comparison to optical detection such as UV absorption. It is also possible to infer higher detection 36
selectivity by modification of the electrode surface so as to act as a filter towards non-desirable analytes in complex 37
matrices. Whereas the electrode surface modification may lead to the selective measurement of one target analyte, 38
environmental and biochemical analyses often require the selective detection of several target analytes in a complex 39
mixture. In this context, it can be relevant to integrate an upstream separation step, mainly of electrokinetic nature, in 40
the total analysis process that would allow combining selective and sensitive measurements. Such strategy has been 41
developed in a classical capillary format but also in microchip format [5]. In the latter format, the main challenge 42
relies in isolating the detection system from the high separation voltage (in the order of kV) in order to preserve both 43
signal to noise ratio and potentiostat integrity. Nowadays, commercial miniaturized devices for microchip 44
electrophoresis with electrochemical detection are available [6], but they are still expensive due to the use of 45
precious metals to fabricate microelectrodes, such as platinum (Pt) or gold (Au). They also do not offer the required 46
flexibility for cleaning or reusing them easily. The use of cheaper materials for industrial production of smarter 47
devices is therefore interesting. 48
Carbon-based electrodes, made from less expensive materials, have shown great interest since they allow a wide 49
variety of atomic states and physical forms, high conductivity at low cost and generally offer a wider electrochemical 50
potential window compared to Pt or Au. Interesting examples in the literature show the implementation of microchip 51
electrophoresis in channels integrating carbon-based electrodes for in–line electrochemical detection (fibers [7], 52
inks [8], pastes [9], composites [10]) dedicated to diverse applications such as the detection of organic compounds 53
[11]. Particularly, composites made of polydimethylsiloxane (PDMS) and carbon particles are of interest since 54
PDMS is one of the most commonly used polymers for microfluidic applications. Carbon/PDMS (C/PDMS) was 55
mainly used for the conception of sensors for mechanical application [12] and phosphate monitoring[13], obtained 56
by casting appropriate C/PDMS composite in 3D-printed molds, or used as material for strain and temperature 57
sensing[14]. Actually, the resistivity of the material changes with the temperature, allowing for good heat sensing in 58
robotics[15] and possible piezosensor [16] since the resistivity is also affected by the composite strain. Indeed, 59
introduced for the first time in microsystems for valves and pumps fabrication [17], C/PDMS composite conductivity 60
and mechanical properties have been characterized [18], showing the effect of mechanical stress on the electrical 61
capacity. 62
C/PDMS can also be used for its electrochemical properties. According to Sameenoi et al [19], PDMS can be used as 63
a sealing agent between the carbon composite electrode and a microfluidic system made in the same polymer, thanks 64
to its physico-chemical properties (covalent bonding by plasma treatment, elasticity etc). Moreover, the electrodes 65
made of carbon and PDMS show low capacitive current, which permits to reach lower limit of detection (LOD). The 66
authors described a process in which they integrated a carbon-based paste into a micromolded microchannel in order 67
to obtain a well-defined microband of 250 µm width for electrochemical detection of organic compounds (dopamine, 68
with a LOD of 16.8 µM), in a microfluidic channel, thus showing the interest of carbon-based composite as material 69
for electrochemical detection. Also, Deman et al. developed carbon/PDMS composites (C/PDMS) as materials to 70
generate an electric field for the manipulation of particles and cells in microchip with similar fabrication pathways 71
[20], showing the possible use of this kind of material in sealed PDMS microchip [21]. Nonetheless, the plasma 72
treatment required to seal the electrode within the microchannel can be harmful, leading to an increase of the 73
capacitive current and a decrease of the signal to noise ratio, thus altering the performance of the electrode for 74
analytical applications. In this context, there is still a great need for a simple and gentle sealing process combined to 75
an electrode regeneration/cleaning strategy since some passivation of the detection electrodes may occur over time . 76
All the above mentioned studies are related to the preparation and easy use of the microelectrodes within a 77
monochannel at microscale but none of them was dedicated to the coupling of the electrochemical detection with a 78
simultaneous electrophoretic separation. In this work, we propose a new homemade detection system that includes a 79
composite working microband electrode made of C/PDMS (30 µm width) and either two other bands of C/PDMS (in 80
a 3-electrodes setup) as integrated reference and counter-electrodes, or a silver silver-chloride (Ag/AgCl) wire as 81
pseudo-reference electrode (pseudo-RE) in a 2-electrodes setup. An easy and innovative integration strategy was also 82
developed in a reopenable NOA-based microfluidic channel, allowing multiple repositioning of the microband 83
electrode for robust analysis in reusable system. The coupling of this electrochemical detection with microchip 84
electrophoresis was also demonstrated and optimized using Ru(NH3)63+, a model molecule
85
2. Experimental
862.1. Reagents
87
All reagents were of analytical grade: graphite powder noted as C (2-15 µm microcrystal grade 99.9995%, Alfa 88
Aesar, Germany), PDMS RTV 615 kit (Momentiv, France), PDMS Sylgard 184 kit (Dow Corning, Germany), SU8 89
2075 (Microchem, USA), hexaamine ruthenium(III) chloride (noted as Ru(NH3)63+, 98%, Sigma Aldrich), ferrocene
90
methanol (noted as FcMeOH, 97%, Sigma Aldrich), sodium phosphate dibasic (99%, Sigma Aldrich), sodium 91
phosphate monobasic (99%, Sigma Aldrich), hydrochloric acid (HCl, 37%, Acros Organics), sodium chloride (NaCl, 92
Bio-ultra ≥ 99.5 %, Sigma), potassium chloride (KCl, ≥ 99.5 %, Fluka) and ultrapure water (Purelab Flex System, 93
Veolia, France) for preparation of aqueous solutions. 94
2.2. Micro-electrode fabrication
95
The C/PDMS electrodes were fabricated according to the method described in Figure 1: first, a SU8 mold was 96
prepared by spin-coating a few milliliter of SU8 2075 on a silicon wafer (4″, Prolog Semicor Ltd, Ukraine), 97
previously dried on a heated plate at 200°C for 15 min. The spread was performed for 15 s at 500 rpm and 30 s at 98
2000 rpm to obtain a theoretical thickness of 110 µm [22]. The wafer was then heated at 65°C for 10 min and 95°C 99
for 20 min. A plastic mask containing the channel design (both 3-electrode and 2-electrode setup, described in Figure 100
2-a/b) was laid on the wafer prior to UV exposure (100% power for 11s UV-KUB 2 Kloé, France). The mask was 101
obtained designing it on Clewin5 software and by printing it with a photoplotter Filmstar (Bernier Electronik, 102
France) and Kimolek paper (Bernier Electronik, France). The wafer was then heated at 65°C for 5 min and 95°C for 103
10 min prior to the developing step which consists in immersing the wafer into propylene glycol monomethyl ether 104
acetate (≥ 99.5%, Sigma-Aldrich) at 100 rpm for 15 min. The positive pattern was then revealed, according to the 105
design of the mask. Sylgard PDMS was prepared by mixing the elastomer and the curing agent (from the kit) at a 106
ratio 10:1 prior to degassing. The mix was then poured on the silicon wafer containing the SU8 pattern, heated at 107
70°C for 1 h and unmolded to obtain the negative pattern in the PDMS substrate. The wafer can be reused to make 108
multiple PDMS replica. A mix of PDMS and graphite powder was prepared as a conductive paste for microelectrode 109
fabrication. The PDMS was made of a mix of RTV 615 elastomer and an associated curing agent (from the kit) at a 110
ratio 10:1. The mix was made prior to the incorporation of graphite powder to avoid pre-reticulation that occurs even 111
at ambient temperature. The paste was made in a plastic flask by properly mixing both components by hand with a 112
spatula until complete integration of graphite powder and homogeneous paste, as already mentioned in the literature 113
[20]. Other technics can be employed to mix both components, such as the use of a miller [18] or dispersion of 114
components in toluene for easier mixing [16]. Then, the C/PDMS paste was spread with a spatula on the surface of 115
the PDMS mold in order to fill the molded microchannel. The excess of paste was removed by carefully polishing 116
the surface with paper and carbide paper (Presi, France). The electrode was then heated at 70°C for 3 h prior to use, 117
to insure the complete reticulation of the mix. 118
Figure 1 – Fabrication process of the 3-electrodes setup made of C/PDMS mix. The fabrication process of
120
2-electrodes system is similar, except the use of another mask that contains only 1 band.
121 122
(a) (b)
(c)
Figure 2 – Scheme of the (a) 3-electrodes setup, (b) 2 -electrodes setup and (c) mask for the fabrication of the microchip.
2.3. Microchip fabrication
123
The microchips were fabricated on glass slides previously pierced to create the wells for electrophoresis purpose 124
with a LASER cutter (GCC Laser Pro-CO2 Laser Machine). The wells have to be perfectly aligned against the 125
drawing of the mask to avoid any perturbations when using the setup for electrophoretic procedure. Briefly, a PDMS 126
counter-mold (made by the methodology described above) containing the positive design (an illustration of the 127
microchip mask used for the photolithographic process is shown in Figure 2-c) is degassed in a dessicator for 15 min 128
and then is pressed on the glass slide previously covered with liquid Norland Optical Adhesive 81® (NOA81®, 129
Epotecny, France). The NOA81 excess in the holes is removed with paper towels before exposition to 365 nm UV 130
light for 1 min (UV Biolink BLX, Vilber Lourmat, France) in order to complete the NOA81 reticulation. The PDMS 131
counter-mold is then removed, leading to an open-microchannel molded in NOA81. Pipet tips (2-200 µL, Fischer 132
Scientific, France) were cut and used as wells, fixed on top of glass holes with few amounts of NOA81 reticulated 133
according to the same procedure. Two kind of chips were used for characterization and analysis respectively: the first 134
one consists in a single channel of 3.5 cm length, 150 µm width and 40 µm height. The second one consists of a 135
simple cross-shape section, with a separation channel of 100 µm width and 4 cm length, and the other channel of 100 136
µm width and 0.5 cm length (Figure 2-c). The wells are circles of 3 mm diameter. The additional channels and pillars 137
are used for the fabrication, to remove bubbles and insure the horizontality of the setup when the PDMS counter-138
mold is pressed against the glass slide. This is required since the microchannel is sealed with the electrode PDMS 139
support. 140
2.4. Scanning electron microscopy imaging
141
C/PDMS electrodes were characterized by Scanning electron microscopy (SEM). SEM images were acquired with 142
SEM-FEG LEO 1530 (Zeiss) equipped with a PGT microanalyser with a Ge detector, after vaporization of a gold 143
layer (about 5 nm) on the samples. 144
2.5. Electrochemical measurements
145
Electrochemical characterizations of C/PDMS electrodes were performed by cyclic voltammetry (CV) with a Model 146
263A Potentiostat/Galvanostat (Princeton Applied Research, USA) coupled with the Powersuite software for 147
substrate electrodes, and an EA164 QuadStat with an E-corder 410 unit coupled with the EChem software for 148
microelectrodes (eDAQ, Australia). The characterization of flat substrates was made with a 3-electrode setup 149
(platinum wire as counter-electrode, CE, and silver-silver chloride wire as a pseudo-reference electrode). The 150
characterization of the microband electrodes was made with a 3-electrode integrated setup (50 µm C/PDMS band as 151
working electrode, and 250 µm C/PDMS band as CE and pseudo-RE, see Figure 2-a). 152
2.6. Chronoamperometric measurements coupled with electrophoresis microchip
153
Chronoamperometric measurements coupled with electrophoretic separation were performed with an isolated 154
wireless potentiostat Model 9051 (Pinnacle, USA) on 30 µm C/PDMS electrodes placed in in-channel configuration 155
(< 10 µm-off the exit) against the glass-NOA® cross microchip (Figure 2-c and Figure 3). High voltages applied for 156
the electric field were performed with an ER430 high voltage sequencer (eDAQ, Australia). Platinum wires (0.1 mm, 157
99.99%, Good Fellow) were used as electrodes for the application of the separation voltage, immersed in the wells 158
that contain the background electrolyte (BGE) and the sample. An Ag-AgCl wire was used as CE and pseudo-RE for 159
chronoamperometric experiments. The injection parameters for Ru(NH3)63+ were as follow: BGE made of HCl 1
160
mmol.L-1 and NaCl 50 mmol.L-1. A gated injection was performed, with a loading step with separation voltage such 161
as: S = Ground, SW = -300 V, B = Ground, BW = -500 V for 100 s. The injection occurs for 2 s with: S = Ground, 162
SW = -150 V, B = Float, SW = -1000 V. The separation was the same as the loading step, for higher analysis time. 163
The detector was set at +0.1 V/Ag-AgCl. The studied solutions consist of Ru(NH3)63+ (from 250 to 10 µmol.L-1) in
164
the BGE. A washing with the BGE was performed between each measurement, by simply flowing it with a syringe. 165
The measure of the electroosmotic flow (eof) was performed in the same conditions, except with a sample containing 166
FcMeOH 0.2 mM in the same media and with a detection potential of +0.8 V/Ag-AgCl. It has to be noted that the eof 167
was estimated to be less than 3.10-5 cm2.V-1.s-1 since no signal was measured after more than 30 min of analysis. 168
169
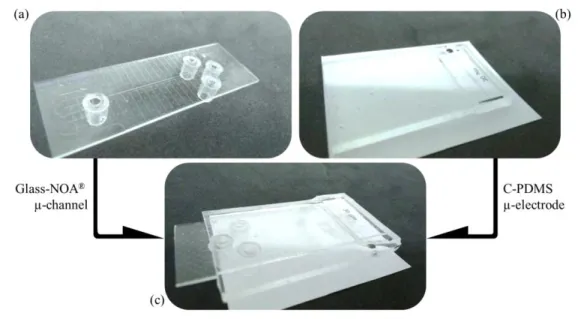
Figure 3 – Picture of (a) the Glass-NOA® microchannel, (b) the C-PDMS electrode and (c) the assembled
170
device for electrophoretic analysis
3. Results & Discussion
1723.1. Optimization of C/PDMS ratio for microelectrode preparation
173
The composite material conceived for microelectrode preparation is made of two compounds. The first is the 174
conductive material, graphite powder with high purity (99,9995%) and a particle size inferior to 15 µm. The purity of 175
the graphite powder is of importance since interfering electrochemical signal can occur if some electroactive species 176
remain in the matrix (such as metals). The particle size was chosen for miniaturization of the microband electrode 177
down to 30 µm, as discussed later. Preliminary experiments were carried out by preparing different mixtures of 178
graphite powder and PDMS at different weight ratios to get optimized material in terms of ease of fabrication, ease 179
of handling, electric conductivity and mechanical stability. To 1 g of PDMS mixture (composed of the monomer and 180
a reticulating agent) prepared a few minutes before to avoid reticulation, the mixtures were obtained by addition of 181
the corresponding amount of graphite powder and the obtained mixture was immediately mixed by hand with a 182
spatula. Different C/PDMS mixtures were studied with w/w% ratios of 4/8, 5/8, 6/8, 7/8 and 8/8. Lower ratios could 183
not be achieved since the graphite particles were too dispersed in the matrix after reticulation or gave a crumbly paste 184
after a long mixing time respectively. The mixtures 4/8 and 5/8 gave a relatively viscous paste, easy to mix and 185
spread on a glass slide. For ratios larger than 8/8, the amount of graphite powder was too high to be perfectly 186
incorporated to the PDMS matrix, hindering their further use... The fabrication process is reported in Figure 4. In 187
order to obtain flat surfaces for characterization, the pastes were spread onto microscope glass slides with a spatula 188
before curing (step 1). The spreading is less and less easy while the percentage of graphite increases in the paste, but 189
is still possible if the paste is correctly mixed. The reticulation of the paste for the solidification of the electrode is 190
insured by a heating step. According to the supplier, PDMS, is usually activated and reticulated during 1 h at 70°C. 191
The heating step for the reticulation of the composite has been optimized for 3 h instead of 1 h, as lower curing time 192
led to disintegration of the composites and/or sticking to the glass slide (step 3). The presence of graphite powder 193
seems to affect the kinetics of the PDMS reticulation, especially when the C/PDMS ratio is the highest (7/8 and 8/8). 194
The composites with those latter ratios were so fragile that the addition of PDMS on top of the substrate was required 195
in order to ensure the physical integrity of the electrode (step 2) and to disband them from the glass slide (step 4). 196
197
Figure 4 – Fabrication process of the composite substrate made of graphite powder and PDMS
198
The electrochemical properties of the different C/PDMS electrodes were studied by using Ru(NH3)6 3+
and FcMeOH 199
as redox probes. A preliminary study was first conducted by delineating a disk-shaped electrode by using a PDMS 200
stamp, in which a 6 mm diameter hole has been pierced with a puncher. For each substrate, the adhesion was good 201
and no leakage was to mention. Solutions were poured in the well, while RE and CE were immersed into the well 202
(Figure 5-a). 203
(a)
(b) (c)
Figure 5 – Scheme of the electrolytic cell with C/PDMS as working electrode WE (a). Cyclic voltammetry on C/PDMS electrodes of (b) 5 mmol.L-1 Ru(NH3)63+ and (c) 1mmol.L-1 FcMeOH. Electrolyte : 50mmol/L-1
phosphate buffer (pH 6.7). WE = C/PDMS 8/8 circular (diameter 6 mm delimited by a PDMS stamp), pseudo-RE = Ag-AgCl wire, CE = Pt wire. Scan rate 25 mV.s-1.
Cyclic voltammograms of the electrodes were performed for each ratio to evaluate its influence on the 204
electrochemical behavior of the composite material. For C/PDMS ratios of 4/8 and 5/8, the cyclic voltammogramms 205
show a reduction wave-shaped signal related to the reduction of Ru(+III) to Ru(+II) (Figure 5-a) and the oxidation of 206
Fe(+II) to Fe(+III) (Figure 5-b). For larger C/PDMS ratios, the cyclic voltammograms exhibit the classical peak-207
shaped signals obtained at millimetric electrodes. The difference in shape of the voltammograms for both probes 208
(wave versus peak) may be attributed to the fact that, for lower graphite content in the composite, the surface forms a 209
network of micrometric conductive parts, which can be assimilated to a network of separated microelectrodes with a 210
radial diffusion and no overlapping of the diffusion layer. In this case, a wave signal is obtained, as for an ensemble 211
of simultaneously addressed ultramicroelectrodes (UMEs). As the C/PDMS ratio increases, the shape of the cyclic 212
voltammogramms gradually moves from a wave-shaped signal to a peak-shaped one. For C/PDMS ratios of 8/8, the 213
voltammogramms exhibit anodic and cathodic peaks for both redox probes, with a quasi-reversible behavior, 214
characterized by peak-to-peak separation of 229±26 mV for Ru(NH3)6 3+
and 168±21mV for FcMeOH. The highest 215
peak intensities are obtained for the larger ration C/PDMS 8/8, with -163±12 µA and 35±4 µA for Ru(NH3)63+ and
216
FcMeOH, respectively. The difference in peak current intensity between both probes is essentially due to their 217
difference in concentrations (Ru(NH3)63+ being studied at 5 mmol L-1 and FcMeOH at 1 mmol L-1, both probes
218
having close diffusion coefficient values (5.5 10-5 cm2/s and 7.8 10-5 cm2/s, respectively) [23–25]. These results are 219
in good agreement with the fact that the graphite powder acts as the unique conductive part of the composite. The 220
real electrode surface was estimated to 79 to 85 % of the theoretical geometric area, by conducting 221
chronoamperometric measurements in Ru(NH3)63+ and FcMeOH solutions and then exploiting them using the
222
Cottrell equation at short time scale in solutions (see Supporting information). 223
C/PDMS ratio 8/8 was chosen for the miniaturization of the electrode in a microband electrode format since 224
mechanical properties of the paste before reticulation constrain the fabrication methodology (too much graphite leads 225
to crumbly paste, unuable). 226
3.2.Microelectrode format and characterization
227
A microband electrode was fabricated with two width values of 50 µm or 30 µm. They were characterized by SEM 228
and electrochemistry (CV experiment) using a 3-electrodes setup integrated in a microsystem (see below). 229
3.2.1. SEM characterization
230
The microband electrodes (50 and 30 µm width) were first characterized by SEM, as shown on Figure 6. A band of 231
C/PDMS 8/8 of regular width of around 50 µm and 35 µm are observed respectively, in good agreement with the 232
expected size and shape from the prepared molds. For both microband electrode widths, the edges are straight and 233
the surface of the electrode is quite uniform with almost no imperfections. The absence of graphite outside of the 234
channel indicates that the polishing step, aiming at removing the excess of composite, is appropriate for the 235
microfabrication and does not affect the bonding between PDMS matrix and the NOA® channels. The homogeneity 236
of the surface is also an indicator of the proper mixing of the paste and of the efficiency of the polishing. Moreover, 237
it can be seen on the SEM pictures that the microparticles of graphite look like a superposition of leaflets. The EDS 238
analysis of both C/PDMS composite and PDMS substrate (data not shown) shows a larger concentration of C atom 239
in the microelectrode area compared to the polymer alone, which is in good agreement with its formulation, mainly 240
composed of graphite powder. 241
242
Figure 6 –SEM images of C/PDMS electrode (50 µm (top) and 30 µm (bottom) width band)
243
3.2.2. Electrochemical characterization
244
The electrochemical characterization of the microband electrode has been performed using Ru(NH3)63+ and FcMeOH
245
as redox probes. A 3-electrodes setup has been integrated into microfluidic device, by positioning the microband 246
electrodes perpendicularly to a glass-NOA® microchannel of 150 µm width and 40 µm height. The dimensions of 247
this setup were inspired by the commercially available Micrux® microchip. The 50 µm width microband was used as 248
the working electrode. The second band (250 µm width) was used as a CE and the last one (250 µm width) was used 249
as a pseudo-RE. All the electrodes were positioned inside the microchannel to clearly define the electroactive 250
surface. The channel was filled with the redox probe solution and the CV acquired, as illustrated on Figure 7. 251
Between each acquisition, the channel was rinsed with the buffer and the solution renewed to insure the repeatability 252
of the measurements. Moreover, the chip was opened and the electrodes repositioned three times in order to place the 253
microchannel opposite to a new spot of the strip electrode, to avoid any pollution that could remain after analysis and 254
to prove the relevance and robustness of such a dismountable microchip. 255
256
Figure 7 – Design of the 3-electrodes C/PDMS set up(left). Linear voltammetry of 5 mmol.L-1 Ru(NH3)63+ on 257
this design integrated in a glass-NOA® microchannel (right). Electrolyte : 50 mmol.L-1 phosphate buffer 258
(pH 6.7). WE : C/PDMS 50x150 µm, pseudo-RE : C/PDMS 250x150 µm, CE: C/PDMS 250x150 µm. Scan rate
259
25 mV.s-1. Three measurements were performed on each working electrodes. 260
The CV of Ru(NH3)63+ shows a signal characteristic of that of an UME, with an halfwave reduction potential of
-261
404 ± 25 mV and wave intensity of -15,0 ± 2.4 µA/mm2 . That FcMeOH shows similar features with an half-wave 262
oxidation potential of +322 ± 40 mV and wave +1,5 ± 0.3 µA/mm2 (data not shown)1. 263
The experimental current density is higher on the microelectrode format than on the millimetric one in both cases (-264
15 vs -5.9 and 1.5 vs 1.3 µA/mm2 for Ru(NH3)63+ and FcMeOH respectively), as expected and in favor to the
265
miniaturization of the composite electrode. The use of the
266
3-electrodes setup can be considered for electrochemical detection in microsystem since the variability of the 267
different tested electrodes was low (< 20%, N = 9), for chronoamperometry measurement for example. 268
The influence of the pseudo-RE nature (C/PDMS versus siver/silver chloride) on the electrochemical behavior was 269
evaluated. The current density generated using a Ag/AgCl wire as pseudo-RE and positioned inside the well of the 270
1
The estimation of the theoretical current generated on a microelectrode band during CV experiment can be calculated using eq.1 [26,27]:
eq. 1 With , w width of the electrode (50 µm) and L length of the electrode (150 µm).
For this configuration, theoretical current density values of -9.1 µA/mm2 and 2.4 µA/mm2 were calculated for Ru(NH3)6 3+
and FcMeOH respectively. These values correspond, according to the experiment, to an active surface of 164% and 65%, which is clearly variable compare to what is expected theoretically (and compare to what was obtained on substrate format). This can be attributed either to different migration mechanism due to shape and roughness of the electrode, but also to the fact that the
microchip was proved to lead to the same value for Ru(NH3)63+/2+, but with a half-wave of -347±15 mV, slightly
271
different from the one on the integrated C/PDMS pseudo-RE. The standard potential value for Ru(NH3)63+/2+ is +0.10
272
V/NHE, so that the potential of the pseudo-RE C/PDMS can be estimated to +0.50 V/NHE in the phosphate buffer. 273
The successful fabrication of miniaturized band electrodes was performed with widths as low as 30 µm, which is 274
smaller than what was previously described in the literature (250 µm [19] and 100 µm width [11]). Moreover, the 275
cost for the fabrication of ten microelectrodes on PDMS substrate can be estimated to 1.04 € (2 g PDMS + 100 mg 276
graphite powder), which is quite low compared to other systems [11]. 277
3.3. Coupling of the amperometric detector with electrophoresis in a microdevice: Application to
278
the quantitation of Ru(NH
3)
63+279
The coupling of electrochemical detection with microchip electrophoresis requires some precautions, due to 280
interferences that can occur between the electric fields generated for both methods. Indeed, the electrophoretic 281
migration of ions under an electric field requires the application of a difference of potential in the microchannel of 282
the microfluidic system. This electric field (typically of more than 100 V.cm-1) can have a strong impact on any 283
electrochemical detector placed inside the separation channel, since it brings some noise and interference with the 284
electric field used for the electrochemical detection [4]. This effect was evaluated by conducting cyclic voltammetry 285
of Ru(NH3)63+ placed in a microchannel, with or without the application of a separation voltage for electrophoresis
286
and using a 50 µm C/PDMS WE. Two configurations were tested, with the electrode system at the end of the channel 287
(i.e.in the outlet reservoir, “end-channel” configuration) or withing the separation channel (“in-channel” 288
configuration). 289
3.3.1. End-channel detection mode
290
The 3-electrodes setup was placed into a single microchannel, in the end-channel configuration as illustrated on 291
Figure 8, and CV were performed under a separation voltage within the microchannel of different values. The 292
influence of the nature of the pseudo-RE (either C/PDMS or Ag/AgCl) was also studied . 293
294
Figure 8 – Influence of RE and CE natures on the cyclic voltammograms of 5mM Ru(NH3)63+ in the end-295
channel configuration. Separation microchannel filled with Ru(NH3)63+ . Electrophoretic separation 296
voltage : 0 to +400 V. Scan rate : 25 mV/s.
297
For all RE and CE natures,, the potential for the reduction of the probe is shifted to more positive values and the 298
noise increases when separation voltage increases, , as reported in the literature [5]. The shift in potential can be 299
explained by the interaction between the electric field for the separation and the one for the detection, while the noise 300
increase can be attributed to higher Joule effect under higher electric field value (100 V.cm-1). Secondly, the use of a 301
pseudo-RE made of an Ag/AgCl wire leads to lower shift of the reduction potential (from -0.37 V with no separation 302
voltage to -0.29 V at +200 V) in comparison to the use of C/PDMS pseudo-RE band (from -0.23 V with no 303
separation voltage to -0.04 V at +200 V). Thirdly, the use of an external Ag/AgCl wire concomitantly as pseudo-RE 304
and CE leads to a better stability of the signals and a lower noise, even for the highest electric field (+400 V) 305
C/PDMS microband is therefore not recommended when integrated as a pseudo-RE in an electrophoretic 306
microdevice with electrochemical detection. On the contrary, Ag/AgCl wire provides a higher stability of the 307
reduction potential value when applying an electric field for electrophoretic separation. Moreover, the use of short-308
circuited Ag/AgCl pseudo-RE/CE (in a 2-electrodes configuration) seems to give an even better signal than with a 3-309
electrodes setup. Finally, the CV do not show the behavior of a microelectrode, which can be explained by the fact 310
that the microband electrode (WE) is placed in end-channel configuration, thus leading to a larger electrode surface. 311
3.3.2. In-channel detection mode
312
The end-channel configuration used previously suffers from another drawback: since the WE is placed outside the 313
microchannel (i.e. in the outlet reservoir), the sample undergoes a dilution in this reservoir which leads to a loss in 314
analytical performances [5]. To overcome this drawback, the in-channel configuration was tested, where the WE is 315
positioned within the separation microchannel to avoid the sample dilution. For this configuration, the use of a 316
classical potentiostat is to be avoided since the separation voltage for the electrophoretic separation can damage the 317
device if not grounded, so that a wireless potentiostat has to be used for the chronoamperometric detection. This is 318
only compatible with a 2-electrodes setup where the pseudo-RE and the CE are short-circuited [28]. 319
Chronoamperometric measurements were performed (Figure 9) to evidence any influence of the electric field on a 2-320
electrodes setup in an in-channel configuration (cross-shape system). The set up consisted in a C/PDMS microband 321
electrode of 30 µm width placed just before the end of the separation channel and a pseudo-RE/CE made of an 322
Ag/AgCl wire immersed in the nearest well. The microband width was selected at 30 µm since it gave less noise than 323
larger electrodes, thus leading to lower LOD. 324
325
Figure 9 – Influence of a separation electric field on the chronoamperometric current of 250 µmol.L-1 326
Ru(NH3)63+ in a in-channel configuration . Backgroundelectrolyte: 1 mmol.L-1 HCl and 50 mmol.L-1 NaCl. 327
Separation voltage : S = Ground, SW = -300 V, B = Ground, BW = -500 . Current measured 30s after
328
application of the corresponding potential. WE : 30 µm width C/PDMS,, CE/RE = AgAgCl wire immersed
329
in well BW. This representation corresponds to the substraction of blank (BGE alone)
In the absence of the separation voltage, Ru(NH3)63+ could not be reduced for potential values superior to
-331
0.1V/AgAgCl. When applying the separation voltage, a reduction signal of Ru(NH3)63+ could be obtained for a
332
potential up to +0.3 V/AgAgCl. Therefore, the 2-electrodes set-up in a in-channel configuration is efficient for the 333
detection of the redox probe at a detection potential inferior to +0.1V/AgAgCl . 334
3.3.3. Analytical performances for the electrophoretic separation and detection of Ru(NH3)63+ 335
Finally, the 2-electrodes setup was employed for the separation and in-channel chronoamperometric detection of 336
Ru(NH3)63+ in the microfluidic device. The BGE was composed of 1 mmol.L-1 HCl and 50 mmol.L-1 NaCl since this
337
media will be used for further applications in the same device. For this purpose a “gated” injection mode (Figure 10 338
c) was developed, followed by an electrophoretic separation (with a gated injection mode) and a 339
chronoamperometric detection at +0.1 V/Ag/AgCl. The electrophoregram (a) and the calibration curve for the 340
quantitation (b) from 10 to 250 µmol.L-1 are presented in Figure 10, 341
Figure 10 – (a) Electropherogram of 100 µmol.L-1 Ru(NH3)63+ with in-channel chronoamperometric
detection. Conditions for separation described in materials and methods section. (b) Calibration curve for Ru(NH3)63+ (Charge = f([Ru(NH3)63+], from 250 to 10 µmol.L-1). (c) Scheme of the electrokinetic
sequence and conditions for sample loading, injection and separation.
Since the electroosmotic flow is negligible (data not shown), the electrophoretic mobility of Ru(NH3)63+ was directly
342
estimated from its migration time, equal to 35.7 ± 0.7 10-5 cm2.V-1.s-1 (average value of 15 acquisitions). 343
Reproducibility was assessed by employing two other zones of the same electrode after opening the chip and shifting 344
the channel position, and led to comparable signal intensity under the same conditions (variability < 5%). The use of 345
the dismountable system is proved to be effective, permitting to use the same microelectrode several times on 346
different spots of the band, which increases the lifetime of the detection part. 347
A linear regression was obtained between the signal area and the analyte concentration ranging from 10 to 250 348
µmol.L-1. The limit of detection (S/N = 3) and the limit of quantitation (S/N =10) were 3.4 and11.3 µmol.L-1, 349
respectively. Therefore,C/PDMS based microelectrodes were proved suitable for electrophoretic separation coupled 350
to chronoamperometric detection. 351
4. Conclusion
352A new microfluidic device has been developed, consisting in an openable sandwich microdevice system made of two 353
parts (1) a microchannel micromolded in NOA® on a glass slide, and (2) a PDMS matrix on which is integrated a 354
screen-printed C/PDMS band microelectrode of 30 µm width. This electrode has been characterized by 355
electrochemistry, providing good reproducibility. The SEM images indicate a homogeneous electrode surface and 356
well defined electrode bands. Its use for chronoamperometry coupled with electrophoretic separation has been 357
demonstrated with the quantitation of Ru(NH3)63+ in acidic media, by coupling a high separation voltage with a
358
wireless potentiostat for amperometric detection. This analytical method led to a limit of detection of 3.4 µmol.L-1 359
for Ru(NH3)63+ , with an analysis time inferior to 2 minutes. This openable system allows to easily wash the
360
microchannel, but also renew the electrode surface by simply repositionning the microband, showing a variability of 361
less than 5%, and increasing its lifetime. 362
5. Acknowledgements
363This work was supported by the French Environment and Energy Management Agency (ADEME) and the Chaire 364
“Mines Urbaines” from ParisTech foundation, supported by Eco-systèmes. This work has received support of 365
“Institut Pierre-Gilles de Gennes” (Laboratoire d’excellence: 10-LABX-31, “Investissements d’avenir”: ANR-366
10-IDEX-0001-02 PSL and Equipement d’excellence: ANR-10-EQPX-34). P. Vermaut from Institut de Recherche 367
de Chimie Paris, CNRS 8247, Team Métallurgie structurale, Chimie ParisTech, is gratefully acknowledged for SEM 368
imagery. 369
6. References
370[1] H. Gai, Y. Li, E.S. Yeung, Optical Detection Systems on Microfluidic Chips, in: Microfluidics, Springer, 371
Berlin, Heidelberg, 2011: pp. 171–201. doi:10.1007/128_2011_144. 372
[2] X. Feng, B.-F. Liu, J. Li, X. Liu, Advances in coupling microfluidic chips to mass spectrometry, Mass 373
Spectrom. Rev. 34 (2015) 535–557. doi:10.1002/mas.21417. 374
[3] L. Nyholm, Electrochemical techniques for lab-on-a-chip applications, Analyst. 130 (2005) 599–605. 375
doi:10.1039/B415004J. 376
[4] F.-M. Matysik, Advances in amperometric and conductometric detection in capillary and chip-based 377
electrophoresis, Microchim. Acta. 160 (2008) 1–14. doi:10.1007/s00604-007-0802-3. 378
[5] W.R. Vandaveer, S.A. Pasas-Farmer, D.J. Fischer, C.N. Frankenfeld, S.M. Lunte, Recent developments in 379
electrochemical detection for microchip capillary electrophoresis, ELECTROPHORESIS. 25 (2004) 3528– 380
3549. doi:10.1002/elps.200406115. 381
[6] Microfluidic Chip Holder | MicruX, (n.d.). https://www.micruxfluidic.com/en/microfluidic-382
solutions/microfluidic-platforms-/microfluidic-chip-holder/ (accessed April 16, 2019). 383
[7] A.J. Gawron, R.S. Martin, S.M. Lunte, Fabrication and evaluation of a carbon-based dual-electrode detector 384
for poly(dimethylsiloxane) electrophoresis chips, Electrophoresis. 22 (2001) 242–248. doi:10.1002/1522-385
2683(200101)22:2<242::AID-ELPS242>3.0.CO;2-W. 386
[8] M.L. Kovarik, M.W. Li, R.S. Martin, Integration of a carbon microelectrode with a microfabricated palladium 387
decoupler for use in microchip capillary electrophoresis/electrochemistry, Electrophoresis. 26 (2005) 202–210. 388
doi:10.1002/elps.200406188. 389
[9] R. Scott Martin, A. J. Gawron, B. A. Fogarty, F. B. Regan, E. Dempsey, S. M. Lunte, Carbon paste-based 390
electrochemical detectors for microchip capillary electrophoresis/electrochemistry, Analyst. 126 (2001) 277– 391
280. doi:10.1039/B009827M. 392
[10] M. Pumera, A. Merkoçi, S. Alegret, Microchip Capillary Electrophoresis-Electrochemistry with Rigid 393
Graphite-Epoxy Composite Detector, Electroanalysis. 18 (2006) 207–210. doi:10.1002/elan.200503382. 394
[11] A. Regel, S. Lunte, Integration of a graphite/poly(methyl-methacrylate) composite electrode into a 395
poly(methylmethacrylate) substrate for electrochemical detection in microchips, Electrophoresis. 34 (2013) 396
2101–2106. doi:10.1002/elps.201300055. 397
[12] A. Nag, N. Afasrimanesh, S. Feng, S.C. Mukhopadhyay, Strain induced graphite/PDMS sensors for 398
biomedical applications, Sens. Actuators Phys. 271 (2018) 257–269. doi:10.1016/j.sna.2018.01.044. 399
[13] A. Nag, M.E.E. Alahi, S. Feng, S.C. Mukhopadhyay, IoT-based sensing system for phosphate detection using 400
Graphite/PDMS sensors, Sens. Actuators Phys. 286 (2019) 43–50. doi:10.1016/j.sna.2018.12.020. 401
[14] L.O. Prasad, S.S. Pillai, S. Sambandan, Micro-Strain and Temperature Sensors for Space Applications with 402
Graphite-PDMS Composite, in: 2019 IEEE Int. Conf. Flex. Printable Sens. Syst. FLEPS, 2019: pp. 1–3. 403
doi:10.1109/FLEPS.2019.8792312. 404
[15] W.-P. Shih, L.-C. Tsao, C.-W. Lee, M.-Y. Cheng, C. Chang, Y.-J. Yang, K.-C. Fan, Flexible Temperature 405
Sensor Array Based on a Graphite-Polydimethylsiloxane Composite, Sensors. 10 (2010) 3597–3610. 406
doi:10.3390/s100403597. 407
[16] J.E.Q. Quinsaat, I. Burda, R. Krämer, D. Häfliger, F.A. Nüesch, M. Dascalu, D.M. Opris, Conductive silicone 408
elastomers electrodes processable by screen printing, Sci. Rep. 9 (2019) 1–11. doi:10.1038/s41598-019-49939-409
8. 410
[17] M.A. Unger, H.P. Chou, T. Thorsen, A. Scherer, S.R. Quake, Monolithic microfabricated valves and pumps by 411
multilayer soft lithography, Science. 288 (2000) 113–116. 412
[18] X.Z. Niu, S.L. Peng, L.Y. Liu, W.J. Wen, P. Sheng, Characterizing and Patterning of PDMS-Based 413
Conducting Composites, Adv. Mater. 19 (2007) 2682–2686. doi:10.1002/adma.200602515. 414
[19] Y. Sameenoi, M.M. Mensack, K. Boonsong, R. Ewing, W. Dungchai, O. Chailapakul, D.M. Cropek, C.S. 415
Henry, Poly(dimethylsiloxane) cross-linked carbon paste electrodes for microfluidic electrochemical sensing, 416
Analyst. 136 (2011) 3177–3184. doi:10.1039/C1AN15335H. 417
[20] A.-L. Deman, M. Brun, M. Quatresous, J.-F. Chateaux, M. Frenea-Robin, N. Haddour, V. Semet, R. Ferrigno, 418
Characterization of C-PDMS electrodes for electrokinetic applications in microfluidic systems, J. 419
Micromechanics Microengineering. 21 (2011) 095013. doi:10.1088/0960-1317/21/9/095013. 420
[21] M. Brun, J.-F. Chateaux, A.-L. Deman, P. Pittet, R. Ferrigno, Nanocomposite Carbon-PDMS Material for 421
Chip-Based Electrochemical Detection, Electroanalysis. 23 (2011) 321–324. doi:10.1002/elan.201000321. 422
[22] SU-8 2000 - MicroChem, (n.d.). http://microchem.com/Prod-SU82000.htm (accessed May 9, 2019). 423
[23] W. Miao, Z. Ding, A. Bard, Solution Viscosity Effects on the Heterogeneous Electron Transfer Kinetics of 424
Ferrocenemethanol in Dimethyl Sulfoxide−Water Mixtures, J. Phys. Chem. B - J PHYS CHEM B. 106 (2002). 425
doi:10.1021/jp013451u. 426
[24] J.E. Baur, R.M. Wightman, Diffusion coefficients determined with microelectrodes, J. Electroanal. Chem. 427
Interfacial Electrochem. 305 (1991) 73–81. doi:10.1016/0022-0728(91)85203-2. 428
[25] A.J. Bard, L.R. Faulkner, Electrochemical Methods: Fundamentals and Applications, Wiley, 2000. 429
[26] K. Aoki, K. Tokuda, Linear sweep voltammetry at microband electrodes, J. Electroanal. Chem. Interfacial 430
Electrochem. 237 (1987) 163–170. doi:10.1016/0022-0728(87)85229-4. 431
[27] S. Daniele, C. Bragato, From Macroelectrodes to Microelectrodes: Theory and Electrode Properties, in: L.M. 432
Moretto, K. Kalcher (Eds.), Environ. Anal. Electrochem. Sens. Biosens. Fundam., Springer New York, New 433
York, NY, 2014: pp. 373–401. doi:10.1007/978-1-4939-0676-5_15. 434
[28] Isolated wireless potentiostat, (n.d.). https://www.pinnaclet.com/pinnacle-handheld-isolated-potentiostat.html 435
(accessed April 16, 2019). 436