HAL Id: hal-01008690
https://hal.archives-ouvertes.fr/hal-01008690
Submitted on 5 May 2018
HAL is a multi-disciplinary open access
archive for the deposit and dissemination of
sci-entific research documents, whether they are
pub-lished or not. The documents may come from
teaching and research institutions in France or
abroad, or from public or private research centers.
L’archive ouverte pluridisciplinaire HAL, est
destinée au dépôt et à la diffusion de documents
scientifiques de niveau recherche, publiés ou non,
émanant des établissements d’enseignement et de
recherche français ou étrangers, des laboratoires
publics ou privés.
Probabilistic updating of corroded reinforced concrete
pipes for maintenance planning optimisation
Franck Schoefs, Olivier Bernard
To cite this version:
Franck Schoefs, Olivier Bernard. Probabilistic updating of corroded reinforced concrete pipes for
maintenance planning optimisation. 3rd International Workshop on Life-Cycle Cost Analysis and
De-sign of Civil Infrastructure Systems (LCC’03), 2003, Lausanne, Switzerland. �10.1061/40707(240)29�.
�hal-01008690�
Probabilistic Updating of Corroded Reinforced Concrete Pipes for Maintenance Planning Optimisation
Franck Schoefs 1 and Olivier Bernard2
Abstract
Reinforced concrete pipes (RCP) are sometimes used to distribute aggressive water in industrial systems. Such networks of RCP deteriorate with time due to internal corrosion (Peter-Lazar 2000). Due to the low 02 - content of aggressive water, a
slow corrosion speed is expected for such applications. If the RCP in these networks
are not periodically replaced, they will eventually fail. Strategies for replacement for these pipes depend on (1) the risks associated with failure of a water distribution network, and (2) the costs associated with replacing the pipes, including the cost of removing existing pipes, the cost of the new pipes and the cost of service interruption of there is any temporary closure (Luong 2002). Due to the lack of statistical data in regards with RCP failure, the development of a risk-based replacement strategy is not an easy task. This paper gives an example of how predictive models of the deterioration of RCP and the consequences of failure can be used to develop risk-based replacement strategies for RCP networks. Replacement strategies are determined for a series network consisting of 251 RCP. The main contribution of this paper is to provide a theoretical approach based on (1) the results of a reliability study, the use of (2) random drawing (binomial law) and (3) the decision tree method to determine optimal replacement strategy.
Keywords: corrosion of concrete, reinforced concrete pipe, probabilistic updating, maintenance.
Introduction
Reinforced concrete pipes (RCP) are sometimes used to distribute aggressive water in industrial systems. Such networks of RCP deteriorate with time due to internal corrosion (Peter-Lazar 2000). Due to the low 02 - content of aggressive water, a
slow corrosion speed is expected for such applications. If the RCP in these networks
are not periodically replaced, they will eventually fail. Strategies for replacement for these pipes depend on (1) the risks associated with failure of a water distribution network, and (2) the costs associated with replacing the pipes, including the cost of removing existing pipes, the cost of the new pipes and the cost of service interruption of there is any temporary closure (Luong 2002, Adey 2003).
1
Ph.D., Assistant professor Laboratory of Civil Engineering University of Nantes BP 92208 -44072 NANTES- France
The goal of an optimal maintenance strategy (OMS) is to plan interventions in order to find when, where and how to inspect a structure, when, where and how to intervene and the optimal balance between them throughout the service life of the structure. The OMS should results in the lowest reduction of risks and costs for owners of structures. Due to the lack of statistical data in regards with RCP failure, the development of a risk-based replacement strategy is not an easy task. Some authors have addressed this task in other industrial fields.
Estes
and Frangopol (Estes2001) have used event tree method to determine optimal management strategy of
corroded reinforced bridges. The proposed approach can also be used to update the management strategy after inspection. An optimization technique based on genetic algorithms is proposed by Miyamoto et al. (Miyarnoto 2001). This method is not specifically developed to take into account the effect of corrosion on maintenance planning, but used inspection data to update the management strategy. Markov models are a commonly used, in management systems, to model the deterioration of infrastructure assets, such as pipes (Micevski 2002) and road bridges (Cambridge
Systematics 1997, Roelfstra 2001). Semi-Markov models, however, have been used
to incorporate changes in failure mode that may occur as a function of both time and the number of previous breaks (Li 1992). This paper provide a theoretical approach based on (l) the results of a reliability study, the use of (2) random drawing
(binomial law) and (3) the decision tree method to determine optimal management
strategy (OMS).
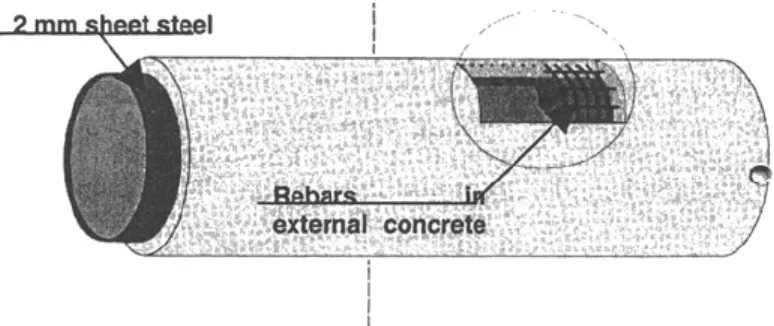
Predictive modellng and rellabiUty analysis of chloride-induced corrosion RCP Reinforced Concrete Pipe (RCP). The Figure 1 shows schematically a Reinforced Concrete Pipe (RCP) widely used for industrial applications. Most of these RCP have a reinforced external concrete layer in European countries.
Figure 1. Reinforced Concrete Pipes (RCP).
In Asian and in United States, it is more common to find a pre-stressed external concrete layer. The sheet steel placed in between the two concrete layers plays a role to avoid the leakage of the RCP and to bear the internal fluid pressure.
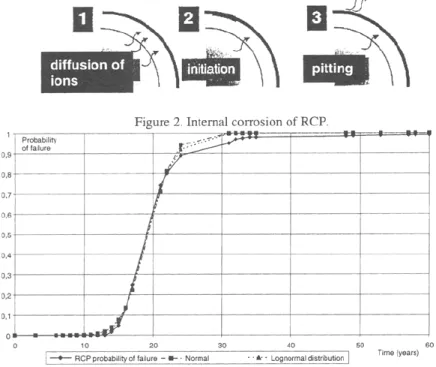
Local corrosion criterion and reliability analysis. Then aggressive water is transported, RCP deteriorate with time due to internal corrosion (Peter-Lazar 2000).
OXAND S.A. has conducted a reliability study to determine the evolution of the
probability of having a small pit in the sheet steel due to internal corrosion (Figure
2). Predictive modeling of diffusion of aggressive ions in the internal layer was used
to determine the duration of the initiation period. Then, specific corrosion models were used to determine the time-evolution of the residual thickness of the sheet steel. The thickness of the internal layer and the sheet steel were chosen as random variables. Finally, the crude Monte Carlo Method was used to calculate the time-dependent probability of having a residual thickness of the sheet steel of zero. The obtained evolution of the probability of ''failure" is presented in Figure 3. This
probability is then fitted with a normal and a lognormal law in order to be used as
input parameter for what follows.
Figure 2. Internal corrosion of RCP. 0.9 Probability F ·.<:::::. .-"' ~ falore
)'
I
0.8 0.7 0.6 II
I
'
j
I.~wl
0.6 0,4 0.3 0.2 0,1 0 0 10 20 30 40 50 60I
--+-RCP probab.lity of taiure - • Normal • · • · · Log normal distributionI
Tlme ryear5)Figure 3. Initial distribution of Reinforced concrete pipes (RCP).
Basic assumptions. All the RCP of the series network are supposed to be in a similar
condition state at time
to
=
0. They are all identical and without any defects. Inaddition, they are assumed to be physically and statistically independent (Bemoulli
assumptions). It leads in particular to address that there is no spatial correlation and that the corrosion process is considered itself as a random process.
Then, the number of corroded RCP X(t) at time t can be deterministically assessed trough the relationship (1):
X(t)=nxq>(t) (1)
where n is the total number of RCP. If the second assumption (statistically
independency) can be considered as realistic, the first one (physically independency) is more questionable.
As the local corrosion can affect the stiffness of the RCP, a non-negligible part of the loading can be transferred to the connected RCP. As the corrosion process depends on the stress level, the total physical independency of RCP is not guarantied. For what follows, such considerations are not taken into account.
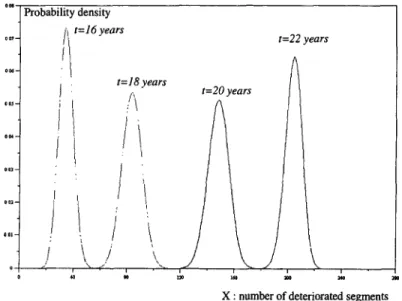
Approximation of the distribution of corroded RCP with a binomial pdf. A probability density function (pdf) of corroded RCP is proposed at each time t to determine the number of corroded RCP with a confidence level. This can be achieved under the statistical assumption. In fact, it allows us to select the binomial probabilistic density function with parameter n (total number of RCP) and probability p( t)
=
q;( t).Figure 4 presents four probability densities obtained fort= 16, 18, 20 and 22 years. Figure 5 also shows that the standard deviation reaches a maximum value at 20 years. This corresponds to a probability of failure of the RCP of 0,5.
...
Probability density(i
1= 16 years11
\J
\
I
j
1=18 years /• ;\
I \
I \
\
1=22 years 1=20 years...
"'
X : number of deteriorated segments
Figure 4. Probability density function of deteriorated segments at t=16, 18, 20 and 22 years (n = 251).
For initial and final corrosion states, the number of corroded RCP is quite deterministic. It is due to the fact that the probability of failure describes a failure criterion with a binary response. Thus, the standard deviation is not increasing with time. The stochastic process related to the corroded area should lead to trajectory variations, which increased with time.
It is now easy to assess the number of corroded RCP with a confidence level of 5 % or 95 % from these probability density functions.
Probabilistic updating after repair
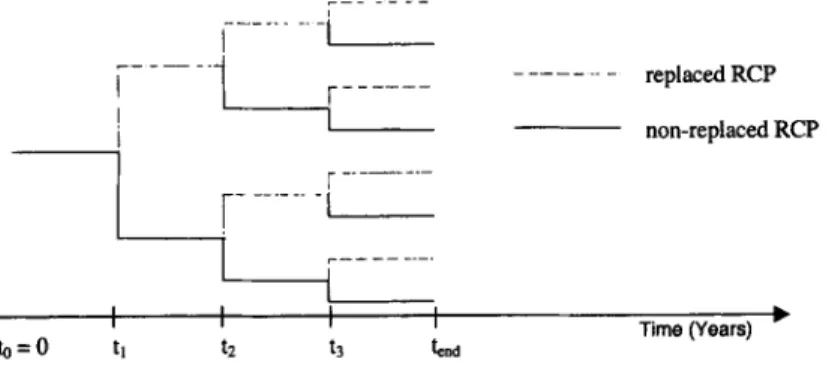
Formal representation of maintenance strategies based on fault tree. Under the previous assumptions, the fault tree method is used to build maintenance strategies. This formal graphical scheme allows us to build several path of maintenance strategy, which are called scenarii and represented by a branch that links the bound of decision "replaced or non-replaced". It has been used as aid-tool in offshore
industry or bridge maintenance planning (Faber 2002). Here, the policy of reparation
is the replacement of non-replaced RCP. These segments follow the time-dependent probability of failure given in figure 3. A typical fault tree is presented in figure 5. This example considers an action (replacement or non-replacement) at each time ti. Here, this tree is called "decision tree" as it symbolizes actions. It allows to build several branches from the original branch of non-replaced RCP until the reference period tend is reached.
to=O . - - - ----'
I
,---~
,---1'---il
l
i
rL_-__ - -__ -_
~--- '-L---:_1 _
_____,~--
---lend replaced RCP non-replaced RCP Time (Years)Figure 5. Typical decision tree as graphical support to represent maintenance strategy.
Maintenance strategy: choice of the number of replaced RCP at time t.
During the last years, quite a lot of papers have treated this point including the role of inspection (Bj0moy 2001, Onofriou 2002, Ritchie 1998). In this paper, only the date of replacement is considered as a maintenance parameter. The number of potential replaced RCP at time t is always determined with the maximum likelihood of
corroded components at time t.
Distribution of corroded RCP after one action (t2 > t > t1). Once the number m1 of replaced RCP is selected, the accurate size of populations for replaced and
replaced RCP is a binomial law with the following parameters : m1 and the probability p( t) = rp t- t 1 ) • The probability density of the remaining corroded RCP is determined by the same way with a binomial low with parameters: (n-m1) and
p( ) rpt )-rpt1 ) F . I . I . . . h h
t = . or numenca stmu atwns, 1t IS Important to mentton t at w en
1-rptl)
t reaches the lifetime of RCP, the expression of p(t) becomes numerically undefined. Then, the result rp 1 )-rp 11)
~1
is introduced (cp(t)=l when t tends to infinity).1-rptl)
-The probability of corroded RCP at each time t ~ t 1 and before the next action is obtained trough a convolution product (2),
P(X =x)=
~>~(X
=i)®Po(X =x-i) (2)i=O
where Po(X=x) is the probability to have x non-replaced RCP at time t1 which fail at
timet, and P1(X=x) is the probability to have x replaced RCP at time t1 which fail at
timet.
Distribution of corroded RCP after i actions, (t > ti). There are
i
populations that aredescribed at time t by only (i + 1) distributions because some of them are
complementary. In the following, m(i,j) is the number of RCP of the branch j after i actions. These distributions are determined with the following step by step method :
first, the distribution of non-replaced RCP during the whole period t, is a
. rpt-t )-rpt -t )
binomial law with parameters : m(i,2') and p( t) = 0
' 0 •
1-rpt, -t0 )
second, the distribution of non-replaced RCP at time t; but replaced at time tk
l-1-1
(19<S-l) is a binomial law with parameters: m(i,k)= L:m(if 1+2j)2H) and
j=O
p(t)= f/X.t-tk }-f/X_t;-tk) 1-(!X.t.-tk)
finally, the distribution of replaced RCP at time t; is a binomial law with
i-1
parameters: m(ij+1)= "!m(i,2j-1) and p(t) = rpt-t; ).
j=l
Then, an expansion of equation (2) whatever i is proposed (3) :
X i h
P( X= x)= LP,( X =i)XLP,-l X= j )®···® L~( X= k )®Po( X =x-k)
1=0 j=O k=O
(3)
where Po(X=x) is the probability to have x non-replaced segments at time t; which fail at time t and Ph(X=x) is the probability to have x replaced segments at time t;.h which fail at time t.
An illustration of a decision tree is given figure 6 after 5 actions. This formalism is well adapted for a Linear Algebra Programming such in SCILAB. It is an interactive system whose elementary data element is a matrix that does not require any dimensioning. replaced
...
!
m(/,1)I
l l i'
i'
'
~ ·--~--,.~---1i
I non replaced m(l,2) replaced reP.Iaced ,. ... 771( 5, /) f """ ... ,..'"""!
non replaced r ... !~P.!~~.~.L ... ' m(4.1) 1 ;-'"(5,2) . 111{3,/) non laced , ... ~~~ .. '!~ ... .,.(5.3) • non replaced . r~P.I~ced. 111{4,2) (5,4) m(2,1) , .... I.~.P)!lS~ ... .,(5,5)·
J, ..
-fePJ.ac~. ····L!!on replaced[,~~r:?.~~~~ 111{4,3)
1 ed
m(5,6) 111{3,2) : non replaced ,. .... f!iP..!!E ... .,.(5,7)
.... -,;.{4-:4)"1.J!9!\.!l!P.lacedrn{5,81 reJ!laced ,. .... nmlftf.~IJ ... 771(5,9) ... , non replaced 15101 r ... x~ml~~.'lll... 111{4,5) I ed m., · m(3,3) non re laced ,. ... !~P..~~ ... 771(5,11)
I
non replaced non replaced m(4,6) 5,12) m(2,2) laced ,. .... F.~J?.l.~£~ .... 771(5,13)non replaced f
··~~:l)"""""lllM
renlaced m(5,14)IePI~ce9 .. m(2,3) non replaced m(2,4) non replaced r .... r.!':t?.\~~ .... 771( 5,15) m( 4,B) non replaced 5,161 , ... ~~~~ .... 771(5,17) • . r~pl~c"!l ... ,. , .... ~~P.!~£~ ... ..1 m( 4• 9) · non replaced m( 5.18) ! m(3,5) non replaced ,. .... J~P.!!~.~!! .... 771(5./9)
I
m(4,10)m non re laced 5,20) ! replaced replaced ,. ... 771(5,21) ! i m(4,Jl) 1 non replaced"'m{S,22J • .!'?.~"Eia~lld.l replaced 111{3,6) ! non r laced ,. ... 771(5,23) · ... · ~ ··• -·· \ non replaced 111{4,12) ... ----m(5,24) replaced ,. .•. .'!!?.!~~~ ... .,( 5,25)replaced , ..
;;.{4,}3)""1
non replaced 5,26)111{3,7) ... ~~P.!!\!'.~ ... 771(5 27)
: non replaced · '
m(4.J4) 5,28)
replaced ,. •• Xml!!£~ ••••• 771(5,29)
l
non replacedr·.
,;;;4:15)"""!
non replaced m(5,30)·--·--~ re laced
111{3,8) L~!!.!."E!..aced , ... P. ... m(5,31)
m(4,16)1..!!QPJ~I!.!~.rn{5,32)
Time (years)
Optimisation of maintenance planning
Input values and main assumptions. The series network consists of 251 RCP (n
=
251) and the RCP lifetime is 60 years. The maintenance consists in the replacement of corroded RCP. Two strategies are then tested:(1) the date and the number of actions are imposed;
(2) the total number of corroded RCP is limited to an upper bound value.
The following sections present the results obtained with these two strategies. Imposed dates of maintenance. Figure 7 illustrates this choice with three actions at time 17, 20 and 24 years.
X : Number of corroded RCP with 3 actions of replacement Time (years)
- Number of failed RCP 95 % without action - Number of failed RCP at 95 % with action • • • • • Number of failed RCP at 5 % without action - - • Number of failed RCP at 5 % with action
Figure 7. Evolution of the number of corroded RCP (curves 5% and 95 %level of confidence) after 3 actions at time 17, 20 and 24 years
The result shows that this type of strategy reduces drastically the slope of the curve. This influence is high around 30 years and the time to have a totally corroded network of RCP is increased from 25 years to 45 years. It is interesting to compare the curves obtained for 5 % and 95 % level of confidence along the y-axis. It appears that length g1 is greater than ~· As replacement actions modify the initial population by introducing new RCP, the standard deviation of the number of corroded RCP decreases after 3 actions compared to the one obtained without any action. It is particularly significant at 30 years.
Upper bound value for the number of corroded RCP. The target is now to keep the number of deteriorated components i.e. the number corresponding to the maximum likelihood under a limit value considered as an accepted number of
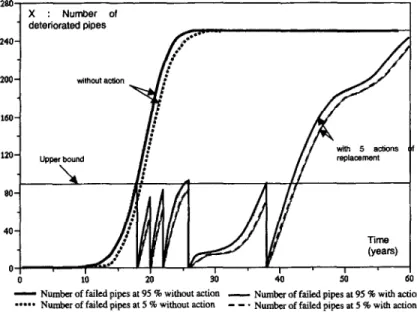
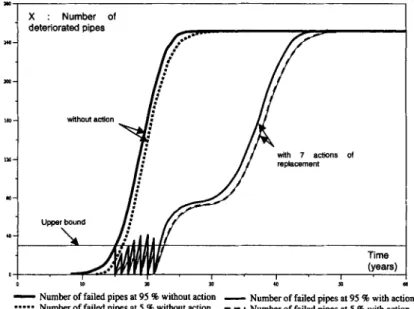
deteriorated pipes. This strategy is equivalent to consider a limit out-flow of liquid for example. For illustrations two values of the bound of this criteria are studied. In the first case presented on figure 8 this upper bound is equal to 90 and in the second one it is fixed to 30 (see figure 9). The number of actions is five in the first case and seven in the second case, every year from the first year it is needed.
2W,---,
X : Number of deteriorated pipes 240 200 160 120 80 40 0 Time (years) 0 10 20 30 40 so 60- Number of failed pipes at 95 % without action - Number of failed pipes at 95 % with action •••• • Number of failed pipes at 5% without action - - • Number of failed pipes at 5% with action
Figure 8. Evolution of the number of deteriorated segments (curves 5% and 95 % level of confidence) after 5 actions - criteria of limit number of deteriorated
segments (90)
In the case of an upper bound fixed at 90, it is interesting to underline that after four actions, a lot of segments have been replaced and the slope of the curve of deterioration is very fair around 30 years. The number of deteriorated pipes is then constant during 5 years from 27 to 32 years. The remark made upon on the gap between the confidence curves at 5 and 95 % is similar.
Let us consider now an upper bound at 30 deteriorated RCP. Before 30 years, seven actions have already been planed when they were four with the previous strategy. Around this date we can observe the same fair slope of the curves. Despite the number of actions is higher, they are to frequent and concerns a low number of RCP. Then the pipe is totally deteriorated at 45 years instead 60 years obtained in the previous strategy. In terms of number of replaced RCP now, the first strategy leads to about 400 replacements and the second one to 178 replacements. Due to the uncertainty on the number of deteriorated RCP, it is to notice that the curve "5% level of confidence" goes beyond the limit bound of 30. In terms of risk analysis it
can leads to significant over-cost (cost of failure and cost of exploitation stop) if the number of deteriorated RCP reaches 40 (see 20 years).
In terms of cost, the number of operations and the number of replacements should be introduced. In fact, the first one implies stop the industrial exploitation and the second one to remove the deteriorated RCP and buy ands install the new ones. Failure costs are not taken into account in this example but are included in the software S1MEOTM-MANAGER.
"'
"'..
X : Number of deteriorated pipes"
with 7 actiOns of replacement..
Time (years)- Number offailed pipes at 95 % without action - Number of failed pipes at 95 % with action ••••• Number of failed pipes at 5 % without action - - • Number of failed pipes at 5 % with action
Figure 9. Evolution of the number of deteriorated segments (curves 5% and 95 % level of confidence) after 5 actions -criteria of limit number of deteriorated
segments (30)
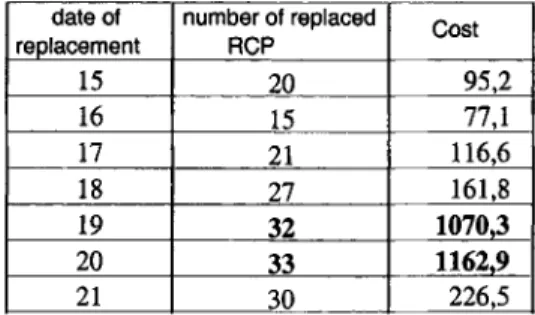
The table 1 proposes this economical study for the second strategy. The values are dimensionless. It is based on the following assumptions:
an annual maintenance of the exploitation during three weeks allows replacing a maximum of 30 RCP without cost overrun due to an arrest of exploitation.
a cost overrun is fixed at 200 000 per day knowing that a replacement of five RCP takes one day.
the cost of 6 RCP is 9.
Table 1. Cost of replacement (case of an upper bound of 30 accepted deteriorated RCP)
date of number of replaced Cost replacement RCP 15 20 95,2 16 15 77,1 17 21 116,6 18 27 161,8 19 32 10703 20 33 11629 21 30 226,5
It is interesting to see that the cost-overrun acts only at the dates 19 and 20 years but has a great weight on the global cost. These two years represent 77 % of the cost after 21 years.
Conclusion
This paper provides a theoretical approach in view to analyze alternative strategy for the maintenance of a reinforced concrete pipe networks (RCP). It is based on (1) the results of a reliability study, the use of (2) random drawing (binomial law) and (3) the decision tree method to determine optimal management strategy (OMS). This method allows to provide the evolution of the number of deteriorated RCP with a confidence level. Thus, the curves at 5% and 95% confidence level are computed and plotted. It is of importance especially for risk analysis. Two strategies are compared : (1) the date and the number of actions are imposed, (2) the total number of corroded RCP is limited to an upper bound value. Finally an economical study is proposed and shows how to introduce costs in such a maintenance strategy.
Acknowledgments
The authors give Antoine Rouhan and Yoann Lahorgue their sincere thanks for the contribution to this work.
References
Adey, B., Bernard, 0., and Gerard, B. (2003). "Risk-based replacement strategies for underground reinforced concrete pipe networks", 2nd International Rilem Workshop
on Life prediction and ageing management of concrete structures, Paris, France, May 5-6.
Bj0rn0y, O.H., Jahre-Nilsen, C., Eriksen, 0. and M0rk K. (2001). "RBI planning for pipelines, description of approach", proceedings of OMAE'OJ, 2dh International Conference on Offshore Mechanics and Arctic Engineering, June 3-8, Rio de Janeiro, Brazil, no OMAE2001/PIPE-4008.
Cambridge Systematics (1997), Pontis Release 3.2 - Users Manual, American Association of State Highway and Transportation Officials Inc., Washington D.C. Estes, A.C. and Frangopol, D.M. (2001) "Minimum expected cost-oriented optimal maintenance planning for deteriorating structures : application to concrete bridge decks". Reliability Engineering and System Safety, 73, 281-291.
Faber, M.H. and Sorensen, J.D. (2002). "Indicators for inspection and maintenance planning of concrete structures". Structural Safety, 24, 377-396.
Li, D., and Haimes, Y.Y. (1992), "Optimal Maintenance Related Decision Making
for Deteriorating Water Distribution Systems l. Serni-Markovian Model for a Water Main", Water Resources Research 28 (4), 1053-1061.
Luong, H.T. and Fujiwara, 0. (2002). "Fund allocation fro pipe repair maintenance in water distribution networks", European Journal of Operational Research 136, 403-421.
Micevski, T., Kuczera, G., and Coombes, P. (2002). "Markov Model for Storm Water Pipe Deterioration", Journal of Infrastructure Systems 8 (2), 49-56.
Miyamoto, A., Kawamura, K. and Nakamura, H. (2001). "Development of a bridge management system for existing bridges", Advances in Engineering Software, 32, 821-833.
Onofriou, T. and Frangopol, D.M. (2002). "Reliability-based inspection optirnisation of complex structures: a brief retrospective", Computers and Structures, 80,
1133-1144.
Peter-Lazar, 1., Heinfling G., Gerard B., and Marchand J. (2000). "Application of probabilistic methods to the analysis of the behaviour of reinforced concrete structures affected by steel corrosion", in Concrete durability, Proceedings of a CANMET Conference, Barcelona, June, 2000, 557-572.
Ritchie, D., Voermans, C.W.M., Larsen, M.H. and Vranckx, W.R. (1998). "Probabilistic tools for planning of inspection and repair of corroded pipelines", proceedings of OMAE'98, I1h International Conference on Offshore Mechanics and Arctic Engineering, no OMAE98-090l.
Roelfstra, G. (2001). "A model of condition evolution of concrete highway bridges"
(in French), Ph.D. thesis 2310, The Swiss Federal Institute of Technology, Lausanne,