15 October 2020
POLITECNICO DI TORINO
Repository ISTITUZIONALE
New insights on the defect sites evolution during CO oxidation over doped ceria nanocatalysts probed by in situ Raman spectroscopy / Sartoretti, E.; Novara, C.; Fontana, M.; Giorgis, F.; Piumetti, M.; Bensaid, S.; Russo, N.; Fino, D.. - In: APPLIED CATALYSIS A: GENERAL. - ISSN 0926-860X. - ELETTRONICO. - 596(2020), p. 117517.
Original
New insights on the defect sites evolution during CO oxidation over doped ceria nanocatalysts probed
by in situ Raman spectroscopy
Publisher: Published DOI:10.1016/j.apcata.2020.117517 Terms of use: openAccess Publisher copyright
(Article begins on next page)
This article is made available under terms and conditions as specified in the corresponding bibliographic description in the repository
Availability:
This version is available at: 11583/2809292 since: 2020-04-06T19:08:36Z
1
Supporting Information
New insights on the defect sites evolution during CO oxidation over doped
ceria nanocatalysts probed by in situ Raman spectroscopy
Enrico Sartoretti
a,+, Chiara Novara
a,+, Marco Fontana
b, Fabrizio Giorgis
a, Marco Piumetti
a, Samir Bensaid
a*,
Nunzio Russo
a, Debora Fino
aa Department of Applied Science and Technology, Politecnico di Torino, Corso Duca degli Abruzzi, 24, 10129 Turin, Italy. b Center for Sustainable Future Technologies, Istituto Italiano di Tecnologia, Via Livorno, 60, 10144 Turin, Italy.
*E-mail: samir.bensaid@polito.it
Experimental
Raman analyses
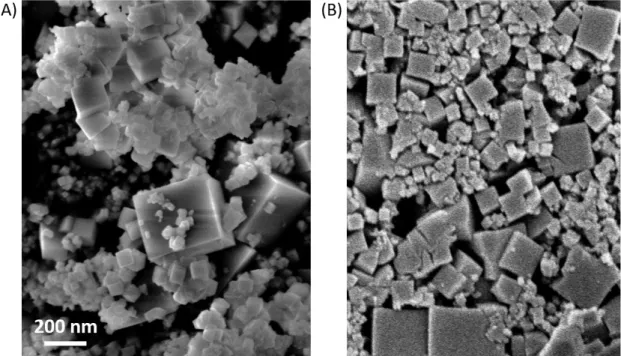
Fig. S1. FESEM micrographs of the CeO2 catalyst in powder (A) and after compression at 3 bar to prepare a tablet (B). The
2
Results and Discussion
Catalyst characterization and activity
Fig. S2. Selected area electron diffraction (SAED) patterns of the four different samples. The violet lines represent a simulated
pattern for ceria crystal structure.
Table S1 provides results obtained by the analysis of the electron diffraction patterns reported in Fig. S2.
The diffraction rings were analyzed with the Circular Hough analysis tool [1] provided in Digital
Micrograph
TMsoftware. The CeO
2
reference crystallographic structure (CeO
2REF in the table) is
calculated from data provided in [2].
Table S1. Summary of the results from SAED measurements on the four different classes of samples.
CeO2 REF Miller indices d (Å) d/ d(111) CeO2 ring d/ d(111) Ce95Mn5 ring d/ d(111)
(111) 3,12 1,00 1 1,00 1 1,00
(200) 2,70 0,87 2 0,86 2 0,87
(220) 1,91 0,61 3 0,61 3 0,61
(311) 1,64 0,52 4 0,52 4 0,52
(222) 1,56 0,50 5 0,49 5 0,50
Ce95Cu5 ring d/ d(111) Ce95Cu2.5Mn2.5 ring d/ d(111)
1 1,00 1 1,00
2 0,87 2 0,87
3 0,61 3 0,61
4 0,52 4 0,52
3
Fig. S3. XRD diffractograms of the four samples (data, except for Ce95 Mn5, and details about the experimental procedures
previously reported in [3]). Powder XRD was performed in a Philips X’Pert PW3040 diffractometer, using a Cu Kα radiation (wavelength λ = 1.5418 · 10−10 m, 2θ range = 20°–70°; step = 0.05° 2θ; time per step = 0.2 s). The diffraction peaks were indexed according to the Powder Data File database (PDF 2000, International Centre of Diffraction Data, Pennsylvania). The crystal average size Dc (nm) reported in the manuscript was estimated using Scherrer’s equation, Dc = 0.9 λ/(β cos θ), where 0.9 is the shape factor for spheres, λ is the Cu Kα wavelength (nm), β is the full-width at half maximum FWHM (rad) and θ is the Bragg angle (rad). The FWHM data were previously corrected comparing them with those of a lanthanum hexaboride standard. The lattice parameter a was predicted using Nelson-Riley function.
Fig. S4. Representative EDX spectra for the pristine and doped ceria powders acquired with parallel beam illumination in the
4
Fig. S4 shows representative EDX spectra obtained with parallel beam illumination of the different
pristine and doped ceria powders. These results confirm the presence of the dopant elements, in
accordance with the specific precursors exploited for the synthesis. Au TEM grids were used for the
analysis instead of common Cu grids, in order to avoid the presence of a spurious Cu Kα peak. Fe/Co
peaks are due to the pole pieces.
Fig. S5. Typical literature assignments of the observed Raman components to the different types of defect sites which can be
found in the ceria lattice.
In situ Raman analyses of the CO oxidation reaction
Fig. S6. Position (A) and full width at half maximum (B) of the F2g peak as a function of the temperature. The values were
obtained from the Raman spectra of pure CeO2 collected during the in-situ analyses of CO oxidation (Fig. 4A) and during
5
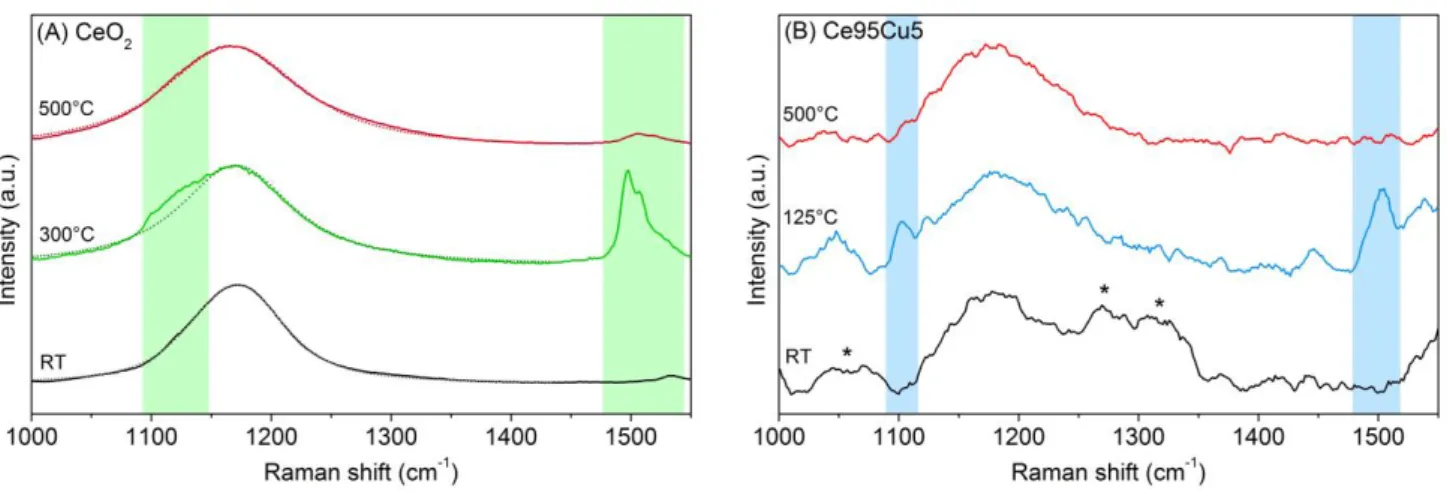
Fig. S7. Magnification in the 1000-1550 cm-1 range of the Raman spectra acquired on the CeO
2 (A) and Ce95Cu5 (B) samples
while performing the CO oxidation from RT to 500 °C. For each catalyst, the initial (RT) and final (500 °C) spectra are reported, together with an intermediate spectrum recorded at the temperature at which the most intense polyenes-associated bands are visible (located in the regions highlighted with coloured bands). The dotted lines in the first figure, representing the shape of ceria second order band obtained by deconvolution, were added to assist the identification of the 1120 cm-1 band. The asterisks
in Fig. S7B indicate peaks associated to the presence of contaminants at RT.
Fig. S8. Magnification in the 1450-1650 cm-1 range of the Raman spectra collected at different temperatures during the CO
oxidation (1000 ppm of CO and 10% of O2 in N2) on a CeO2 samples. The catalyst tablet was pretreated at 500 °C for 1 h
before starting the analysis, in order to remove any organic contamination. Despite the absence of carbonaceous species at RT (no bands were detected in the 1450-1650 cm-1 range), the polyenes-related band located at about 1500 cm-1 appears and show
6
Fig. S9. Position (A) and full width at half maximum (B) of the F2g peak as a function of the temperature. The values were
obtained from the Raman spectra collected on Ce95Cu5 during the in-situ analyses of CO oxidation (Fig. 4B) and during analyses in air flow [spectra reported in [4] (ref. [37] in the main text)].
Fig. S10. Raman spectra collected at different temperatures during the CO oxidation on the Ce95Mn5 (A) and
Ce95Cu2.5Mn2.5 (B) samples. In the insets, the defect region is magnified (the spectra are shown every 50 °C to reduce the number of overlapping curves).
7
In situ Raman analyses during reduction-oxidation cycles
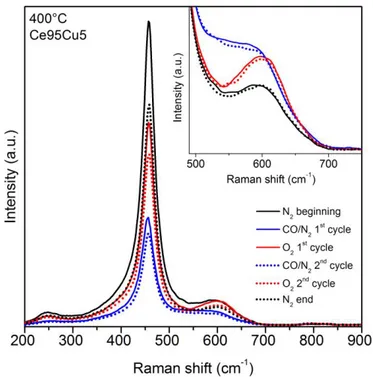
Fig. S11. Raman spectra acquired on the Ce95Cu5 sample at 400 °C in two different atmospheres during the cycles of reduction
and oxidation. When the sample is exposed to 1000 ppm of CO in N2, the spectral intensity drops but no bands related to the
formation of soot-like species can be detected.
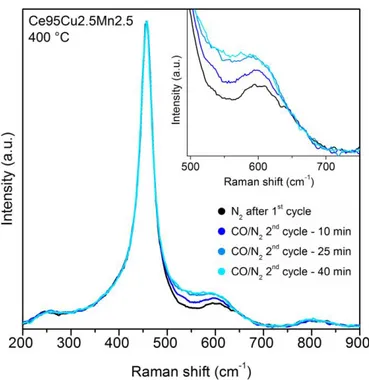
Fig. S12. Raman spectra acquired on the Ce95Cu2.5Mn2.5 sample during the reducing phase of the 2nd cycle of reduction and
oxidation. The spectra were collected at 400 °C immediately before and 10, 25 and 40 min after the gas change from N2 to the
1000 ppm CO/N2 mixture. All the spectra were normalized to the intensity of the F2g peak. In the inset a magnification of the
8
Fig. S13. Raman spectra acquired on the Ce95Cu5 sample at 400 °C during cycles of reduction and oxidation, in which 2000
ppm of CO in N2 was used as reducing mixture. The spectra were collected 40 min after the gas change. In the inset the spectra
normalized to the intensity of the F2g peak are reported and a magnification of the defect band is shown.
References
[1] D.R.G. Mitchell, Circular Hough transform diffraction analysis: A software tool for automated measurement of selected area electron diffraction patterns within Digital MicrographTM, Ultramicroscopy. 108 (2008) 367–374.
doi:10.1016/j.ultramic.2007.06.003.
[2] C. Artini, M. Pani, M.M. Carnasciali, M.T. Buscaglia, J.R. Plaisier, G.A. Costa, Structural features of Sm- and Gd-doped ceria studied by synchrotron X-ray diffraction and -raman spectroscopy, Inorg. Chem. 54 (2015) 4126–4137.
doi:10.1021/acs.inorgchem.5b00395.
[3] M. Dosa, M. Piumetti, S. Bensaid, T. Andana, C. Novara, F. Giorgis, D. Fino, N. Russo, Novel Mn–Cu-Containing CeO2
Nanopolyhedra for the Oxidation of CO and Diesel Soot: Effect of Dopants on the Nanostructure and Catalytic Activity, Catal. Letters. 148 (2018) 298–311. doi:10.1007/s10562-017-2226-y.
[4] E. Sartoretti, C. Novara, F. Giorgis, M. Piumetti, S. Bensaid, N. Russo, D. Fino, In situ Raman analyses of the soot oxidation reaction over nanostructured ceria-based catalysts, Sci. Rep. 9 (2019) 3875. doi:10.1038/s41598-019-39105-5.

![Fig. S3. XRD diffractograms of the four samples (data, except for Ce95 Mn5, and details about the experimental procedures previously reported in [3])](https://thumb-eu.123doks.com/thumbv2/123doknet/13887119.447162/4.892.221.672.95.500/fig-diffractograms-samples-details-experimental-procedures-previously-reported.webp)