HAL Id: inserm-02337827
https://www.hal.inserm.fr/inserm-02337827
Submitted on 29 Oct 2019
HAL is a multi-disciplinary open access
archive for the deposit and dissemination of
sci-entific research documents, whether they are
pub-lished or not. The documents may come from
teaching and research institutions in France or
abroad, or from public or private research centers.
L’archive ouverte pluridisciplinaire HAL, est
destinée au dépôt et à la diffusion de documents
scientifiques de niveau recherche, publiés ou non,
émanant des établissements d’enseignement et de
recherche français ou étrangers, des laboratoires
publics ou privés.
E. coli
Sarada Raghavan, Sharon Chee, Juntao Li, Jérémie Poschmann, Niranjan
Nagarajan, Siau Jia Wei, Chandra Verma, Farid Ghadessy
To cite this version:
Sarada Raghavan, Sharon Chee, Juntao Li, Jérémie Poschmann, Niranjan Nagarajan, et al..
Develop-ment and application of a transcriptional sensor for detection of heterologous acrylic acid production in
E. coli. Microbial Cell Factories, BioMed Central, 2019, 18 (1), pp.139. �10.1186/s12934-019-1185-y�.
�inserm-02337827�
RESEARCH
Development and application
of a transcriptional sensor for detection
of heterologous acrylic acid production in E. coli
Sarada S. Raghavan
1, Sharon Chee
1, Juntao Li
2, Jeremie Poschmann
3, Niranjan Nagarajan
2, Siau Jia Wei
1,
Chandra S. Verma
4,5,6and Farid J. Ghadessy
1*Abstract
Background: Acrylic acid (AA) is a widely used commodity chemical derived from non-renewable fossil fuel sources. Alternative microbial-based production methodologies are being developed with the aim of providing “green” acrylic acid. These initiatives will benefit from component sensing tools that facilitate rapid and easy detection of in vivo AA production.
Results: We developed a novel transcriptional sensor facilitating in vivo detection of acrylic acid (AA). RNAseq analysis of Escherichia coli exposed to sub-lethal doses of acrylic acid identified a selectively responsive promoter (PyhcN) that was cloned upstream of the eGFP gene. In the presence of AA, eGFP expression in E. coli cells harbouring the sensing construct was readily observable by fluorescence read-out. Low concentrations of AA (500 μM) could be detected whilst the closely related lactic and 3-hydroxy propionic acids failed to activate the sensor. We further used the developed AA-biosensor for in vivo FACS-based screening and identification of amidase mutants with improved catalytic properties for deamination of acrylamide to acrylic acid.
Conclusions: The transcriptional AA sensor developed in this study will benefit strain, enzyme and pathway engi-neering initiatives targeting the efficient formation of bio-acrylic acid.
© The Author(s) 2019. This article is distributed under the terms of the Creative Commons Attribution 4.0 International License (http://creat iveco mmons .org/licen ses/by/4.0/), which permits unrestricted use, distribution, and reproduction in any medium, provided you give appropriate credit to the original author(s) and the source, provide a link to the Creative Commons license, and indicate if changes were made. The Creative Commons Public Domain Dedication waiver (http://creativecommons.org/ publicdomain/zero/1.0/) applies to the data made available in this article, unless otherwise stated.
Background
Acrylic acid (AA; also known as 2-propenoic acid) is a low molecular weight commodity chemical synthe-sized from petroleum-derived products. It is a feed-stock for acrylate esters that are extensively used in the manufacture of paint-additives, adhesives, textiles and super absorbent materials such as diapers. Acrylic acid is conventionally generated by oxidation of propylene or propane, and the main challenge to this process is dependence on non-renewable fossil-fuel sources subject to unpredictable price fluctuations. Alternative “green” bio-based routes to produce acrylic acid from renewable
sources such as sugars have therefore been proposed and investigated [1–4].
Early research focused on endogenous acrylic acid ducers, such as the obligate anaerobes Clostridium
pro-pionicum and Megasphaera elsdenii that are capable of
reducing lactic acid to propionic acid via an acrylyl-CoA intermediate [5]. In the presence of an electron acceptor (e.g. oxygen or methylene blue) acrylate can accumulate in Clostridium propionicum via oxidation of propionate [2, 6]. More recently, it was demonstrated that acrylate pathway enzymes from Clostridium propionicum can be expressed in a heterologous host (E. coli), enabling propionic acid biosynthesis from d-lactic acid via an acrylate intermediate [7]. Total biosynthesis of AA has further been described in engineered E. coli via enzy-matic dehydration of 3-hydroxy propionic acid (3-HP) [8, 9]. However, given the low AA yields reported, signifi-cant pathway and enzyme engineering will be required to
Open Access
*Correspondence: faridg@p53Lab.a-star.edu.sg
1 p53 Laboratory Technology Development Group, A*STAR , 8A
Biomedical Grove #06-06 Immunos, Singapore 138648, Singapore Full list of author information is available at the end of the article
develop a commercially viable process. This endeavor will be expedited by tools facilitating rapid analysis of AA, routinely detected by low throughput, time consuming chromatographic techniques requiring sample prepara-tion. High throughput screening campaigns interrogating sizeable mutant enzyme diversity and metabolic pathway iterations would particularly benefit from such tools. To
this end, genetically encoded transcriptional sensors have proven useful for the clonal, real-time, and quantitative assessment of intracellular analyte concentrations [10]. These typically comprise cognate promoter elements of an analyte-responsive transcription factor that drive expression of a coupled read-out module, often a fluo-rescent protein [11]. Using this approach, sensors have
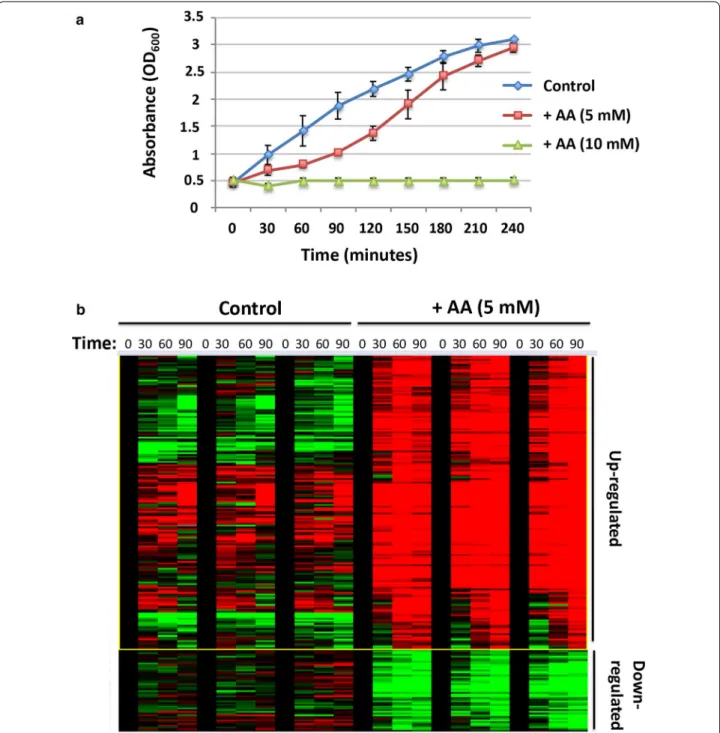
Fig. 1 a Growth curves of E. coli cells treated with indicated concentrations of acrylic acid. Values represent average ± SD (n = 2). b RNAseq
cluster heatmap indicating significant changes in up-regulated (red) and down-regulated (green) genes in E. coli exposed to acrylic acid (5 mM). Experiments were carried out in triplicate over the four indicated time points
been developed for a diverse array of analytes including amino acids, alcohols, flavonoids, organic acids, sugars and antibiotics [10–16]. When read-outs are compatible with high-throughput analytical platforms such as FACS, these sensors have facilitated significant improvements in product yields.
Here, we employ transcriptome analysis to identify
E. coli genes selectively up-regulated in the presence of
acrylic acid. Candidate promoters regulating these genes were coupled to an eGFP reporter module and sensitiv-ity to acrylic acid confirmed. We further validate the lead sensor by in vivo selection of amidase variants showing improved catalytic conversion of acrylamide to acrylic acid.
Results and discussion
Identification of AA‑responsive genes by transcriptome analysis
Escherichia coli growth curves in the presence of acrylic
acid indicated that concentrations > 5 mM were lethal. At 5 mM AA, cells recover after an initial delay (~ 90 min), and follow the growth characteristics of untreated cells (Fig. 1a). In order to study gene expression changes upon exposure to acrylic acid, we carried out RNAseq analysis of E. coli cells treated with 5 mM AA at early time points (0, 30, 60, 90 min) on the growth curve. Notable varia-tions were observed in global expression profiles between treated and untreated samples (Fig. 1b). Greater than twofold transcriptional up-regulation occurred in 34, 58 and 83 genes at the respective 30, 60 and 90 min time points (Additional file 1).
Validation of the acrylic acid—responsive genes
Transcript levels of the top 10 genes up-regulated by AA at the 30 min sampling point (Table 1) were fur-ther investigated by quantitative real time PCR. In all cases, transcriptional up-regulation induced by AA was observed, with maximum increments over controls rang-ing between 2- and 18-fold (Fig. 2). Signals plateaued at 30–60 min for all genes, correlating with the 90 min time interval post AA-treatment when E. coli growth reverts to normal. A subset of these genes (yhjX, bhsA, yhcN and
prpB) displayed improved signal to noise ratios due to
persistent low level activity in the absence of AA (Addi-tional file 2: Fig. S1), and were further evaluated.
Development of transcriptional sensor detecting acrylic acid
Promoter sequences of the 4 candidate genes (PyhjX, PbhsA,
PyhcN and PprpB) (Additional file 2: Fig. S2) were cloned
upstream of eGFP and E. coli cells transformed with plas-mids encoding the putative sensors. Cells were treated
with 5 mM acrylic acid and fluorescence monitored over 24 h (Additional file 2: Fig. S3). The PyhcN, PprpB and PyhjX
sensors displayed varying increases in fluorescence over no treatment and lactic acid controls. This was most pro-nounced for PyhcN, exhibiting ~ 50% increased signal over
controls 2 h post-treatment that persisted over the 24 h time course. Relatively lower signal gains for the PprpB
and PyhjX sensors (15–20%) were observed from the 6 h
time point onwards. Efforts to improve the signal to noise ratio for the PyhcN-eGFP sensor by truncation of the yhcN
promoter sequence did not boost sensor performance (Additional file 2: Fig. S4).
Specificity and sensitivity of the acrylic acid sensor
The PyhcN-eGFP sensor strain was next evaluated by
FACS analysis. Cells treated with acrylic acid (0, 2.5, 5 mM) showed a dose responsive increase in eGFP flu-orescence indicated by right shifting of the histogram (Fig. 3a). Treatment with the potential acrylic acid pre-cursors acrylamide, lactic acid and 3-hydroxy propionic acid (5 mM) did not result in appreciable signal gain, confirming specificity of the PyhcN-eGFP sensor (Fig. 3b).
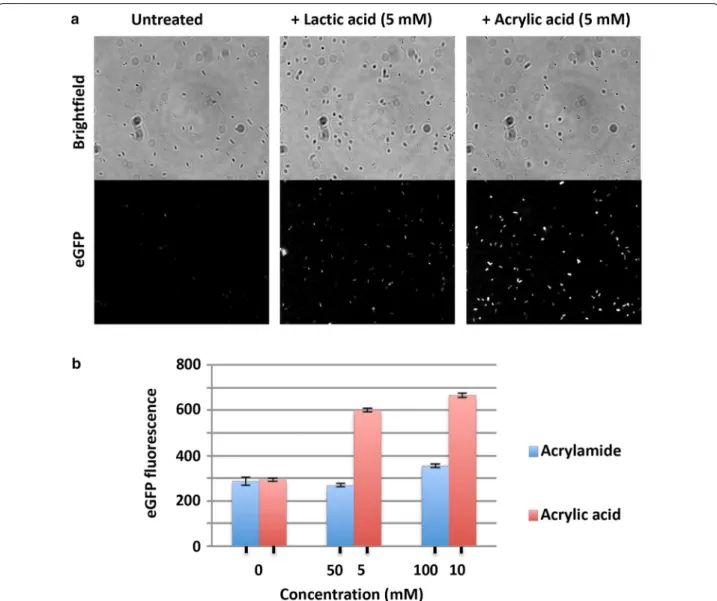
This was further confirmed by fluorescence imaging of the PyhcN-eGFP sensor strain 6 h post treatment with
AA (5 mM) which showed clear enhancement of sig-nal over no-treatment and lactic acid (5 mM) controls (Fig. 4a). Additionally, high concentrations of acrylamide (100 mM) did not activate the sensor (Fig. 4b).
Stable integration of the transcriptional acrylic acid sensor into E. coli cells
The PyhcN-eGFP reporter cassette was next stably
inte-grated into E. coli using bacteriophage lambda medi-ated recombination [17]. The resultant strain showed improved sensor turn-on in the presence of AA when measured by FACS (Fig. 5a). Dose-dependent sig-nal read-out was also readily detected by fluorescence
Table 1 Top 10 genes upregulated after 30 min in E. coli exposed to acrylic acid
Gene Fold up‑regulation Function
yhjX 6.5 Putative carboxylic acid antiporter
bhsA 5.7 Multiple stress protein
gcd 5.4 Glucose dehydrogenase
ybgS 5.4 Unknown
yhcN 4.5 Cellular response to acidity/peroxide
nrdH 4.3 Glutaredoxin-like protein
prpC 4.3 Citrate synthase
sufA 4.0 Iron-sulphur cluster assembly
prpB 4.0 Methyl isocitrate lyase
measurements using a plate reader, with relatively low concentrations (500 μM) of AA measurable after 45 min using the whole-cell PyhcN-eGFP biosensor
(Fig. 5b). Imaging of the stably transformed strain exposed to AA showed clear analyte-dependent eGFP fluorescence (Additional file 2: Fig. S5), as observed with the plasmid-based sensor (Fig. 4a).
Selection of improved G. pallidus RAPc8 amidase variants
Acrylic acid can be made via enzymatic deamination of acrylamide as demonstrated using aliphatic amidases [18, 19]. We coupled this relatively simple pathway to AA sensor output by expressing the G. pallidus RAPc8 amidase [19] in E. coli and measuring sensor fluores-cence by FACS after incubation with acrylamide. A clear
Fig. 2 Transcription levels of candidate AA-responsive genes in E. coli measured by qPCR over indicated times (minutes) after AA treatment (5 mM).
upwards shift in the population of eGFP-expressing cells is observed compared to the no-substrate control (Fig. 6). This shift is not observed when the catalytically inactive E142D and E142L amidase mutants [20] were expressed. We next created a library of randomly mutated RAPc8 amidase variants (n = ~ 5 × 10⁵) and screened for improved in vivo acrylamide deamination by FACS. After 2 rounds of selection, secondary screening was carried out on 62 individually sorted clones using plate-based measurement of reporter fluorescence. The top 5 clones from this analysis were further analysed by FACS, and
this confirmed 4 of these clones to show improved activ-ity over WT (Additional file 2: Fig. S6).
Sequence analysis of the amidase gene in 3 of these selectants (C26, C60, C65) highlighted 5 mutations in C60 (M45L, A77T, M203V, D294N, K342E), and 3 mutations in C65 (V17A, V217I, R264C). Interestingly, whilst C26 encoded WT enzyme, two silent mutations were present in codons 208 (GCG to GCA) and 326 (ACT to ACC) that likely contributed to increased amidase expression and acrylamide turnover via codon-optimisation effects [21, 22]. Mutations in C60 and C65 were distributed
Fig. 3 a Parental E. coli and cells expressing plasmid-encoded acrylic acid sensor were treated with indicated acrylic acid concentrations (3 h) and
eGFP fluorescence measured by FACS. Traces for both control and treated parental E. coli cells (yellow, cyan and brown) overlap. b Response of PyHCN-eGFP sensor to indicated compounds (5 mM)
throughout the enzyme’s tertiary structure (Fig. 7). Com-parative sequence analysis indicated common phyloge-netic variation at positions 77 (alternatively T or S) and 203 (alternatively V or I), highlighting natural selection for the A77T and M203V mutations in C60 identified here by laboratory evolution. Notably, positions 77 and 203 were correspondingly S and V in the Hydrogenovibrio kuenenii aliphatic amidase (84% sequence identity to RAPc8 ami-dase). Kinetic parameters of purified RAPc8-C60 for the acyl transfer reaction indicated ~ 1.6-fold improvement in kcat/Km over wild-type enzyme (Table 2) that was driven by an elevated kcat. The M203V mutation contrib-uted towards this improved activity of C60, with RAPc8-M203V showing ~ 1.3-fold kcat/Km increase over WT. This is likely due to repositioning of an adjacent distorted
helix (residues 167–173) that precedes C166 of the cata-lytic triad (Fig. 7). Whilst RAPc8-A77T displayed ~ two-fold reduced Km compared to WT, this was accompanied by reduced kcat. Kinetic paramters of the RAPc8-A77T/ M203V double mutant were essentially the same as RAPc8-A77T. Other mutations present in C60 therefore likely contributed to the overall improved phenotype.
In the selection protocol we describe there is the pos-sibility that diffusion of AA from within cells express-ing active amidase genes would co-activate the sensor in other cells expressing inactive mutants, resulting in increased false postives and higher background. Future selections could mitigate this issue by segregating cells utilising compartmentalisation [23] or performing col-ony-based selection on agar plates [24].
Fig. 4 a Cells expressing PyHCN-eGFP sensor were treated as indicated for 6 h and imaged by fluorescence microscopy. b eGFP fluorescence of cells
Fig. 5 a Control E. coli (left) or stably transduced E. coli (PyHCN-eGFP)(right) were treated with acrylic acid (5 mM) overnight and analysed by FACS. b Stably transduced AA reporter cells treated with indicated concentrations of AA and fluorescence measured over time
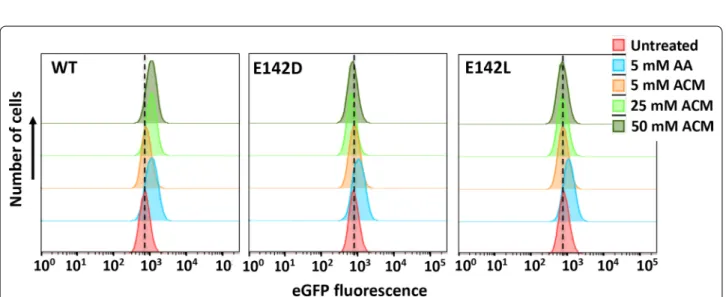
Fig. 6 FACS analysis indicating eGFP fluorescence of stably transduced E. coli (PyHCN-eGFP) cells expressing RAPc8 amidase (WT) or the inactive E142D and E142L mutants. Cells were treated with indicated concentrations of acrylic acid (AA, positive control) or acrylamide (ACM) for 2 h prior to analysis
Up‑regulation of yhcN in response to stress
The AA-responsive yhcN gene identified in this study encodes an 87 amino acid polypeptide with a predicted periplasmic location. It has previously been ascribed to a
network of E. coli stress-induced proteins, with its expres-sion up-regulated by hydrogen peroxide and cadmium exposure. It is also implicated in regulating biofilm forma-tion in response to stress [25]. Furthermore, in addition
Fig. 7 Position of mutations present in selected RAPc8 C60 and C65 variants (magenta). Residues depicted in orange (E59, K134, C166) comprise
the catalytic triad. M203 is shown in spheres to highlight packing against the distorted helix (residues 167–173 denoted in green) that likely undergoes structural changes to adapt to the loss of interactions when M203 is mutated to V with a smaller sidechain (adapted from the crystal structure 2PLQ [28] and drawn using PyMOL [29])
Table 2 Kinetic parameters for RAPc8 and indicated mutants
Values represent average ± SD (n = 3)
RAPc8 enzyme variant Vmax
(uM min−1) Km(mM) kcat(min−1) kcat/Km(mM−1 min−1)
WT 106.5 ± 6.1 7.3 ± 0.1 7096.3 ± 404.7 978.9 ± 63.3
A77T 66.7 ± 2.1 4.5 ± 0.2 4447.7 ± 139.2 996 ± 21.4
M203V 146.8 ± 16.7 7.2 ± 1.1 9784.7 ± 1113.3 1374.5 ± 70
A77T + M203V 64.7 ± 4.6 4.6 ± 0.4 4315 ± 308.4 935.7 ± 35.9
to 4 other markedly AA-responsive genes identified in this study (yhjX, nrdH, gcd and gadA)(Table 1), yhcN is up-regulated in low-pH conditions in the E. coli strain K-12 W3110 [26, 27]. In our experiments, the PyhcN-eGFP
reporter was selectively responsive to acrylic acid, show-ing no activation by lactic acid or 3-HP. Given the similar pKa values of these acids, the differential response may arise from the different yhcN promoter contexts (endog-enous versus synthetic construct) and/or differences in effective intracellular concentrations of these acids. As lactic acid and 3-HP are both direct precursors of AA in synthetic pathways grafted into E. coli [7–9], the developed
AA sensor should expedite efforts to increase yields. This could be achieved through rational pathway engineering and/or mutagenesis of key enzymes linked to selection, as shown in this study by identification of improved amidase variants.
Conclusions
In summary, we have developed and applied a tran-scriptional biosensor facilitating detection of acrylic acid in vivo. This was achieved through transcriptome analysis of E. coli exposed to acrylic acid and validation of candidate promoters upstream of highly up-regu-lated genes. We further applied the biosensor to report on E. coli acrylic acid production linked to the simple enzymatic deamination of exogenous acrylamide. This tool should expedite both development and optimisa-tion of E. coli strains capable of producing sustainable and economically viable bio-acrylic acid.
Materials and methods Chemicals and reagents
All chemicals including acrylic acid, acrylamide, lactic acid, 3-hydroxy propionic acid and DMSO used in this study were purchased from Sigma-Aldrich (USA).
nrdH-F 5′-GTA ACG ATT GCG TTC AGT GCC-3′ nrdH-R 5′-CAG ACC AGC TAA GAT CGC CA-3′ prpC-F 5′-CGA GTT TAA CGC CTC CAC CT-3′ prpC-R 5′-TCG TAG CGT TGC TGG ATC TC-3′ sufA-F 5′-CTT AGG CGT GAA GCA AAC GG-3′ sufA-R 5′-TCG ACT TCC GTG CCA TCA AT-3′ prpB-F 5′-GCT GCC CGA TCT CGG TAT TT-3′ prpB-R 5′-CGC ACC GGC TTT AAT CAT CG-3′ gadA-F 5′-CTG CTG GCA TAA ATT CGC CC-3′ gadA-R 5′-GTG TAG GTC ACG CCG AAA GT-3′ adk-F 5′-ATC CGC CGA AAG TAG AAG GC-3′ adk-R 5′-TTA CCC GCT TCC GCT TCT TT-3′ gyrB-F 5′-TGG TTG TGG TAT CGG TCG TG-3′ gyrB-R 5′-GCT GAG CGA TGT AGA CGT GA-3′ Primers to clone promoters and GFP into pUC19 vector
GFP BamHI cgactctagaggatccATG GTG AGC AAG GGC GAG G GFP NdeI tgagagtgcaccatatgTTA TCT AGA CTT GTA CAG CTC GTC CAT
GCC G
PyhjX for ccttttgctcacatgtCGT AAC AGT CAC AAT TGA AAC CAT TAA
ATA AC
PyhjX rev GCC CTT GCT CAC CAT GGC AGT ATT CCT GCA GTA ATA AAA
AGG
PbhsA for ccttttgctcacatgtGAT GCC GTT GTA CCT GGT GAC PbhsA rev GCC CTT GCT CAC CAT AAT AGT GGC CTT ATG CAG ATG AAT
GAC
PyhcN for ccttttgctcacatgtTCT CTG CCC CGT CGT TTC
PyhcN rev GCC CTT GCT CAC CAT GAT TTT TAC CTC GAC ATA ATC TTT TAG CTGG
PprpB for ccttttgctcacatgtAGC GCA CCG CAA AGT TAA GAAAC
PprpB rev GCC CTT GCT CAC CAT AGC CCA TCC TTT GTT ATC AAC TTG
TTA TTTG Sequencing primers
eGFP mid rev 5′-AGG GTC AGC TTG CCG TAG G-3′ pET Upstream 5′-ATG CGT CCG GCG TAGA-3′ Duet Down1 5′-GAT TAT GCG GCC GTG TAC AA-3′ Duet Up2 5′-TTG TAC ACG GCC GCA TAA TC-3′ T7 terminator 5′-GCT AGT TAT TGC TCA GCG G-3′ ACYCDuetUP1 5′-GGA TCT CGA CGC TCT CCC T-3′ pETF2 5′-CAT CGG TGA TGT CGG CGA T-3′ petR 5′-CGG ATA TAG TTC CTC CTT TCA GCA -3′ Stable integration primers
attP-F cacagaattcCGT CTG TTA CAG GTC ACT AAT ACC ATCT attPSOE-R ACA TTT CCC CGA AAA GTG CCA CCT GAA CAT CAC CGG GAA
ATC AAA TAA TGAT
pSR158-F 5′-GAT CCG GCT GCT AAC AAA GCC-3′
pSR158-R 5′-GAT TTT TAC CTC GAC ATA ATC TTT TAG CTG GG-3′ EcoliAttB-F CTG AAA ATG TGT TCA CAG GTT GCT
EcoliattB-R GCA ATG CCA TCT GGT ATC ACT TEM1prom-F TTC AGG TGG CAC TTT TCG GGG AAA TGT
TEM1prom-R TGT GGA ATT CCT ACA CTA GAA GGA CAG TAT TTG GTA TCT GC
Cloning RApc8 amidase WT and mutants
GpAmidase-F gtataagaaggagatataCAT ATG CGT CAT GGA GAT ATT AGC TCCTC
Oligonucleotide primers Real-time PCR primers
yhjX-F 5′-TGC TGA CGC TCT CTA ACT GC-3′ yhjX-R 5′-GCA ATC GCT CCC CAA ATC AC-3′ bhsA-F 5′-TGT CAT TTG CCA GCT TTG CG-3′ bhsA-R 5′-TAC GGA AAG ATT TTG CGC CC-3′ gcd-F 5′-TGG TCG CAA TCA GGA AGG TC-3′ gcd-R 5′-ATC GGC GTC ACT TCA TTG GT-3′ ybgS-F 5′-ATG TCG CGC CAA ATA ACG TC-3′ ybgS-R 5′-TAT CCG GAC AGC GAC CAT CT-3′ yhcN-F 5′-TCT CTT TCG GTG CAT TCG CT-3′ yhcN-R 5′-TAA TCT GGT AGG CCG TTG CG-3′
GpAmidase-R cagcggtttctttaccagaCTC GAG TTA GTG GTG GTG GTGG E142D-F 5′-CTT GGT GCC CCA TCGAtGGG TGG TAC CCT GGCG-3′ E142D-R 5′-CGC CAG GGT ACC ACCCaTCG ATG GGG CAC CAAG-3′ E142L-F 5′-CCT TGG TGC CCC ATCctgGGG TGG TAC CCT GGC-3′ E142L-R 5′-GCC AGG GTA CCA CCCcagGAT GGG GCA CCA AGG-3′ A77T-F 5′-GAA ATG TTC GCG ACA GCC aCCA GCA TTC CAG GGG-3′ A77T-R 5′-CCC CTG GAA TGC TGGtGGC TGT CGC GAA CAT TTC -3′ M203V-F 5′-GAA CAG CAA ATA ATGgTGG CTA AAG CAA TGG-3′ M203V-R 5′-CCA TTG CTT TAG CCAcCAT TAT TTG CTG TTC-3′
Identification of acrylic acid up‑regulated genes by RNAseq analysis
Acrylic acid treatment and RNA isolation
Escherichia coli BL21 cells cultured in LB medium (37 °C)
were exposed to increasing concentration of acrylic acid at the mid-log phase (OD600 = 0.5), and the sublethal dose
determined from the growth curves. For RNAseq experi-ments, E. coli BL21 culture was treated with either 0 or 5 mM acrylic acid at the mid-log phase and the cells were harvested at 0, 30, 60 and 90 min time points. Total RNA was extracted using RNeasy Mini kit (Qiagen) following the manufacturer’s protocol, and rRNA was removed using ribo-zero rRNA removal kit (Epicentre). RNA was quantified and quality confirmed by Bioanalyzer quality analysis (RIN values > 9.0). Experiments were carried out in triplicate. Illumina sequencing libraries were gener-ated from the RNA using the NEBNext RNA-seq library preparation kit following manufacturer’s guidelines (New England Biolabs). Each library was barcoded during PCR, libraries were then quantified by qPCR and equimolar aliquots of each library were pooled together. Sequencing was done on an Illumina HiSeq 2500 instrument.
Gene‑based expression matrix
Cuffnorm v2.2.0, a program that is part of Cufflinks [30], was used to generate a gene-based expression matrix from the BAM files. Cuffnorm was run with the options of “–library-type fr-unstranded” and “–library-norm-method classic-fpkm”. The resulting expression matrix was normalized for library size and values were represented as FPKM (fragments per kilobase of exon per million fragments mapped).
Hierarchical clustering
Hierarchical clustering was performed on the FPKM expression matrix using R v3.1.0. The expression matrix was first transformed to the log-2 space before comput-ing the distance matrix based on the Euclidean distance measure using the dist function of R. The Spearman’s rank correlation was next calculated using the cor func-tion before being plotted using the heatmap.2 funcfunc-tion from the gplots package of CRAN.
Differential expression analysis
Cuffdiff v2.1.1 (part of Cufflinks program) was used to identify differentially expressed genes at each time point. Default parameters were used except for the option of “–multi-read-correct” and “–max-bundle-frags 100000000”. A threshold of FDR < 0.05 and absolute log2 fold change > 2.0 was employed for significance. SAM (Significance Analysis of Microarrays) [31] was used to identify genes differentially expressed across time points. Analysis was performed in R v3.1.0 using the samr package from CRAN with the following options: resp. type = “Two class unpaired timecourse”, nperms = 100 and time.summary.type = “slope”. Genes having a log-2 fold change > 2.0 were assigned as up-regulated, while those having a log-2 fold change smaller than − 2 were assigned as down-regulated.
Analysis of endogenous transcript levels by qPCR
qPCR was carried out using the iScript Reverse Tran-scription Supermix (Bio-Rad). 1 µg RNA was used for a 20 µl reaction following manufacturer’s protocol. For RT-qPCR, SsoAdvanced SYBR Green Supermix (Bio-Rad) kit was used and 10 µl reactions were set up following manu-facturer’s protocol using real time PCR primers for each gene analysed.
Plasmid construction and live cell biosensor development eGFP was amplified using GFP-BamHI and GFP-NdeI primers and cloned into pUC19 vector. Candidate pro-moter regions of the top four up-regulated genes (arbi-trarily predicted to be located within the first 300 bp of the non-coding region preceding the ORF of can-didate up-regulated genes) (Additional file 2: Fig. S2) were amplified by PCR using Pprom-F and Pprom-R
prim-ers respectively and cloned upstream of the eGFP gene in the plasmid pUC19-eGFP cut using PciI and BamHI restriction by infusion cloning method. Reporter plas-mid constructs contain an ampicillin resistance gene,
E. coli origin of replication and an acrylic acid inducible
putative promoter region followed by the eGFP coding sequence. To make the truncated yhcN promoter Δ108, pUC19-PyhcN-eGFP was cut with PciI and re-ligated.
Biosensor development and validation
Live cell biosensors were developed by transforming chemically competent E. coli BL21 cells with the four plasmid constructs containing putative AA-responsive promoter sequences. Cells were grown in LB medium at 37 °C to mid-log phase followed by treatment with AA (or other chemicals) for various time points. The cells were collected by centrifugation, washed with phos-phate-buffered saline (PBS) and resuspended in the same buffer to normalise cell concentrations to OD600 = 1.
Expression of eGFP was measured by either FACS using the BD FACSAria cell sorter (BD Biosciences) or plate reader (PerkinElmer 2104), measuring green fluores-cence (Ex/Em = 488/509 nm) of 100 µl resuspended cells (OD600 = 1.0). Cells were also visualised by fluorescence
microscopy (AxioImager Z1 upright fluorescent micro-scope, Zeiss) to detect eGFP fluourescence. Treated or control cells were washed with PBS and diluted to OD600 = 1.0. One drop of the cell suspension was placed
on a microscope slide, air dried and covered with a cov-erslip. The 63 × oil immersion lens was used to visualise cells that were imaged with 500 ms exposure time. Generation of the E. coli BL21 PyhcN‑eGFP sensor strain
pET22b-Amp-attP-PyhcN-eGFP was amplified using
primers pETF2 and TEM1prom-R to create minicircles of attP-PyhcN-eGFP. The C3INT-HIS-PET22b(+)
plas-mid [17] was amplified with petF2 and petR and the PCR products were intramolecularly ligated to produce attP-PyhcN-eGFP and C3INT-HIS minicircles. A total of 100 ng of C3INT-HIS minicircle and 100 ng attP-PyhcN-eGFP minicircle were combined and electroporated into 25 µl electrocompetent BL21 cells. The cells were allowed to recover for 1 h at 37 °C before being plated on varying concentrations of ampicillin-LB agar plates (0.07 and 0.1 mg/ml). Incubation was carried out at 37 °C for 12–14 h to allow for expression of C3 integrase and chromosomal integration of the ampicillin-resistance cassette. Positive clones were confirmed by treating cells with 5 mM AA to turn on GFP expression. Genomic inte-gration into the attB site was confirmed by sequencing of PCR products generated using primers EcoliAttB-F and TEM1prom-R along with EcoliattB-R and TEM1prom-R. Selection of improved RAPc8 amidase variants
The RAPc8 amidase gene was randomly mutated (using the Agilent Gene Morph II random mutagenesis kit) and cloned into the plasmid pDuet-Amp-PyhcN-eGFP cut with
NdeI/XhoI. The pDuet-Amp-RapC8 amidase + PyhcN
-eGFP plasmid was transformed into BL21 cells to create a library (~ 5 × 10⁵ transformants). The library was grown
to OD600 ~ 0.5, induced with 0.1 mM IPTG and
acryla-mide added thereafter (5 mM). After 60 min, cells were diluted in 1X PBS and analysed by FACS. The top 5% and 1% brightest cells were respectively sorted in rounds 1 and 2. The amidase gene in R1 selectants was amplified by PCR prior to digestion and ligation into cut plasmid pDuet-Amp-PyhcN-eGFP and transformation into BL21
cells. Individual clones post R2 (n = 62) were assayed using the plate-based fluorescence assay with a subset of these showing improved activity over WT enzyme fur-ther validated by FACS.
Determination of kinetic parameters
Amidase activity was determined by quantifying the pro-duction of ammonia via the modified Berthelot reaction [20]. 15 nM amidase enzyme was incubated in 100 μl vol-ume of reaction buffer (20 mM potassium phosphate pH 7.2, 150 mM NaCl, 2 mM DTT) with acrylamide titrated up to a final concentration of 40 mM. The mixture was incubated at 37 °C for 20 min and ammonia production detected colourimetrically at 670 nm using the ammo-nia assay kit (Abcam). Standards were prepared using ammonium chloride. Measurements were performed in triplicate and kinetic parameters obtained using the non-linear regression curve fitting analysis in GraphPad Prism 7 (GraphPad Software, Inc., CA).
Expression and purification of RAPc8 amidase variants The RAPc8 amidase constructs were cloned with a C-terminal 6xHIS tag and transformed into Escherichia
coli BL21(DE3) (Invitrogen) competent cells. These were
grown in LB medium at 37 °C and induced at OD600 ~ 0.5
at 30 °C with 0.1 mM IPTG for 6 h for RAPc8, A77T and M203V. Cells expressing RAPc8-A77T/M203V and RAPC60 were induced at 25 °C with 0.5 mM IPTG and incubated overnight. Cells were then harvested by centrifugation, sonicated and clarified by centrifugation. The clarified cell lysates were applied to a His-GraviTrap column (GE Healthcare) and purified according to the manufacturer’s protocol. Protein purity as assessed by SDS-PAGE were ~ 95%, and fractions were pooled and buffer exchanged into PBS buffer with 0.5 mM DTT. All proteins were concentrated using Ami-con-Ultra (3 kDa MWCO) concentrator (Millipore). Pro-tein concentration were determined using the Bradford protein assay kit (BioRad) with bovine serum albumin as standard.
Additional files
Additional file 1. RNAseq data.
Additional file 2. Additional figures. Acknowledgements
None.
Authors’ contributions
SSR, SC, NHQA, JP and SJW carried out experimental work. JL carried out transcriptomic analysis with guidance from NN. SSR, FJG and CSV conceived experiments. FJG and SSR wrote manuscript. All authors interpreted data and reviewed the manuscript. All authors read and approved the final manuscript. Funding
This work was supported by the Agency for Science, Technology and Research (Singapore).
Availability of data and materials
The data and materials used/analysed in this study are available from the cor-responding author on reasonable request.
Ethics approval and consent to participate Not applicable.
Consent for publication Not applicable. Competing interests
CSV is the founder/scientific consultant of Sinopsee Therapeutics, a biotech-nology company developing molecules for therapeutic purposes; the current work has no conflict with the company. All other authors declare that they have no competing interests.
Author details
1 p53 Laboratory Technology Development Group, A*STAR , 8A Biomedical
Grove #06-06 Immunos, Singapore 138648, Singapore. 2 Genome Institute
of Singapore, 60 Biopolis Street, Genome, #02-01, Singapore 138672, Singa-pore. 3 Centre de Recherche en Transplantation et Immunologie, Inserm,
CHU-Nantes, CHU-Nantes, France. 4 Bioinformatics Institute, A*STAR , 30 Biopolis Street,
Singapore 138671, Singapore. 5 Department of Biological Sciences, National
University of Singapore, 14 Science Drive 4, Singapore 117543, Singapore.
6 School of Biological Sciences, Nanyang Technological University, 60 Nanyang
Drive, Singapore 637551, Singapore.
Received: 19 June 2019 Accepted: 3 August 2019
References
1. Gao C, Ma C, Xu P. Biotechnological routes based on lactic acid produc-tion from biomass. Biotechnol Adv. 2011;29:930–9.
2. Danner H, Urmos M, Gartner M, Braun R. Biotechnological production of acrylic acid from biomass. Appl Biochem Biotechnol. 1998;70–72:887–94. 3. Choi S, Song CW, Shin JH, Lee SY. Biorefineries for the production
of top building block chemicals and their derivatives. Metab Eng. 2015;28:223–39.
4. Straathof AJ, Sie S, Franco TT, van der Wielen LA. Feasibility of acrylic acid production by fermentation. Appl Microbiol Biotechnol. 2005;67:727–34. 5. Akedo M, Cooney CL, Sinskey AJ. Direct demonstration of
lactate-acrylate interconversion in Clostridium propioinicum. Bio/Technology. 1983;1:791–4.
6. O’’Brien DJ, Panzer CC, Eisele WP. Biological production of acrylic acid from cheese whey by resting cells of Clostridium propionicum. Biotechnol Progr. 1990;6:237–42.
7. Kandasamy V, Vaidyanathan H, Djurdjevic I, Jayamani E, Ramachandran KB, Buckel W, Jayaraman G, Ramalingam S. Engineering Escherichia
coli with acrylate pathway genes for propionic acid synthesis and
its impact on mixed-acid fermentation. Appl Microbiol Biotechnol. 2013;97:1191–200.
8. Chu HS, Ahn JH, Yun J, Choi IS, Nam TW, Cho KM. Direct fermentation route for the production of acrylic acid. Metab Eng. 2015;32:23–9. 9. Liu Z, Liu T. Production of acrylic acid and propionic acid by
construct-ing a portion of the 3-hydroxypropionate/4-hydroxybutyrate cycle from
Metallosphaera sedula in Escherichia coli. J Ind Microbiol Biotechnol.
2016;43:1659–70.
10. Cheng F, Tang XL, Kardashliev T. Transcription factor-based biosensors in high-throughput screening: advances and applications. Biotechnol J. 2018;13:e1700648.
11. Binder S, Schendzielorz G, Stabler N, Krumbach K, Hoffmann K, Bott M, Eggeling L. A high-throughput approach to identify genomic variants of bacterial metabolite producers at the single-cell level. Genome Biol. 2012;13:R40.
12. Dietrich JA, Shis DL, Alikhani A, Keasling JD. Transcription factor-based screens and synthetic selections for microbial small-molecule biosynthe-sis. ACS Synth Biol. 2013;2:47–58.
13. Sana B, Chia KHB, Raghavan SS, Ramalingam B, Nagarajan N, Seayad J, Ghadessy FJ. Development of a genetically programed vanillin-sensing
bacterium for high-throughput screening of lignin-degrading enzyme libraries. Biotechnol Biofuels. 2017;10:32.
14. Rogers JK, Guzman CD, Taylor ND, Raman S, Anderson K, Church GM. Synthetic biosensors for precise gene control and real-time monitoring of metabolites. Nucleic Acids Res. 2015;43:7648–60.
15. Strachan CR, Singh R, VanInsberghe D, Ievdokymenko K, Budwill K, Mohn WW, Eltis LD, Hallam SJ. Metagenomic scaffolds enable combinatorial lignin transformation. Proc Natl Acad Sci U S A. 2014;111:10143–8. 16. Yu H, Wang N, Huo W, Zhang Y, Zhang W, Yang Y, Chen Z, Huo YX.
Estab-lishment of BmoR-based biosensor to screen isobutanol overproducer. Microb Cell Fact. 2019;18:30.
17. Siau JW, Chee S, Makhija H, Wai CM, Chandra SH, Peter S, Droge P, Ghadessy FJ. Directed evolution of lambda integrase activity and specific-ity by genetic derepression. Protein Eng Des Sel. 2015;28:211–20. 18. Thakur N, Kumar V, Sharma NK, Thakur S, Bhalla TC. Aliphatic amidase
of Rhodococcus rhodochrous PA-34: purification, characterization and application in synthesis of acrylic acid. Protein Pept Lett. 2016;23:152–8. 19. Makhongela HS, Glowacka AE, Agarkar VB, Sewell BT, Weber B, Cameron
RA, Cowan DA, Burton SG. A novel thermostable nitrilase superfamily amidase from Geobacillus pallidus showing acyl transfer activity. Appl Microbiol Biotechnol. 2007;75:801–11.
20. Weber BW, Kimani SW, Varsani A, Cowan DA, Hunter R, Venter GA, Gumbart JC, Sewell BT. The mechanism of the amidases: mutating the glutamate adjacent to the catalytic triad inactivates the enzyme due to substrate mispositioning. J Biol Chem. 2013;288:28514–23.
21. Spadiut O, Olsson L, Brumer H 3rd. A comparative summary of expression systems for the recombinant production of galactose oxidase. Microb Cell Fact. 2010;9:68.
22. Athey J, Alexaki A, Osipova E, Rostovtsev A, Santana-Quintero LV, Katneni U, Simonyan V, Kimchi-Sarfaty C. A new and updated resource for codon usage tables. BMC Bioinform. 2017;18:391.
23. Ghadessy FJ, Ong JL, Holliger P. Directed evolution of polymerase func-tion by compartmentalized self-replicafunc-tion. Proc Natl Acad Sci USA. 2001;98:4552–7.
24. Porter JL, Rusli RA, Ollis DL. Directed evolution of enzymes for industrial biocatalysis. ChemBioChem. 2016;17:197–203.
25. Lee J, Hiibel SR, Reardon KF, Wood TK. Identification of stress-related pro-teins in Escherichia coli using the pollutant cis-dichloroethylene. J Appl Microbiol. 2010;108:2088–102.
26. Maurer LM, Yohannes E, Bondurant SS, Radmacher M, Slonczewski JL. pH regulates genes for flagellar motility, catabolism, and oxidative stress in
Escherichia coli K-12. J Bacteriol. 2005;187:304–19.
27. Kannan G, Wilks JC, Fitzgerald DM, Jones BD, Bondurant SS, Slonczewski JL. Rapid acid treatment of Escherichia coli: transcriptomic response and recovery. BMC Microbiol. 2008;8:37.
28. Agarkar VB, Kimani SW, Cowan DA, Sayed MF, Sewell BT. The quaternary structure of the amidase from Geobacillus pallidus RAPc8 is revealed by its crystal packing. Acta Crystallogr, Sect F: Struct Biol Cryst Commun. 2006;62:1174–8.
29. DeLano WL. The PyMOL molecular graphics system. San Carlos: DeLano Scientific; 2002.
30. Trapnell C, Williams BA, Pertea G, Mortazavi A, Kwan G, van Baren MJ, Salzberg SL, Wold BJ, Pachter L. Transcript assembly and quantification by RNA-Seq reveals unannotated transcripts and isoform switching during cell differentiation. Nat Biotechnol. 2010;28:511–5.
31. Tusher VG, Tibshirani R, Chu G. Significance analysis of microarrays applied to the ionizing radiation response. Proc Natl Acad Sci USA. 2001;98:5116–21.
Publisher’s Note
Springer Nature remains neutral with regard to jurisdictional claims in pub-lished maps and institutional affiliations.