HAL Id: hal-02930197
https://hal.archives-ouvertes.fr/hal-02930197
Submitted on 6 May 2021
HAL is a multi-disciplinary open access
archive for the deposit and dissemination of
sci-entific research documents, whether they are
pub-lished or not. The documents may come from
teaching and research institutions in France or
abroad, or from public or private research centers.
L’archive ouverte pluridisciplinaire HAL, est
destinée au dépôt et à la diffusion de documents
scientifiques de niveau recherche, publiés ou non,
émanant des établissements d’enseignement et de
recherche français ou étrangers, des laboratoires
publics ou privés.
Setting a new basis for improving both durability and
environmental performance
Anne Ventura, Van-Loc Ta, Tristan Senga Kiessé, Stéphanie Bonnet
To cite this version:
Anne Ventura, Van-Loc Ta, Tristan Senga Kiessé, Stéphanie Bonnet. Setting a new basis for improving
both durability and environmental performance. Journal of Industrial Ecology, Wiley, 2020, 25 (1),
pp. 233-247. �10.1111/jiec.13059�. �hal-02930197�
Setting a new basis for improving both durability and environmental performance
Anne Ventura
1,2Van-Loc Ta
1Tristan Senga Kiessé
1,3Stéphanie Bonnet
41Chaire génie civil écoconstruction, GeM,
Institut de Recherche en Génie civil et Mécanique, University of Nantes, Saint-Nazaire, France
2MAST/GPEM Campus of Nantes, University
Gustave Eiffel, cedex, France
3UMR SAS Agrocampus Ouest, INRAE,
Rennes, France
4GeM, Institut de Recherche en Génie civil et
Mécanique, University of Nantes, Saint-Nazaire, France
Correspondence
Anne Ventura, MAST/GPEM Campus of Nantes, University Gustave Eiffel, Route de Bouaye CS5004, Bouguenais cedex, 44344, France.
Email:[email protected]
Funding information
Funds for the research and education chair of civil engineering and eco-construction were provided by the Chamber of Trade and Industry of Nantes and Saint-Nazaire cities, the CARENE (urban agglomeration of Saint-Nazaire), Charier, Architectes Ingénieurs Associés, Vinci construction, the Regional Federation of Buildings, and the Regional Federation of Public Works. Donators were not involved in the research design, the writing, and the decision to submit this article. The authors would like to thank them all for their financial support.
Abstract
CO
2emissions from cement production currently represent around 6% of global CO
2emissions. However, cement concrete absorbs CO
2from the atmosphere because of
carbonation (i.e., penetration of atmospheric CO
2inside bulk concrete). Carbonation
has beneficial effects on the mechanical resistance of cement concrete. However,
car-bonation also has adverse effects because it provokes a decrease in pH that favors later
corrosion of reinforcing bars and thus reduces service life. Current European standards
provide recommendations concerning reinforcing concrete covers, but these are not
based on actual service-life durations. Thanks to a previously developed carbonation
model combined with sensitivity analysis and LCA, we compare Climate Change
indi-cators of 1 m
2of reinforced concrete cover over a 100-years service life exposed to
XC4 conditions in Madrid, obtained on one hand by using current standards and on
the other hand with concrete-cover depths calculated with our carbonation model.
Our results show that cement strength class is a key parameter to both increase
dura-bility and decrease climate-change impacts. When the carbonation model is used to
optimize both durability and climate-change impacts, it drives to considerable and
sig-nificant improvements. Finally, climate-change indicators predicted from our
carbon-ation model are not linearly linked to carbon intensity of cements, which is a current
argument of so-called “green cements.” The values of indicators presented in this
arti-cle cannot be generalized: They mainly depend on the geographical location. However,
the model and key action levers are general. Using high cement strength classes and
low water-to-cement ratios allows use of lower concrete-cover depths and thus save
amounts of concrete compared to the standard. This generates an important benefit
in terms of climate-change impacts for identical service lives and improved mechanical
resistance. Thus, considering the huge impact of cement and construction industry on
climate change, we plead for a revision of standards which, instead of thresholds based
on simplified models, should provide certified tools enabling the best design for every
situation. This article met the requirements for a gold/gold JIE data openness badge
described at http://jie.click/badges.
K E Y W O R D S
carbon capture, carbonation, durability, life cycle assessment (LCA), service life, sustainability design
1
INTRODUCTION
In 2016, about 4,200 million metrictons of cement were produced worldwide (Wang,2017). Most of the cement is used to produce cement con-crete for construction. Worldwide, CO2emissions issued from cement production ranged between 0.6 and 1.45 giga metric tons CO2in 2016 (Andrew,2018; Le Quéré et al.,2016), out of 9.88 giga metric tons in total (Le Quéré et al.,2016), that is around 6% of anthropogenic global CO2.
However, cement concrete is also known to absorb CO2from the atmosphere during its service life due to the carbonation (Pade & Guimaraes, 2007; Yang, Seo, & Tae,2014). Carbonation occurs by penetration of atmospheric CO2inside bulk concrete that reacts with chemical components of the cement mortar. Carbonation has beneficial effects on the mechanical resistance of cement concrete because it reduces the size of pores (Papadakis, Vayenas, & Fardis,1989) and previous studies showed it could reduce significantly impacts of cement concrete’s life cycle on climate change (Pade & Guimaraes,2007).
However, carbonation also has adverse effects: it alters the durability of reinforced concrete. As schemed in Figure S4-1 in Supporting Informa-tion S4, carbonaInforma-tion results in a drop of pH between the surface (exposed to atmosphere) and a carbonaInforma-tion front, called x. The latter progresses inside the bulk concrete with time. When the carbonation front reaches the embedded steel at the concrete cover depth d, steel is exposed to an increase of acidity and corrodes. The length of time before corrosion starts is called incubation time. When steel frame is submitted to corrosion, most current maintenance operations consist in removing the carbonated concrete and replacing it by a new one (CEN,2009), thus inducing new greenhouse gas emissions.
In that context, beneficial and adverse effects of carbonation have to be considered for both environmental and durability life cycle assessment of cement concrete.
Today, European standards are based on the definition of an exposure class and subsequent prescriptions including (a) concrete composition (a maximum water-to-cement ratio W∕C, a minimum cement content C); (b) a minimum 28-day compressive strength of the concrete; and (c) a minimum concrete cover depth d for service life design (CEN,2005). The requirements for concrete mix design and concrete cover depth of standard EN 206-1 and Eurocode 2 for XC4 exposure class (i.e., carbonation induced corrosion), and corresponding to a 100-years-service-life design, are given in Table S4-1 in Supporting Information S4. The standard-based approach is a regulatory approach: the 100-years service life are a minimum lifetime that is certified if conditions required by the standards shown in Table S4-1 in Supporting Information S4 are respected. This means that the 100-years service life are not calculated, they are guaranteed, which implies that different cement concrete mix design in the same exposure class can have different actual durations of service lives. In summary, basing the duration of the service lifetime on an identical exposure class as defined in the European standards does not reflect actual service life. In the case of cement concrete roads, maintenance operations are scheduled on the standard basis and may not consider the actual alteration of concrete. For buildings, actual service life is generally estimated at 50 years independently from concrete alteration, but mainly resulting from other aspects such as standard evolution, changes in real estate market, urban planning policies (Augiseau,2017), etc. Thus, using standards will lead to production of oversized structures that exceed the guaranteed service life, generating unnecessary environmental impacts.
On the other hand, a performance-based approach requires calculating duration of service life using a predictive carbonation model based on physicochemical alteration mechanisms according to various mix designs and concrete cover depths. In addition to the prediction of actual duration of service life, the predictive model allows calculating absorbed CO2from the atmosphere that can be included in the calculation of the climate change impact indicator. Although both standard (CEN,2017) and our performance-based methods allow calculating absorbed CO2by carbonation during service life, models are different.
In this paper, we propose to compare climate change impacts of a reinforced concrete cover calculated using the current standard-based method to those calculated using a performance-based method using a previously developed carbonation model (Ta, Bonnet, Senga Kiessé, & Ventura,2016). Our results include CO2absorption during service life and we want to quantify its influence on the LCA results. We use our carbonation model to provide an average generic scenario and then we apply a sensitivity analysis (SA) to generate an optimized scenario, based on the identification of action levers enabling to both maximize service life and minimize environmental impacts. We compare vari-ous design solutions of cement concretes (varying mix designs and cover depths) with for a 100-years predicted service life in worst expo-sure conditions (i.e., concrete is in open space and the structure is not sheltered from rain) corresponding to XC4 class in EN 206-1 (CEN, 2005).
The method section details the studied scenarios, the carbonation model, the LCA model and the sensitivity analysis used to generate the opti-mized scenario. Then results about environmental impacts of the three scenarios are analyzed. Finally, we underline main limits of the performance-based method and discuss of our results in terms of decision that could be taken by an engineering designer using both methods.
2
METHOD
2.1
Goal and scope, functional unit
Comparison of environmental performance with LCA of cement concretes requires defining a functional unit (FU) as described in ISO 14040 stan-dard (CEN and ISO,2006). Many comparative LCA studies have been carried out at different structural levels such as material (i.e., different kinds of concrete) (Brocklesby & Davison,2000; Park, Tae, & Kim,2012; Struble & Godfrey,2004), structural elements (Collings,2006; Edvardsen & Tollose, 2001; Guggemos & Horvath,2005) and complete structures like bridges (Habert, d’Espinose de Lacaillerie, & Roussel,2011; Hammervold, Reenaas, & Brattebø,2013; Park et al.,2012). These LCA studies focus on the material extraction and production (i.e., cradle to gate systems). The use of one cubic meter of ready-mixed concrete has commonly been chosen as FU in previous studies (Collins,2010; Rouwette,2012; Struble & Godfrey,2004; Tait & Cheung,2016; Weil, Jeske, & Schebek,2006). According to the functionalities of cement concrete, this choice without other specifications is not relevant, because if the mix proportions of cement, sand, gravel, and water change, the mechanical properties of concrete change as well. Other LCA studies (Hong, Ji, & Park,2012; Knoeri, Sanyé-Mengual, & Althaus,2013; Marinković, Radonjanin, Malešev, & Ignjatović,2010; Park et al.,2012; Rouwette,2012; Serres, Braymand, & Feugeas,2016) have added the 28-day compressive strength of concrete in FU description as an additional specification to the one cubic meter of ready-mixed concrete. However, the service life of such compared structures could be very different because it depends on natural alterations like carbonation or exposure to chloride. Finally, some concrete LCA studies (CEN,2005; De Schepper, Van den Heede, Van Driessche, & De Belie,2014; Van de Heede, De Keersmaecker, Elia, Annemie, & De Belie,2017) have added the service life of concrete cover to the one cubic meter of ready-mixed concrete as FU. However, by setting an identical volume as FU, these studies indirectly consider that the service life only depends on the concrete mix and is independent on the concrete cover depth. However, an increase of concrete cover depth results in the increase of service life with a given concrete.
Only one LCA study includes steel corrosion induced by carbonation. Authors define service life as the period of penetration of CO2into the con-crete cover until the carbonation front reaches the reinforced layer (García-Segura, Yepes, & Alcalá,2014). Results are provided for the Reinforced Concrete column during the lifetime of the structure, chosen as a functional unit. The reinforced cement concrete column (3 m high, 30× 30 cm2 cross-section, with a 30 mm concrete cover) divided by its lifetime calculated in years, is chosen as a reference flow (García-Segura et al.,2014). This study is focused on greenhouse gas emissions.
In line with this study (García-Segura et al.,2014), we agree that fair comparison of environmental life cycle performances of cement concrete requires defining a FU including identical durations of service lives of compared solutions. Once corrosion has started, the functions of concrete cover that are to provide mechanical resistance and protect steel frame, are not ensured anymore. Thus, we also assume that the incubation time can be considered as the cement concrete’s service life after which the functionality of cement concrete cover is lost. Thus, our FU is defined as 1 m2 of cement concrete lasting 100 years when exposed to carbonation in XC4 conditions as defined by EN 206-1 standard as chosen by García-Segura et al. (2014).
However, our carbonation model (Ta et al.,2016) is different from both (García-Segura et al.,2014) and the EN 16757 standard (CEN,2017). The carbonation model used by García-Segura et al. (2014) is based on the guidelines provided by Spanish authorities (Ministerio de Fomento,2010), for which CO2capture is calculated using a carbonation rate coefficient (mm/year0.5) experimentally obtained following the EHE code (Ministerio de Fomento,2010). The EN 16757 standard (CEN,2017) calculates absorbed CO2proportionally to the CaO content in cement. None of the methods considers the type of cement nor the cement strength class. Our model considers all parameters influencing carbonation front penetration: the material variables (mix proportion in concrete, type of cement, cement strength class, the curing time, the effect of decreased porosity of concrete due to carbonation and environmental factors [T, RH]), and none experimental process is required.
2.2
Descriptions of compared scenarios
We compare three scenarios, depicted in Figure1.
A first scenario, called “standard,” is obtained from the standard-based approach. For standard-based approach, we calculate environmental impacts respecting concrete cover depth design prescriptions of EN 206-1 (CEN,2004) for XC4 exposure class. We include absorbed CO2during service life using the model available in the EN 16757 standard (CEN,2017).
A second scenario (Figure1), called “average,” is obtained from the calculation of concrete cover depth d, for a 100-years service life using the carbonation model, with all parameters set to their average values. Uncertainties of parameters are propagated on the results according to their probability distribution functions.
To determine the third scenario, called “optimized” scenario (Figure1), we use sensitivity analysis to identify controllable parameters that can maximize service life and minimize climate change impacts. For SA, all parameters of the model are varied, we thus also allow the FU to vary (i.e., service life is not set to 100 years, and variations of both service life and environmental impacts are observed.
F I G U R E 1 Methods used to generate studied scenarios
The results of SA lead to identify action levers for eco-design, that is, controllable parameters that are influent to increase service life and decrease environmental impacts. We obtain our “optimized” scenario, for which all controllable design parameters are set at their most favorable value. Uncertainties are calculated from non-influential and non-controllable parameters of the service life model according to their probability distribution functions. Concrete cover depths and LCA indicators are then calculated.
2.3
Service life model for cement concrete altered by carbonation
The previously published model (Ta et al.,2016) is depicted in Figure S4-2 in Supporting Information S4. This model has been validated using data from the literature on short and long-term natural carbonation exposure conditions (Ta et al.,2016). It considers current design parameters of cement concrete mix design.
Technological and controllable parameters are: cement content (C); water-to-cement ratio (W∕C); sand-to-gravel ratio (S∕G); maximum aggre-gate size (Smax); initial curing period (tc); cement types (CEM) and cement strength class (fcem). Among the technological parameters, CEM and fcem are discrete parameters. They are thus submitted to the choices of the engineering designer, for which we have established a decision diagram (Figure S4-3 in Supporting Information S4).
Contextual and non-controllable parameters are those concerning surrounding conditions (Ta et al.,2016): ambient temperature (T); relative external humidity (RH); carbon dioxide concentration in the air (CO2).
Our model (Figure S4-2 in Supporting Information S4) is based on the analytical solution of Fick’s law (Ta et al.,2016) given by
x = √ 2.DCO2.CO2 a . √ t (1)
where x is the carbonation depth within concrete (m), DCO2is the diffusion coefficient of CO2inside concrete (m
2/s), CO
2is the CO2concentration in the atmosphere (kg/m3), a is the amount of CO
When service life (tser) is defined equal to 100 years, the concrete cover depth (d), can be calculated (i.e., x = d), corresponding to the required concrete thickness ensuring an incubation time of 100 years before corrosion can start (Ta et al.,2016).
d= √ 2.DCO2.CO2 a . √ tser (2)
where d is the concrete cover depth (m) and tseris the duration of service life (s).
The ranges of input parameters of various case studies found in the literature and inside which the model was validated, are given in Table S4-2 in Supporting Information S4. It shows that the model is validated for a maximum natural carbonation period of 30 years. In this article, we assume that the carbonation period can be extrapolated to 100 years as a maximum. This extrapolation cannot actually be justified by literature because obser-vations of carbonation in natural conditions have never been published considering such a long period. However, we assume that, in the absence of drastic changes in surrounding conditions, nothing would be disturbing the physicochemical phenomenon that is described by our model, and thus we assume the model has no particular reason to change on a longer period.
2.4
Life cycle assessment model
For our LCA model, although we consider a time dependent model for carbonation, we use attributional LCA because there are no objectives con-cerning marginal changes nor market evolution.
Our FU is 1 m2of concrete cover surface designed to last 100 years. With standard-based design, d is equal to 0.04 m for cement strength class 32.5 MPa and to 0.035 m for cement strength classes 42.5 and 52.5 MPa, as recommended (Table S4-1 in Supporting Information S4). With performance-based design, concrete cover depth d is calculated to ensure an incubation period (i.e., service life) of 100 years before steel starts to corrode.
Our system conforms with Product Category Rules for Concrete and Concrete elements (CEN, 2014) at the exception that our system does not include the steel bars. Our aim is to compare various concrete cover depths for an identical use, and steel bars are identical. The considered life cycle steps as defined in the standard are A (A1 material extraction and production, A2-A4 transport, A3 manufacturing, and A5 construction) and B1 (usage) but maintenance (B2), repair (B3), replacement (B4), and rehabilitation (B5) are not considered in that period because our cement concrete is designed to last the entirety of the service life. We used a concrete production process inventory from Ecoinvent3.3 cut-off database (ecoinvent,2017) as shown in Figure S4-4 in Supporting Information S4.
We considered 30 possibilities of cements for concrete cover mix design, which are the result of three possible cement strength class (fcem) in association with ten cement types (CEM) as shown in Figure S4-3 in Supporting Information S4. The cement characterizations are given in Table S4-3 in Supporting Information S4. The cement types considered here are the ones available in the Ecoinvent3.3 cut-off database for which Life Cycle Inventories (LCI) have been established for Europe (ecoinvent,2017). They represent average data, for which average cement compositions are assumed.
Details concerning various cement admixtures used for various cement types, especially waste reducing admixtures are included in the LCI data of each cement type (Table S4-4 in Supporting Information S4), although they are not shown in Figure S4-5 in Supporting Information S4. Clinker and CaO contents are necessary to calculate concrete cover depth d in the optimized scenario. These values are provided in Table S4-3 in Supporting Information S4.
The calculation of intermediary flows per FU is detailed in Figure S4-5 in Supporting Information S4. Considering that 1 m3of fresh concrete is the sum of volumes of cement, gravel, sand, water, and entrained air, this can be related to masses of ingredients by dividing each of them by its density. Thus, the following balance equation should be fulfilled (Ta,2017):
C ȷc + G ȷg+ S ȷs+ W ȷw + 𝜙air= 1 (3)
where C is the amount of cement in concrete mix design (kg/m3of concrete), G is the amount of gravel in concrete mix design (kg/m3of concrete),
Sis the amount of sand in concrete mix design (kg/m3of concrete), W is the amount of water in concrete mix design (kg/m3of concrete), ȷ cis the cement density (kg/m3), ȷ
gis the gravel density (kg/m3), ȷsis the sand density (kg/m3), ȷwis the water density (kg/m3), and𝜙airis the volume fraction of entrained air into the concrete mix (adimensional).
The𝜙airis determined from the S_max (Figure S4-2 in Supporting Information S4). The terms G, S, and W are expressed according to C, W∕C, S∕G, and S_max. The cement density𝜌cdepends on cement type as given in Table S4-3 in Supporting Information S4.
The environmental impact indicators are calculated following the ILCD recommendations (European Commission et al.2013). The mass of carbon dioxide CO2 abs, absorbed during the 100-year service life is calculated using the following equation (Ta,2017):
CO2 abs= d. s. a (4)
where CO2 absis the amount of CO2absorbed into concrete (kg) and s is the external surface of cement concrete exposed to air (m2).
The value of a that is the CO2absorbed per 1 m3of concrete, is calculated by the published model (Ta et al.,2016) as detailed previously in Figure S4-2 in Supporting Information S4.
2.5
Sensitivity analysis
The SA is briefly described in that paper but is fully detailed in previous works (Andrianandraina, Senga Kiessé, Cazacliu, Idir, & van der Werf,2015; Senga Kiessé et al.,2017).
2.5.1
General principles
A combination of Morris’ qualitative Sensitivity Analysis (SA) methods (Morris,1991) and Sobol’s quantitative (Sobol,2001) is conducted succes-sively.
At first step, Morris’ method (Morris,1991) consists in randomizing experimental design process by varying one parameter while keeping the others constant over a certain number of repetitions (Ta, Senga Kiesse, Bonnet, & Ventura,2018). Each variation provides a result called elementary effect. Then, Morris indices are calculated form the results of all elementary effects: the mean value (𝜇j) of the elementary effects, the mean value of the absolute value (𝜇∗
j) of the elementary effects as well as the standard deviation value (𝜎j) of the elementary effects. The Morris indices are calculated by means of discretization of the input parameters in 10 values with a prescribed number of trajectories of about 30 (Ta et al.,2018).
At second step, Sobol’s method (Sobol,2001) is based on the analysis of the variance decomposition of the model in order to quantify the input parameters contribution to variations of service life and environmental impacts. It quantifies the influence of each input variable Xjon each output variable (either service life or environmental impact). On each studied output, Sobol’s method calculates three types of indices (Ta et al.,2018): the total variance of the output ST induced by the variation of all input parameters, the total variance of the output STjinduced by the variation of one parameter Xjin interaction with all other parameters, and the first order variance of the output S1
j induced by the variation of one parameter
Xjvaried alone. These calculations are conducted using Monte Carlo simulations, varying simultaneously all input parameters according to their Probability Distribution Function (PdF) and calculating the associated model output parameters (Ta et al.,2018). The Sobol indices are calculated by means of a bootstrap method with 500 replications from a half-sample (5,000) taken from an initial sample of about 10,000 (Ta et al.,2018).
2.5.2
Identification of action levers
A high value of Morris indices (𝜇∗
j) indicates that the parameter Xjhas higher influence on the considered output. Comparison of𝜇∗j with other indices provides additional information. First, if𝜎jis high compared to𝜇∗j (𝜎j> 0.2 × 𝜇j∗) it means that Xjhas important interactions with other parameters or that its influence is non-monotonic. Second, if𝜇j∗and𝜇jhave the same algebraic sign (𝜇j∗× 𝜇j> 0) the studied parameter is an increas-ing function of Xj, that is, an increase of parameter Xjwill result in an increase of the studied output. On the contrary if𝜇∗
j and𝜇jdo not have the same algebraic sign (𝜇∗
j × 𝜇j< 0) the studied parameter is a decreasing function of Xj, that is, an increase of parameter Xjwill result in a decrease of the studied output. Finally, parameters are considered as non-influential if they have no interaction (𝜎j≪ 𝜇j∗) and𝜇∗j is low. These parameters are not varied in the second step of the Sobol method, in order to minimize calculation costs (Andrianandraina et al.,2015; Senga Kiessé et al.,2017).
Based on Sobol indices, the technological controllable parameters Xjare assumed to have an individual influence (identified as action levers) if the value of first order index S1
j ≥0.1 × ST (Andrianandraina et al.,2015). However, if the value of first order index is low (S
1
j < 0.1 × ST) but that it is very different from the total variance induced by this parameter (STj− ST1j > 0.1 × STj), then parameter Xjcan also be considered as a potential action lever because this means that Xjis not individually influential but has an important global contribution in interaction with some other parameters (Andrianandraina et al.,2015; Senga Kiessé et al.,2017).
3
RESULTS
Main results are presented in this article, but we invite readers to consult Table S4-8 in Supporting Information S4 to obtain more detailed results (data tables corresponding to graphs), as well as excel files for other indicators than GWP).
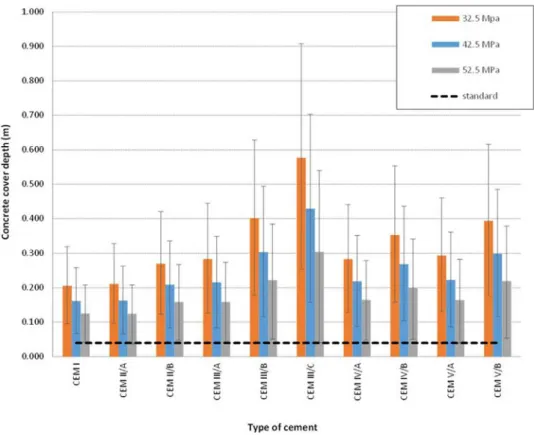
F I G U R E 2 Average scenario: concrete cover depths simulated from carbonation model over 10,000 repetitions for various cement strength classes and types. Underlying data used to create this figure can be found in Supporting Information S1
3.1
Standard scenario
Figure S4-6 in Supporting Information S4 shows results obtained for climate change indicator obtained with a standard scenario, including carbon-ation obtained using the standard (CEN,2017) for the 32.5 MPa cement strength class (d= 0.04 mm). It is clear that the impacts on climate change are largely provoked by cement production. Indeed, for all impact categories, the cement content C, the choice of cement type and the concrete cover depth d are determining choices that will make a difference on the impacts.
The maximum GWP value for the standard method is GWPstandard
max = 18.93 kg CO2eq/m2cover and is obtained for the maximum cement content
C= 504 kg/m3, the CEM I cement type.
The minimum value for the standard method is GWPstandard
min = 5.59 kg CO2eq/m2cover and is obtained for the minimum cement content
C= 280 kg/m3, and CEM III/C cement type.
These values will be represented and detailed for each cement type in the average and optimized scenarios to favor comparison.
However, no uncertainties can be provided on the results because the scenario is based on a regulatory prescription, but not on actual physico-chemical phenomenon.
More precisely, it is interesting to observe relationship between the amount of clinker per FU and the climate change indicator. This is shown in Figure S4-7 in Supporting Information S4: We can observe that climate change indicator is almost linearly related to the amount of clinker.
3.2
Average scenario
Figure2(see corresponding data in Table S4-6 in Supporting Information S4) shows concrete cover depths obtained to reach a 100-years service life using the carbonation model in the average scenario (Table S4-5 in Supporting Information S4), and it is compared to the concrete cover depths from the standard scenario. When all parameters are varied according to their PdFs, uncertainties are found very important, and concrete cover depth are found largely above the standard scenario.
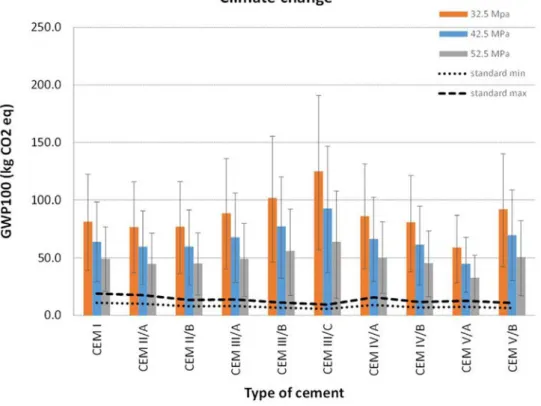
Figure3(see corresponding data in Table S4-7 in Supporting Information S4) shows GWP results of the average scenario. Similarly to concrete cover depths (Figure2), uncertainties are found very important, and concrete cover depth are found largely above the standard scenario.
F I G U R E 3 Average scenario: climate change indicator (incl. adsorbed CO2by concrete carbonation) simulated from combined LCA and carbonation model over 5,000 repetitions for various cement strength classes and types. Underlying data used to create this figure can be found in Supporting Information S1
F I G U R E 4 Sobol and Morris sensitivity indices for service life (i.e. the period of penetration of CO2into the concrete cover until the carbonation front reaches the reinforced layer). Underlying data used to create this figure can be found in Supporting Information S1
3.3
Sensitivity analysis
Figure4(see corresponding data in Table S4-8 in Supporting Information S4) provides results on most influential parameters on service life. These are water-to-cement ratio W∕C, ambient temperature T, relative external humidity RH. Sobol indices show that all influential parameters on service life have interactions with other parameters and/or that their influences are non-monotonic (i.e., STj− ST1
j > 0.1 × STjand𝜎j> 0.2 × 𝜇
∗
j). This is especially the case of relative external humidity RH that has a non-monotonic effect on service life. There is an optimum value of external humidity around 0.6 for which carbonation will be favored, it is visible in the equations of the model (Figure S4-2 in Supporting Information S4) and consistent with the literature (Houst & Wittmann,1994; Papadakis et al.,1989; Salvoldi, Beushausen, & Alexander,2015). At this optimum value, carbonation is favored, and thus service life is minimum. If external humidity is below or above this optimum, carbonation will be less favored, and service life will increase (Papadakis et al.,1989,1991; Salvoldi et al.,2015; Ta et al.,2018; Yang et al.,2014). Ambient temperature T and relative external humidity
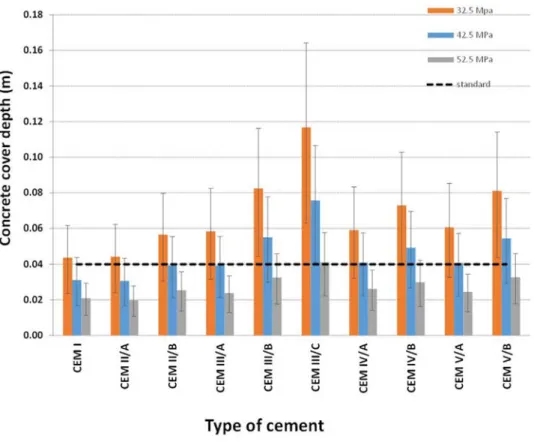
F I G U R E 5 Optimized scenario: concrete cover depths simulated from carbonation model over 10,000 repetitions for various cement strength classes and types. Underlying data used to create this figure can be found in Supporting Information S1
Water-to-cement ratio W∕C is a controllable technological parameter and is thus found as the most important action lever. Based on the algebraic sign of𝜇j, we observe that we have a decreasing function of service life with water-to-cement ratio: that is, a decrease in W∕C will result in an increase of service life. For other controllable technological parameters, we observe increasing functions of service life: an increase of concrete cover depth d, cement content C, initial curing period tc, maximum aggregate size Smax, and sand-to-gravel ratio S∕G result in an increase of service life.
Table S4-8 in Supporting Information S4 provides results for considered impact categories. Concrete cover depth d and cement content C are found the most influential parameters for climate change and almost all other impact categories, with an increasing effect. This is of course consis-tent with what was obtained in Figure S4-6 in Supporting Information S4: the amount of cement is the main contributor, and it is increased by the increase of both parameters. Transport distance Tran is also found influential on many impact categories.
Finally, as a synthesis of results on both service life and environmental impacts, solutions for eco-efficiency can be expected: a minimum W∕C value and a maximum value cement strength class fcemwill increase service life, whereas minimum values of C, d, and Tran values will decrease environmental impacts. In fact, with a performance-based approach, d should be calculated from the targeted service life duration, and thus cannot be a design parameter. In the same manner, transport distance Tran cannot be set at a fixed minimum value, because it is not a known value for a generic approach. At a given and known location, one could recommend that provenance of aggregates should be as local as possible. Finally, only cement content C can be varied, and it should be set at its minimum value. These results lead to define the optimized scenario that is described in Table S4-5 in Supporting Information S4.
3.4
Optimized scenario
Figure5(see corresponding data in Table S4-9 in Supporting Information S4) shows concrete cover depths d obtained to reach a 100-years ser-vice life using the carbonation model in the optimized scenario (Table S4-5 in Supporting Information S4), and it is compared to standard scenario (concrete cover depth d = 0.04 m from the standard). When only surrounding and non-influential parameters of the model are varied according to their PdFs, and that influential controllable parameters are set to their optimized value, uncertainties are found less important than for the average scenario. Furthermore, concrete cover depths are found below the one from the standard scenario for all cement types (only CEM III/C is found equal to the standard min scenario) when using the maximum 52.5 MPa cement strength class. For 42.5 MPa cement strength classes, calculated
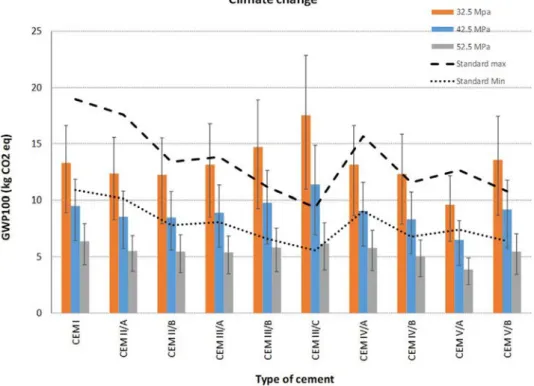
F I G U R E 6 Optimized scenario: climate change indicator (incl. absorbed CO2) simulated from combined LCA and carbonation model over 5,000 repetitions for various cement strength classes and types. Underlying data used to create this figure can be found in Supporting Information S1
concrete depths are higher than the standard scenario, except for CEM I and CEM II/A for which they are below. Finally, all calculated concrete covers depths are found above the standard scenario for the 32.5 MPa cement strength class. These results mean that the standard underestimates concrete cover depths for lower cement strength classes and overestimates them for higher cement strength classes.
The climate change indicator for the optimized scenario is shown in Figure6(see corresponding data in Table S4-10 in Supporting Information S4). It is calculated by using the concrete cover depth previously calculated (Figure5). Compared to values obtained from the minimum standard scenario, concrete mix designs with fcem= 52.5 MPa cement strength class are found to significantly decrease impacts. For concrete mix designs using 42.5 MPa cement strength class, GWPs are found below or above the minimum standard scenario but always below the maximum standard scenario except for CEM III/C.
It is interesting to analyze if the decrease of climate change impact indicator GWP is mostly due to carbon dioxide absorption or to changes in cover concrete depth. The GWP indicator is plotted versus the amount of clinker for the optimized scenario using 52.5 MPa cement strength class in Figure7, as well as for both standard scenario (same as Figure S4-7 in Supporting Information S4). We can observe that for the optimized sce-nario, the amount of clinker is considerably reduced compared to the standard scenario. Reduction of GWP induced by carbonation (black triangles compared to red diamonds in Figure7) is small compared to the effect of reducing the amount of clinker thanks to a thinner concrete cover depth.
Figure S4-8 in Supporting Information S4 is zooming Figure7to focus on the relationship between GWP of optimized scenario and the amount of clinker. Carbonation will globally reduce GWP from 4% for CEM III/C (smallest clinker amount) to 25% for CEM I (highest clinker amount). There is no more linear relationship between GWP and amount of clinker per FU compared to previous analysis concerning standard-based design (Figure S4-7 in Supporting Information S4).
4
DISCUSSION
4.1
Discussion on the method
In this article, we used our carbonation model (Ta et al.,2016) to calculate the concrete cover depth as a particular application corresponding to particular circumstances of usage (XC4 exposure conditions in Madrid), and with the particular aim of reaching a 100-years service life. However, our model can be used in any other conditions. We could use a multicriteria optimization method, finding solutions ensuring minimum environmental impacts and maximum service life in any given geographical situation.
F I G U R E 7 Climate change indicator plotted versus the amount of clinker per FU for standard scenario and optimized scenario using f_cem= 52.5 MPa cement strength class (with details on including or excluding carbon dioxide captured by carbonation). Underlying data used to create this figure can be found in Supporting Information S1
Our model does not currently include models of maintenance operations that could occur at calculated end of service times at which the con-crete cover is fully carbonated. This additional modeling is probably not relevant for buildings because their demolition rarely occurs for structural reasons, but it could be relevant for bridges for which maximum service life is desired in order to minimize maintenance costs. Furthermore, such a model should include maintenance operations to cure but also to prevent cement concrete from carbonation and could enable to compare most efficient maintenance policies.
Our approach could be improved in accuracy and relevancy. First, our results on environmental impact depend on the available database. Indeed, the ecoinvent 3.3 cut-off database provides inventory data for several types of cements (those specified in Table S4-1 in Supporting Information S4) but does not make the distinction between cement strength classes. However, for an identical type of cement, the composition should be different for different cement strength classes. Detailed LCA inventory data are not yet available for each cement strength class and each cement type. According to a previous study (Eskandari-Naddaf & Kazemi,2017), composition of cement types are quite similar for superior cement strength classes, but fineness is increased. By considering same data whatever the cement strength class, we probably underestimate an additional energy consumption for upper cement strength classes.
Second, our results are linked to the system model of the ecoinvent cut-off database. This system model does not attribute any environmental burdens to waste. Many of these wastes are in fact used as Supplementary Cementitious Materials in CEM II to CEM V types of cements. Changing of system model may change the results, because responsibilities of impacts allocated to Supplementary Cementitious Materials would have them increased as waste valorization, and in the same time, have them decreased considering possible substitution to Portland cement (CEM I). The influence of the system model should be tested in the future.
Furthermore, in this study, carbonation is the only alteration phenomenon of RC structure that is considered. However, concrete carbonation can be coupled with other severe deteriorations leading to accelerate its degradation, for example, cracking or the presence of a small amount of chlorides significantly increases the corrosion risk in carbonated mortars (Glass et al., 1991). This would indeed change our results and further work should concentrate on the combined effects of various alteration mechanisms to be integrated in our model.
Finally, our work does not apply to coated steel, nor to concrete covered with protection layers such as resins. This would be interesting indeed to determine if environmental impacts caused by addition of protective layers or by steel coating would be balanced by a longer concrete service life, and a possible smaller concrete cover than the one recommended by the standard (CEN,2005). Indeed, the standard (CEN,2005) allows using smaller covers when using coated steel or protection layers. This could be possible and would require to develop specific models able to calculate penetration kinetics of CO2through protective layers. This is the purpose for future work.
Our work does not focus on cost, but it would be interesting to compare service life costs. Indeed, a high cement strength class will increase costs due to cement, whereas a low cement strength class will increase concrete cover depth thus costs due to cement, sand, and gravels.
F I G U R E 8 GWP of standard and optimized scenarios as a function of cement carbon intensity. Underlying data used to create this figure can be found in Supporting Information S1
4.2
Discussion of the results
The model that we previously developed (Ta et al.,2016) improves knowledge and prediction of carbonation because, compared to the standard (CEN,2005), it integrates cement strength classes and cement types, and is able to provide uncertainties of results. We combined this model with LCA with the aim of both integrating the use phase in the life cycle assessment, and minimizing climate change impacts. Our results show that this model is not relevant as a method to provide generic values valid for in any situations. Indeed, our results show for the average scenario, that uncertainties are important for both concrete cover depth and environmental impact indicators when PdFs of all parameters are varied according to the validation limits of the model. The relevant use of this model is to provide best design options in each specific situation.
This is what is obtained in the optimized scenario, for which we use our model to find the suitable concrete cover depth to an adjusted service life performance. Because controllable parameters are set to their most favorable value, we considerably reduce uncertainties and outline bet-ter solutions than standard-based design (standard scenario). Results of our case study depend on the location. Surrounding conditions in Madrid favor carbonation, with relative exterior humidity that favors this type of concrete alteration. In another city, with higher or lower average relative external humidity; carbonation would be slower than in Madrid. Thus, concrete cover depth would probably be found thinner, and absorbed carbon dioxide would be lower. However, our model is general and can be adapted to calculate optimized service life design and environmental impacts for various situations by adapting values and PdFs of contextual parameters to local surrounding conditions parameters (Table S4-5 in Supporting Information S4).
In a current practice, engineering designers use cement carbon intensity information to guide their decision if they want to decrease climate change impacts of concrete structures. With that information, they would tend to choose CEMIII/C as the lowest carbon intensity cement (Table S4-3 in Supporting Information S4). In Figure8(see corresponding data in Table S4-12 in Supporting Information S4) we provide GWP results for standards and optimized scenarios as a function of carbon intensities for each type of cement. For low carbon intensities, uncertainties provided for the optimized scenario show that they are not significantly different from the standard min scenario. However, for high carbon intensities, we can see that when the standard generates higher GWPs with a proportionality to carbon intensity, the optimized scenario shows that results are significantly lower than the standard, and that there no linear relationship between GWP and carbon intensity.
It is noticeable that cement content C and water to cement ratio W∕C are set at a fixed value for the optimized scenario. As both values are linked, this leads to a fixed value of water content: W = 126 kg/m3. In practical situations, the water content is difficult to set by cement concrete
producers, because some water can be contained in aggregates, but is generally unknown and difficult to measure. Cement concrete producers usually target a certain amount of water, and readjust during the mixing, adding water if W has been underestimated, or adding cement if W has been overestimated (Cazacliu & Ventura,2010). Better monitoring water content of aggregates in cement concrete plant is thus a key point to environmental and durability performance of concrete (Cazacliu & Ventura,2010). In the absence of such a control, our approach should lead to target a maximum W∕C for a minimum of cement C.
In this article, we have focused on service life duration as the main function of cement concrete. However, mechanical resistance of cement concrete is also an important function. We have calculated mechanical resistances for both minimum and maximum cement content according to the model presented in Figure S4-2 in Supporting Information S4 (see results in Table S4-13 in Supporting Information S4). For minimum cement content and maximum cement strength class, as recommended in the optimum scenario, mechanical resistances range from 59.7 to 69.3 MPa according to the type of cement. Increasing the cement content will increase the mechanical resistance; however it could only be used if a mechanical resistance superior to 69.3 MPa is required. Thus, for a given calculated service life and minimal environmental impacts, it appears preferable to increase cement strength class than cement content if one wants to reach high resistances.
Environmental impacts found in this paper also depend on the location. The influence of the electricity mix is one aspect related to location, but of fewer importance on the results. Indeed, the only process located in the studied country is the concrete production plant, that is not an important contributor on environmental impacts compared to cement production (Figure S4-6 in Supporting Information S4). All other processes of the system cover a geographical area that is either global or European with the corresponding mixes (Figure S4-5 in Supporting Information S4) and they would not change when changing the country. However, surrounding conditions, that is, climate variations, would change the duration of service life. The climate of Madrid being chosen as one favoring carbonation, changing the country would likely increase service life.
End of life is not considered in our approach. Today’s practices of deconstruction and recycling are not different according to the types of cement, so if additional impacts in the life cycle can surely be expected by including the end of life stage, we do not expect that it would change the result for the optimized solution.
5
CONCLUSION
Our work shows that current standards often misestimate concrete cover depths according to the type of cement and their strength classes. Our carbonation model is useful in determining actual behavior of concrete covers with respect to carbonation. It cannot be used to provide generic concrete cover depths whatever the local situation, but it proves useful when it is used as a performance-based approach. Indeed, if our model is applied locally with the aim of finding the best solution to both maximize service life and minimize climate change impacts, it provides important improvements.
It is known that the amount of cement is majorly responsible for greenhouse gas emissions of a cement concrete, however, we show that using a higher cement strength class and a minimum value of water-to-cement ratio are key action levers to decrease the concrete cover thickness, improve mechanical resistance, and considerably reduce climate change impacts on the life cycle. Influence of concrete carbonation on the reduction of climate change indicator is not the major phenomenon: it ranges from 4% to 25% according to the type of cement. Although values of climate change indicator (GWP100) found in that article are specific to Madrid climate and a 100-years service life, these identified key action levers are generalizable.
Our results also show that basing the concrete design on cement’s carbon intensity to decrease climate change impact is not relevant. The stan-dards used to calculate absorbed carbon dioxide only rely upon cements’ clinker content (CaO precisely). Thus, according to the standardized approach, improvements are linearly related to the cement’s carbon intensity. Our model shows that it is not the case, because it also accounts for the decrease of porosity due to the use of a higher cement strength class.
Considering the huge impact of cement and construction industry on climate change, we plead for a revision of standards that, instead of thresh-olds based on simplified models, should provide certified tools enabling to calculate the best cement concrete design for every situation.
In forthcoming research, our method should be augmented to account for other alteration mechanisms such as chloride exposure, sulfate attacks, or cracking. It should integrate two-dimensional alteration models in order to better reflect localized effects and be able to extend the approach to a whole engineering structure.
C O N F L I C T O F I N T E R E S T
The authors declare no conflict of interest.
AC K N O W L E D G M E N T S
O RC I D
Anne Ventura https://orcid.org/0000-0001-5657-4677
Tristan Senga Kiessé https://orcid.org/0000-0003-2710-5825
Stéphanie Bonnet https://orcid.org/0000-0003-0027-344X
R E F E R E N C E S
Andrew, R. M. (2018). Global CO2emissions from cement production: 23.
Andrianandraina Ventura, A, Senga Kiessé, T., Cazacliu, B., Idir, R., & van der Werf, H. M. G. (2015). Sensitivity analysis of environmental process modeling in a life cycle context: A case study of hemp crop production: Environmental process modeling in a life cycle context. Journal of Industrial Ecology, 19(6), 978–993.
Augiseau, V. (2017). La dimension matérielle de l’urbanisation. Flux et stocks de matériaux de construction en Ile-de-France. Retrieved fromhttp://www.theses.fr/ s134800
Brocklesby, M. W., & Davison, J. B. (2000). The environmental impacts of concrete design, procurement and on-site use in structures. Construction and Building
Materials, 14(4), 179–188.
Cazacliu, B., & Ventura, A. (2010). Technical and environmental effects of concrete production: Dry batch versus central mixed plant. Journal of Cleaner
Pro-duction, 18(13), 1320–1327.
CEN. (2004, April). EN 206-1 Concrete - Part 1: Specification, performances, production and conformity.
CEN. (2005). EN 1992-1-1 Eurocode 2 - Design of concrete structure - Part 1.1 General rules and rules for buildings. European Standard Organization. Retrieved fromhttps://www.phd.eng.br/wp-content/uploads/2015/12/en.1992.1.1.2004.pdf
CEN. (2009). EN 1504-9:2008 - Products and systems for the protection and repair of concrete structures. Definitions, requirements, quality control and evaluation of
conformity. General principles for use of products and systems. European Standard Organization.
CEN. (2014). EN15804:A1 - Sustainability of construction works - Environmental product declarations - Core rules for the product category of construction products, European Committee for Standardization, April 26.
CEN. (2017). EN 16757 - Sustainability of construction works - Environmental product declarations - Product category rules for concrete and concrete
ele-ments. Retrieved from https://www.boutique.afnor.org/norme/nf-en-16757/contribution-des-ouvrages-de-construction-au-developpement-durable-declarations-environnementales-sur-les-produits-regles-re/article/866871/fa186466
CEN and ISO. (2006). ISO 14040:2006, Environmental management - Life cycle assessment - Principles and framework. International Standard Organization. Retrieved fromhttps://www.iso.org/obp/ui/#iso:sTd:iSo:14040:eD-2:v1:en
Collings, D. (2006). An environmental comparison of bridge forms. Proceedings of the Institution of Civil Engineers - Bridge Engineering, 159(4), 163–168. Collins, F. (2010). Inclusion of carbonation during the life cycle of built and recycled concrete: Influence on their carbon footprint. The International Journal of
Life Cycle Assessment, 15(6), 549–556.
De Schepper, M., Van den Heede, P., Van Driessche, I., & De Belie, N. (2014). Life cycle assessment of completely recyclable concrete. Materials (Basel,
Switzer-land), 7(8), 6010–6027.
ecoinvent. (2017). ecoinvent database. Retrieved fromhttps://www.ecoinvent.org/
Edvardsen, C., & Tollose, K. (2001). Environmentally green concrete structures. In A. Christensen (Ed.), Concrete and environment (Vol. 9). Berlin, Germany: Pearson.
Eskandari-Naddaf, H., & Kazemi, R. (2017). ANN prediction of cement mortar compressive strength, influence of cement strength class. Construction and
Building Materials, 138, 1–11.
European Commission, Joint Research Center, and Institute for Environment and Sustainability. (2013). Characterisation factors of the ILCD recommended life
cycle impact assessment methods - Database and supporting information. Vol. JRC68250 EUR25167EN. ELCD Technical note. Luxembourg. Retrieved from
http://eplca.jrc.ec.europa.eu/uploads/LCIA-characterization-factors-of-the-ILCD.pdf
García-Segura, T., Yepes, V., & Alcalá, J. (2014). Life cycle greenhouse gas emissions of blended cement concrete including carbonation and durability. The
International Journal of Life Cycle Assessment, 19(1), 3–12.
Glass, G. K., Page, C. L., & Short, N. R. (1991). Factors affecting the corrosion rate of steel in carbonated mortars. Corrosion Science, 32(12), 1283–1294. Guggemos, A. A., & Horvath, A. (2005). Comparison of environmental effects of steel- and concrete-framed buildings. Journal of Infrastructure Systems, 11(2),
93–101.
Habert, G., d’Espinose de Lacaillerie, J. B., & Roussel, N. (2011). An environmental evaluation of geopolymer based concrete production: Reviewing current research trends. Journal of Cleaner Production, 19(11), 1229–1238.
Hammervold, J., Reenaas, M., & Brattebø, H. (2013). Environmental life cycle assessment of bridges. Journal of Bridge Engineering, 18(2), 153–161.
Hong, T., Ji, C., & Park, H. (2012). Integrated model for assessing the cost and CO2emission (IMACC) for sustainable structural design in ready-mix concrete.
Journal of Environmental Management, 103, 1–8.
Houst, Y. F., & Wittmann, F. H. (1994). Influence of porosity and water content on the diffusivity of CO2and O2through hydrated cement paste. Cement and
Concrete Research, 24(6), 1165–1176.
Knoeri, C., Sanyé-Mengual, E., & Althaus, H.-J. (2013). Comparative LCA of recycled and conventional concrete for structural applications. The International
Journal of Life Cycle Assessment, 18(5), 909–918.
Le Quéré, C., Andrew, R. M., Canadell, J. G., Sitch, S., Korsbakken, J. I., Peters, G. P., . . . Zaehle, S. (2016). Global carbon budget 2016. Earth System Science Data,
8(2), 605–649.
Marinković, S., Radonjanin, V., Malešev, M., & Ignjatović, I. (2010). Comparative environmental assessment of natural and recycled aggregate concrete. Waste
Management, 30(11), 2255–2264.
Ministerio de Fomento. (2010). EHE-08 Code on structural concrete. Retrieved fromhttps://www.fomento.gob.es/MFOM.CP.Web/handlers/pdfhandler.ashx? idpub=BNW001
Morris, M. D. (1991). Factorial sampling plans for preliminary computational experiments. Technometrics, 33(2), 161–174.
Papadakis, V. G., Vayenas, C. G., & Fardis, M. N. (1989). A reaction engineering approach to the problem of concrete carbonation. AIChE Journal, 35(10), 1639– 1650.
Papadakis, V. G., Vayenas, C. G., & Fardis, M. N. (1991). Physical and chemical characteristics affecting the durability of concrete. Materials Journal, 88(2), 186–196.
Park, J., Tae, S., & Kim, T. (2012). Life cycle CO2assessment of concrete by compressive strength on construction site in Korea. Renewable and Sustainable
Energy Reviews, 16(5), 2940–2946.
Rouwette, R. (2012). LCA of geopolymer concrete (E-CRETE). Victoria, Australia: Aurora Construction Materials.
Salvoldi, B. G., Beushausen, H., & Alexander, M. G. (2015). Oxygen permeability of concrete and its relation to carbonation. Construction and Building Materials,
85, 30–37.
Senga Kiessé, T., Ventura, A., van der Werf, H. M. G., Cazacliu, B., Idir, R., & Andrianandraina (2017). Introducing economic actors and their possibilities for action in LCA using sensitivity analysis: Application to hemp-based insulation products for building applications. Journal of Cleaner Production, 142(4), 3905–3916.
Serres, N., Braymand, S., & Feugeas, F. (2016). Environmental evaluation of concrete made from recycled concrete aggregate implementing life cycle assess-ment. Journal of Building Engineering, 5, 24–33.
Sobol, I. M. (2001). Global sensitivity indices for nonlinear mathematical models and their Monte Carlo estimates. Mathematics and Computers in Simulation,
55(1–3), 271–280.
Struble, L., & Godfrey, J. (2004). How sustainable is concrete? Paper presented at International Workshop on Sustainable Development and Concrete Technology of Iowa State University, Beijing, China.
Ta, V. L. (2017). Méthode innovante pour la conception environnementale et durable de structures en béton armé soumis à la carbonatation. IUT Saint-Nazaire: Uni-versité de Nantes. Retrieved fromhttp://www.theses.fr/s130555
Ta, V. L., Bonnet, S., Senga Kiessé, T., & Ventura, A. (2016). A new meta-model to calculate carbonation front depth within concrete structures. Construction
and Building Materials, 129, 172–181.
Ta, V. L., Senga Kiesse, T., Bonnet, S., & Ventura, A. (2018). Application of sensitivity analysis in the life cycle design for the durability of reinforced concrete structures in the case of XC4 exposure class. Cement and Concrete Composites, 87, 53–62.
Tait, M. W., & Cheung, W. M. (2016). A comparative cradle-to-gate life cycle assessment of three concrete mix designs. The International Journal of Life Cycle
Assessment, 21(6), 847–860.
Van de Heede, P., De Keersmaecker, M., Elia, A., Annemie, A., & De Belie, N. (2017). Service life and global warming potential of chloride exposed concrete with high volumes of fly ash. Cement and Concrete Composites, 80, 210–223.
Wang, T. (2017). U.S. and world cement production 2017 | Statistic. Statista. Retrieved from https://www.statista.com/statistics/219343/cement-production-worldwide/
Weil, M., Jeske, U., & Schebek, L. (2006). Closed-loop recycling of construction and demolition waste in Germany in view of stricter environmental threshold values. Waste Management & Research, 24(3), 197–206.