Science Arts & Métiers (SAM)
is an open access repository that collects the work of Arts et Métiers Institute of
Technology researchers and makes it freely available over the web where possible.
This is an author-deposited version published in: https://sam.ensam.eu Handle ID: .http://hdl.handle.net/10985/11395
To cite this version :
Anthony SURLERAUX, Romain LEPERT, Jean-Philippe PERNOT, Samuel BIGOT - Computer-aided Micro-EDM die-sinking tool design optimisation - Journal of Innovation Impact - Vol. 8, n°2, p.552-571 - 2015
Any correspondence concerning this service should be sent to the repository Administrator : archiveouverte@ensam.eu
Computer-aided Micro-EDM die-sinking tool design
optimisation
Anthony Surleraux1, Romain Lepert 2, Jean Phillipe Pernot 2, Samuel Bigot1 1Cardiff University, Cardiff, CF24 3AA, UK
BigotS@Cardiff.ac.uk
2 Arts et métiers, Aix-en-provence, France
Abstract: This paper describes a new efficient method for computer aided
optimisations of micro EDM die sinking tools, which can be used for design optimisation and performance verification in the digital domain. This would facilitate the integration and re-configurability of the micro EDM die sinking process in high value products manufacturing chains. An EDM simulation tool which makes use of voxels embedded in a voxel octree to represent the geometries is introduced and its application to a new Micro-EDM die-sinking tool shape optimisation is then described. Simulation results obtained with simple shapes are then discussed highlighting the capabilities of the new optimisation method and potential areas of improvement are proposed.
1. Introduction
Micro and nano manufacturing technologies have been recognized as a promising new source of innovation and growth for decades to come [1]. The microelectronics and IT revolution which benefited from such technologies started many decades ago and was built on silicon-based IC technologies. However, capabilities for micro and nano processing on a wider range of materials, including the structuring of true 3D-forms, is becoming increasingly important for the development of innovative new applications. Developing and improving such capabilities to facilitate their integration in the next generation of factories for high value products is crucial and would enable more flexible and cost-effective manufacturing of multifunctional products made of different materials in practically all manufacturing sectors, including biotechnology (e.g. biosensors, micro fluidics) and ICT (e.g. optoelectronics) [2].
A particular issue with the manufacturing of 3D forms at the micro scale is the access to reliable and efficient measurement techniques allowing for appropriate part verification. This, in combination with the relative lack of maturity of some of
these micro manufacturing technologies, makes the design process difficult as assessing the manufacturability of new features is far from straightforward.
At the same time, with the constant improvement in computer graphic visualization and information management systems, new methods to support design and manufacture are emerging, such as the Digital Enterprise Technology (DET) which was defined as “the collection of systems and methods for the digital modelling of the global product development and realization process, in the context of lifecycle management” [3]. This promises highly positive impact on product development and realization strategies in particular through the use of computer-aided manufacturing risk mitigation approaches.
Method such as DET require the development of accurate manufacturing process modelling, which could then be used for reliability modelling and verification [4] and
consequently for product development risk reduction
Thus, for micro manufacturing techniques to be fully integrated in these new digital modelling techniques, it is essential to develop advanced modelling and control of manufacturing chains involving micro manufacturing technologies in order to facilitate their consideration in the design of new innovative products. In addition, new developments in high value products factories should allow for rapidly reconfigurable manufacturing chains.
This paper is focusing on the integration of an efficient micro machining simulation technique, for the micro Electro Discharge Manufacturing (µEDM) process, which would support the development of such advanced control and facilitate the re-configurability of manufacturing chains using the µEDM process and in particular the µEDM die-sinking.
From any newly designed features to be produced by µEDM die-sinking, the proposed manufacturing simulation technique would enable designers to perform digital optimisation and manufacturability verification through a digital optimisation of µEDM die-sinking tool electrodes design.
This will support the development of a sustainable manufacturing operation as, in addition to the use of an IT based design manufacturability check, the tool design optimisation is expected to enhance the efficiency of the µEDM die-sinking, in particular by reducing the number of EDM tools required thus further reducing waste and energy consumption.
The sections two and three of this paper give an introduction to the µEDM process and to the developed µEDM simulation technique. This simulation technique is used to develop a new EDM tool electrode optimisation technique presented in section four.
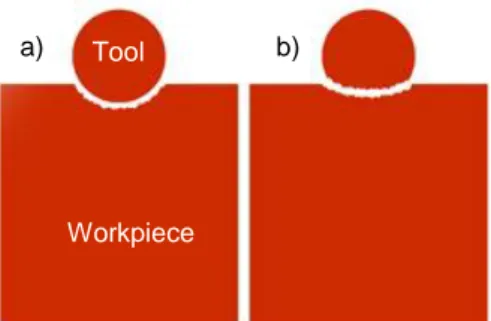
Figure 1: Tool wear influence in micro-EDM. a) Desired result. b) Obtained result.
2. µEDM Introduction
Electrical Discharge Machining (EDM) is a manufacturing process where material removal is due to successive electrical discharges. Its main interest lies in the possibility of machining any conductive material regardless of hardness.
A few variants of EDM are in use but share an underlying principle: the tool and the workpiece (or electrodes) are immerged in a dielectric fluid and submitted to an electrical current. The gap between them is reduced until the dielectric reaches its breakdown voltage. The current is then free to flow from one electrode to the other creating a plasma channel. The energy dissipated partly evaporates the tool and workpiece leading to the formation of craters.
Micro-EDM (µEDM) deals with micrometric dimensions. The polarity is usually inverted in order to alleviate the effects of tool wear: as the process goes on, material is removed from the tool, modifying its shape. While of manageable consequences in classic EDM, the influence of tool wear is most notable in its micro counterpart as can be seen in Figure 1.
While proven methods exist for µEDM milling to compensate for the tool wear, die-sinking µEDM would require the use of multiple tools to obtain the desired geometries. The ability to predict the location and intensity of wear in die-sinking µEDM would enable the design of optimal tools able to compensate for the upcoming wear and reduce the number of electrodes required for a successful machining.
The optimisation of tool electrode to compensate for tool wear is used regularly in drilling and in micro EDM milling.
When producing blind holes using micro-EDM drilling without wear compensation, because of tool wear, the real depth of the hole will be significantly smaller [5]. A method to achieve a specific depth in this case is to compensate for wear by constant electrode feeding in the Z-axis [6], which is equivalent to extending the
Tool
Workpiece
working length of the tool using the expected wear ratio. In micro EDM milling, the use of simple shaped electrode (generally cylindrical) makes the wear prediction relatively straightforward [7]. It uses specific layer by layer machining strategies, such as the Uniform Wear Method [8], which ensures that the machining occurs only on the bottom surface of the electrode and results in a relatively linear wear on the z-axis. Therefore, only feeding the electrode in z-axis can do the wear compensation, which is again equivalent to extending the working length of the tool. In the case of die sinking micro EDM, where more complex shapes are used as electrodes, the compensation is not as straightforward as the way electrode geometries are affected by the wear is difficult to predict.
A way forward is to consider the use of simulation. This was the case in a paper [9] where the final shape of tool electrode can be predicted in one step using a “reverse simulation" technique. In this simulation, the removal of volume on both workpiece and electrode is achieved using voxels’ representations and appears to performed per specific time periods on large areas rather than discharge by discharge. It is not clear if this method can be applied to micro-EDM due to resolution that can be applied to the voxels’ representation used.
In this paper, an efficient simulation method using voxels in an octree data structure, which allows for high resolution simulation, was used as a building block for the tool electrode optimisation and is described in the next section.
3. µEDM Simulation Tool
3.1. Simulation Overview
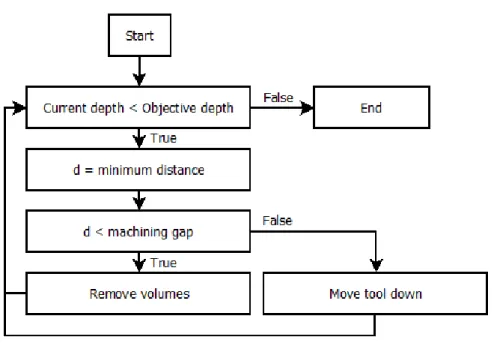
The simulation algorithm used is an updated version of an algorithm developed previously by the authors [10]. Using 3D models of a tool and a workpiece, this algorithm iteratively simulate the EDM process by removing volumes in a manner described in Figure 2: Overall simulation diagram.Figure 2. The 3D models can be imported from any CAD format such as those emerging from 3D scans of real parts, consequently simulations could be performed on models derived from components measured in the middle of a manufacturing chain, prior to an EDM die sinking step, thus allowing for EDM process re-configurability if required.
The following parameter are fixed by the user before each simulation:
- Machining gap: the distance between the workpiece and the tool below which it is possible for sparks to take place.
- Workpiece Crater Volume: the volume of “material” removed from the workpiece by each spark.
- Tool Crater Volume: the volume of “material” removed from the tool by each spark.
Figure 2: Overall simulation diagram.
The first step consists in checking if the current depth of the tool is smaller than the objective depth. If this is true, the minimum distance d between the tool and the workpiece is computed as well as the corresponding locations.
Should that distance d be smaller than the machining gap, craters are added through volume removal on the electrodes (tool and workpiece).
If d is greater than the machining gap, the tool electrode is moved down by a small increment.
The algorithm then compares the current depth against the objective again and a new iteration begins.
Should the current depth meet the targeted one, the process is stopped.
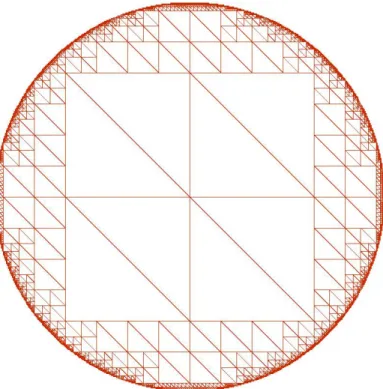
The simulation tool makes use of voxels embedded in a voxel octree to describe the geometries (the tool and the workpiece) involved in the process. As a result the modelling is purely volumetric due to the use of voxels while octrees significantly decrease memory usage by representing large volumes as a single and larger voxel as illustrated in Figure 3.
The octree data structure is a tree structure in which each node can have up to eight children (hence the name). A node without any children is called a leaf node. The topmost node (containing all others) is called the root.
Figure 3 : Cross-sectional view of a sphere represented as voxels in an octree tree structure.
3.2. Algorithms
3.2.1. Minimum distance search
The minimum distance search makes use of the hierarchical data structure available with octrees. The algorithm starts with the root nodes of each electrode and computes the minimum distance between all the possible couples of their children:
- If both children are leaves, the minimum distance between them can be immediately found.
- If not, the minimum distance can be bounded between a maximum dmax
and a minimum value dmin.
All the couple of nodes that verify the following relation are kept: Where dsmallestMax is the smallest of all the dmax.
Figure 4 : Cross-sectional view of a crater at a resolution of one voxel per 125 nm. All the remaining couples’ children are then compared in an identical manner until only couples of leaves remain.
A fast exit condition is used in the case where a couple of nodes have an upper bound dmax that is smaller than the machining gap.
3.2.2. Crater insertion
The crater insertion algorithm also uses the hierarchical nature of octrees. At the relevant location, the intersections between a sphere and the root node’s children are computed.
- If a child node doesn’t intersect, nothing happens. - If a node is completely inside the sphere, it is deleted.
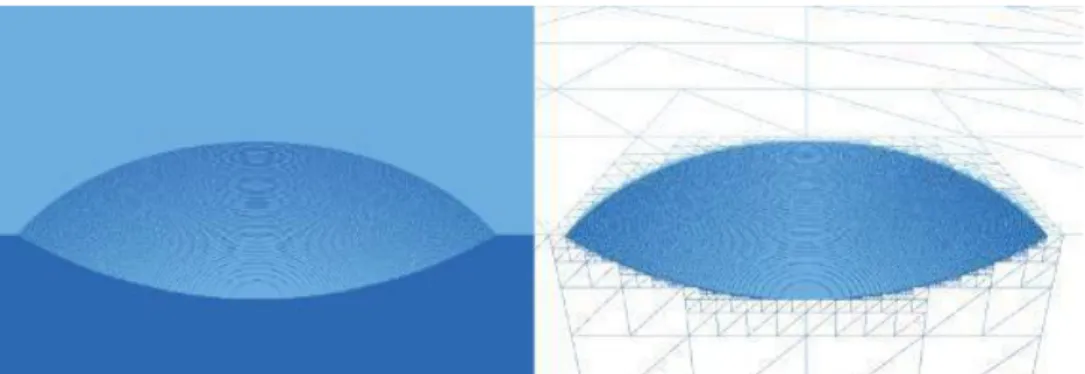
- Nodes on the boundary of the sphere are kept for the next iterations. The algorithm is then reapplied on the new candidate nodes until a certain resolution is met. A cross-sectional view of a crater can be seen in Figure 4. The result of a full simulation on a workpiece can be seen in Figure 5.
As mentioned previously, this simulation tool can be used for the design of optimal tool electrodes that can take into account the upcoming wear, thus reducing the number of electrodes required for a successful machining. This can be achieved through the shape optimisation tool described in the next section.
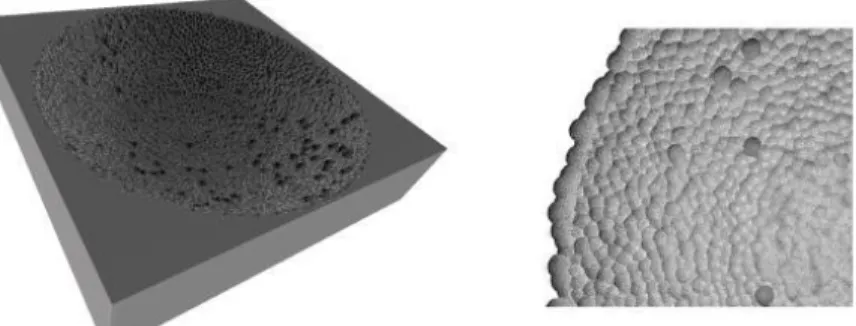
Figure 5 : Voxel workpiece after simulation (left) and details of the craters (right).
4.
Optimisation tool 4.1. OverviewWhat is proposed in this paper is to develop an iterative simulation process that adjusts the shape of the tool electrode in order to obtain an ultimate shape potentially able to produce in one single step the targeted cavity on the workpiece or its closest producible cavity. Although the tool presented in the previous section can provide 3D simulations, to demonstrate and validate the optimisation concept more efficiently it was decided to perform optimisation using the simulation with 2D profiles. However, the method can be easily adapted to 3D shapes.
Thus, considering a targeted cavity profile TWp to be produced on a workpiece,
each iteration of the optimisation process consists in five main steps:
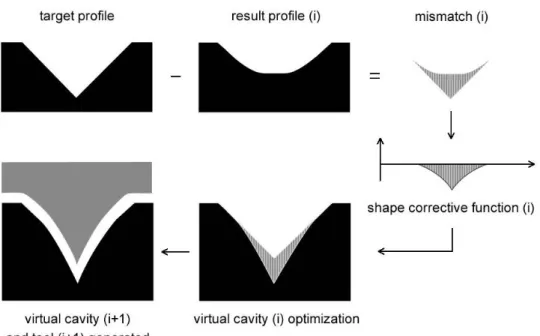
Compute the difference or mismatch DWp between the TWp and the previous
resulting cavity profile RWp. On the first iteration, the RWp is a virgin workpiece
since no machining has been done yet. This means that the first DWp represents
the actual overall target area to be removed (or volume in 3D).
Using the mismatch, adapt the virtual cavity profile VWp.
Using the VWp, generate a virtual tool profile VT, which would produce the
selected VWp if no wear occurred on the tool.
Run the EDM simulation with VT on a new workpiece (not machined). This
provides a new resulting cavity profile RWp to be analysed for the next iteration.
The accuracy of the optimisation process is measured with the following metric: The process is repeated until the accuracy no longer improves more than 0.5%, meaning that the resulting cavity is as close to the targeted workpiece cavity as can be produced with this process. As a consequence, the optimal tool for the desired workpiece is acquired.
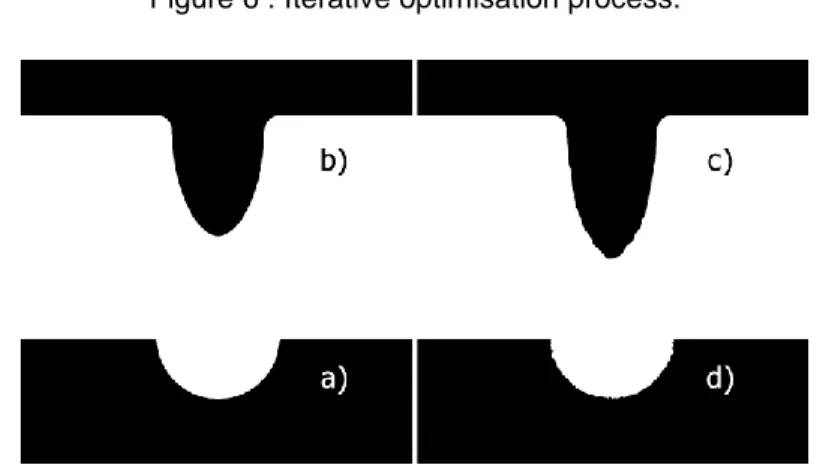
Figure 6 : Iterative optimisation process.
Figure 7 : Tool shape optimisation capabilities
An example of the expected capabilities of the tool shape optimisation process is given in Figure 7. Elements a) and b) represent respectively the targeted cavity profile TWp to be produced on the workpiece and the initial tool shape (virtual tool
profile VT at the first iteration). Elements c and d represent respectively the
optimized tool shape (final virtual tool profile VT) after five iterations and the
resulting workpiece (final cavity profile RWp). In this example, after four iterations,
the final shape of the workpiece (fig. 7.d) is similar to the desired shape (fig. 7.a) with an accuracy of 98.2%.
4.2. Virtual cavity profile VWp and tool generation VT
A key aspect of this procedure is the way the mismatches occurring after each iteration are used to propose new tool electrodes which would eventually lead to an optimum. At the end of each iteration, an intuitive reaction would be to attempt to use the area difference DWp between the resulting cavity profile RWp and the
targeted profile TWp to directly add “material” to the tool. However, due to the
Figure 8 : Virtual cavities VWp and their respective conjugate tool VT over different
iterations.
This is the reason why changes and optimisations are applied on the workpiece, rather than on the tool, thus producing a virtual entity called the virtual cavity profile VWp. The virtual cavity’s VWp only purpose is to generate its conjugate tool VT, a tool
that would produce the virtual cavity in a simulation without tool wear.
This conjugate tool is obtained by applying the machining gap on the surface of VWp, as shown in Figure 8. The machining gap being the minimum distance at
which sparks occurs and therefore the closest distance a potential tool can get before wearing out on both sides.
On each iteration, the VWp is optimized according to the given mismatch DWp, thus
a new tool VT is generated and produces a new workpiece shape RWp.
4.3. Assessing differences between resulting and targeted profiles
At the end of each iteration, the difference between resulting and targeted workpiece profiles is assessed by doing a symmetry difference. Workpiece profiles are converted into 2D Boolean matrixes where each element of the matrix represents one pixel. These matrices can take two values (Figure 9): 0 for blank pixels, 1 for colored pixels.
The mismatch matrix is then computed by doing the difference between the matrix equivalents of the targeted workpiece profile A (matrix equivalent of TWp) and the
resulting workpiece profile B (matrix equivalent of RWp). This difference is
Figure 9 : Conversion between bitmap image and 2D Boolean matrix.
A
B
X
0
0
0
0
1
-1
1
0
1
1
1
0
Figure 10 : Table of truth of the 2D Boolean matrix difference(X = A-B). This computation outputs two distinctive areas:
positive area: represents the excess of volume removed.
negative area: represents the lack of volume removed.
It is important to make this distinction for corrective purpose. Indeed, these areas pinpoint the locations where the tool was under/over effective, as described in Figure 11. With this kind of information, it is possible to modify the virtual cavity and a fortiori the tool in order to compensate for its lack or excess of material removal. Analytics on the mismatch matrix also give valuable information regarding the advancement of the optimisation process.
3.3. Optimisation of the virtual cavity profile
Based on the assessed difference between the targeted workpiece profile and the result of an iteration, the optimisation objective is to make modifications on the virtual cavity profile VWp so that the virtual tool profile VT, generated in the next
iteration, reduces the difference.
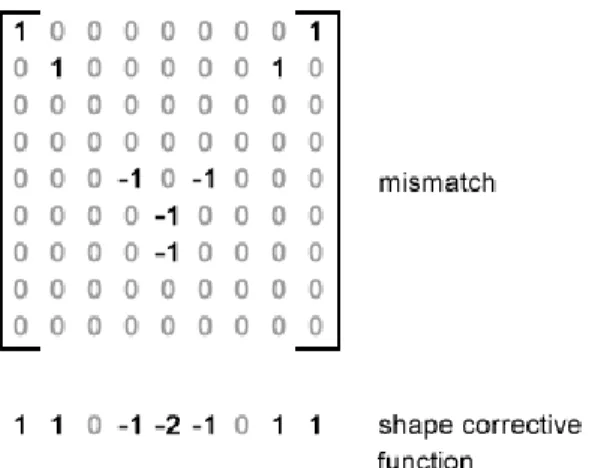
The shape corrective function to apply to the virtual cavity is computed by taking the vertical summation of each column of the mismatch matrix (Figure 12). The resulting discrete function represents the vertical difference between the objective and the current result. Positive values referring to an excess of removal, and negative values referring to a lack of removal.
Figure 11 : Computation of the mismatch matrix.
Figure 12 : Computation of the shape corrective function.
The shape corrective function is then applied onto the surface of the virtual cavity, whose shape should evolve to improve the efficiency of the next tool conjugate generated, as described in Error! Reference source not found..
Looking to compensate the difference from a vertical point of view is simpler for data processing but also relevant in the context of die-sinking EDM, because the movement of the tool is restricted to the vertical axis and thus most interactions happen in this direction.
It should also be mentioned that the shape corrective function is altered by the wear ratio in order to take into account the future expected wear on the tool, and thus improve the efficiency of each iteration of shape the optimisation process. Thus in cases of excess of volume to be removed, following approaches developed for drilling and EDM milling, one could suggest that the shape corrective factor obtained for each vertical summation should be altered by the wear ratio.
Figure 13 : Optimisation process on iteration (i)
The wear ratio is simply defined by the ratio between the wear occurring on the tool electrode and the wear occurring on the workpiece, which for the simulation would be equivalent to the ratio between the Tool Crater Volume and the Workpiece Crater Volume.
3.4. Experiments and discussion
In order to demonstrate the applicability of the tool shape optimisation method, three different targeted profiles have been used.
The following parameters were used for all simulations:
Machining gap: 5μm
Tool wear ratio : TWR = 0.5
To achieve a tool wear ratio of 0.5, the volume ratio is defined by the parameters of the craters which apply respectively on the workpiece and the tool as follows:
Workpiece: crater radius = 3.00μm and crater depth: 2.25μm.
Tool: crater radius= 2.25μm and crater depth= 1.50μm. The three different target profiles tested are defined as such:
1. Circle (Figure 14.a): 80μm radius and 80μm deep
2. Isosceles triangle (Figure 16.a): 160μm wide and 80μm deep 3. Rectangle (Figure 16.a): 160μm wide and 80μm deep
Figure 14: Accuracy of each iteration during the optimisation process for all three target profiles
The figure 14 represents the evolution of the accuracy for each iteration until the process stop. The accuracy is the measure of the overall completeness of the machining in regard to the objective profile. This metric stabilizes after a few iterations for each tests subjects and the process stops when accuracy’s progression over one iteration becomes less than 0.5%. It means that the following optimisation iterations will not improve the tool significantly anymore. Therefore, the optimisation process stops and the tool giving the highest accuracy is kept as the optimal tool.
As can be seen in Figure 15, in all cases the optimal tool was obtained after 3 to 4 iterations with an accuracy rate of over 96%. This certifies that the optimal tools are very effective given that the remaining mismatch is mostly due to the imperfection of craters in regard to the target geometry as shown in figure 16.c) 17.c) an 18.c).
Iteration number of optimal tool Accuracy of optimal workpiece result Mean duration of optimisation loops
Circular profile 4 98.2 % 52 sec
Triangular profile 4 96.0 % 41 sec
Rectangular profile 3 96.6 % 66 sec
It is important to notice that the cavity of the rectangular target profile is significantly bigger than the others, with the cavity of the triangular profile being the smallest. This means that there will be more material to remove. As a consequence, the duration of each iteration for the optimisation of the rectangular profile are the longest and those of the triangular profile are the shortest.
Figures 16, 17 and 18 represent the important geometries of the optimisation process respectively for the circular profile, the triangular profile and the rectangular profile. Figures a) are the geometries of the target profiles while figures b) are the geometries of the optimal tools resulting from the optimisation process. Finally, figures c) show the mismatch area remaining from the machining of the optimal tool.
Figure 16: Tool optimisation results for the circular profile
Figure 18: Tool optimisation results for the rectangular profile
The remaining mismatch on the triangular profile (Figure 16.c) peaks at 5.75μm around the tip of the isosceles triangle, questioning whether the sharpness objective of the profile is achievable. This highlights the fact that not all target profiles are achievable with the die-sinking EDM process, a fortiori using a single tool. The final mismatch can be considered as a machinability check metric that indicates to designers if the resulting workpiece will match their dimension tolerances. Consequently, this can be used as a designer’s tool to check if the EDM process is adequate for the production of specific new features or, as mentioned previously, in the middle of a manufacturing chain using scans of produced components to check if a re-configurability of the EDM process is required and if it could lead to the desired features’ tolerances.
In order to test the limits of the tool shape optimisation method, the same three target profiles underwent tool optimisation method with three different machining gaps:
Machining gap: 5μm, 20μm and 40μm
Figures 19, 20 and 21 represent evolution of accuracy during the optimisation process of all three profiles for each machining gap.
What is worth highlighting here is that, except for the circular profile, the machining gap significantly worsens the accuracy of the optimal tool as it gets bigger. This is due to the more pointy shapes of the triangular and rectangular profiles. These shapes are more difficult to acquire when the machining gap increase because the vertical compensation applied on the cavity tool is then nullified by the large machining gap as the conjugate tool is generated. As shown in Figure 22, a significant compensation applied on the virtual cavity does not affect the tool much in return.
Figure 19 : Evolution of accuracy during the optimisation process of the circular profile for different machining gaps.
Figure 20 : Evolution of accuracy during the optimisation process of the triangular profile for different machining gaps.
Figure 21 : Evolution of accuracy during the optimisation process of the rectangular profile for different machining gaps.
Figure 22 : virtual cavity and respective tool on different iterations with a machining gap of 40μm.
5. Conclusion and Future works
This paper presented a new method for computer-aided optimisations of micro EDM die sinking tools, which can be used by product designers for digital optimisation and manufacturability verification of micro features to be produced by micro EDM. Its applicability to simple shaped cavities was demonstrated. With further developments, this optimisation tool should enable rapid and cost effective manufacturability checks at product design stages or for manufacturing chains re-configurability when the micro-EDM die sinking process needs to be considered for the production of new structures. This will be the focus of future experiments, with real machining tests using proposed optimum EDM tools.
Further improvements for the optimisation process are also being considered. In particular, to achieve a more efficient optimisation process it could be useful to add other stopping criterion, such as with the achievement of specific tolerances on the end product features.
Also, adapting the shape corrective function in cases where the machining gap is a handicap would be important to ensure the achievement of the optimal tool.
Finally, the proposed framework enables the optimisation of the shape of a single tool, future works should also concentrate on the optimisation of a number of tools used in a sequence when a cavity cannot be achieved with as single one or when roughing and finishing strategies should be considered.
References
[1] Islam, N., Miyazaki, K.: Nanotechnology innovation system: understanding hidden dynamics of nanoscience fusion trajectories, Technological
Forecasting and Social Change 76, 128–140 (2009).
[2] IPMMAN roadmap for micro- and nano-manufacturing. Almansa, A., Wogerer, C., Rempp, H., Gebauer, M., (Ed.), Karlsruhe, Germany, version 2.0 (2006). [3] Maropoulos, P.G. Digital enterprise technology-defining perspectives and
research priorities. Int. J. Computer Integrated Manuf., 16(7-8), 467-478 (2003).
[4] Daia, W., Maropoulos, P.G., Zhaoa, Y. Reliability modelling and verification of manufacturing processes based on process knowledge management. Int. J. Computer Integrated Manuf., 28(1), 98-111, 2015.
[5] Pham, DT., Dimov, SS., Bigot, S., Ivanov, A., Popov, K.: MicroEDM—recent developments and research issues. J Mater. Process. Technol. 149(1–3), 50– 57 (2004)
[6] Bleys, P., Kruth, J.P., Lauwers, B., Zryd, A., Delpretti, R., Tricarico, C.: Real time tool wear compensation in milling EDM, Ann. CIRP 51 (1), 157–160 (2002).
[7] Bissacco, G., Hansen, H.N., Tristo, G., Valentinčič, J.: Feasibility of wear compensation in micro EDM milling based on discharge counting and
discharge population characterization. CIRP ann., Vol. 60 (1), 231-234 (2011). [8] Yu, Z., Masuzawa, T., Fujino, M. 3D micro-EDM with simple shape electrode,
Int. J. Electr. Mach. 3, 71–79 (1998).
[9] Kunieda, M., Kanekob, Y., Natsub W. Reverse simulation of sinking EDM applicable to large curvatures. Precision Engineering 36, 238-243 (2012). [10] Bigot, S., Pernot, J., Surleraux, A., Elkaseer, A.: Micro-EDM numerical
simulation and experimental Validation, Proceedings of the 10th International Conference on Multi-Material Micro Manufacture , (2013) ISBN 9789810772482 10.3850/978-981-07-7247-5_414