de l’Université de recherche Paris Sciences et Lettres
PSL Research University
Préparée à l’Université Paris-Dauphine
COMPOSITION DU JURY :
Soutenue le
par
ecole Doctorale de Dauphine — ED 543
Spécialité
Dirigée par
Long-term dynamics of investment decisions in electricity
markets with variable renewables development and
adequacy objectives
29.11.2016
Marie PETITET
Dominique FINON
Professeur émérite (Univ. de Montpellier) M. Jacques PERCEBOIS
Directeur de recherche CNRS (CIRED) M. Philippe QUIRION
Mme Anna CRETI
Professeur (Université Paris-Dauphine) M. Richard GREEN
Professeur (Imperial College London) M. Tanguy JANSSEN
Ingénieur-économiste (RTE) M. Olivier MASSOL
Professeur associé (IFP School) M. Dominique FINON
Directeur de recherche CNRS émérite M. Jan-Horst KEPPLER
Professeur (Université Paris-Dauphine)
Sciences économiques
Rapporteur Rapporteur Présidente du jury Membre du jury Membre du jury Membre du jury Directeur de thèse Directeur de thèseJan-Horst KEPPLER
Ecole Doctorale de Dauphine – ED 543
Centre de Géopolitique de l’Énergie et des Matières Premières (CGEMP-LEDa) Chaire European Electricity Markets (CEEM)
Discipline : Sciences Économiques
Thèse de doctorat
Soutenue publiquement le 29 novembre 2016 par
Marie Petitet
Long-term dynamics of investment decisions in electricity
markets with variable renewables development and
adequacy objectives
Directeurs de thèse : M. Dominique FINON Directeur de recherche CNRS émérite
M. Jan-Horst KEPPLER Professeur (Université Paris-Dauphine)
Composition du jury :
Présidente du jury : Mme Anna CRETI Professeur (Université Paris-Dauphine) Rapporteurs : M. Jacques PERCEBOIS Professeur émérite (Université de Montpellier)
M. Philippe QUIRION Directeur de recherche CNRS (CIRED)
Membres du jury : M. Richard GREEN Professeur (Imperial College London)
M. Tanguy JANSSEN Ingénieur-Économiste (RTE)
L’Université Paris Sciences et Lettres (PSL), l’Université Paris-Dauphine et Réseau de Transport d’Électricité (RTE) n’entendent donner aucune approbation ni improbation
aux opinions émises dans cette thèse. Ces opinions doivent être considérées comme propres à leur auteur.
ness and there discover its own particular beauty. But the progressive West-erner is determined always to better his lot. From candle to oil lamp, oil lamp to gaslight, gaslight to electric light – his quest for a brighter light never ceases, he spares no pains to eradicate even the minutest shadow.”
Jun’ichiro Tanizaki, In praise of shadows, 1933.
“The scientific man does not aim at an immediate result. He does not expect that his advanced ideas will be readily taken up. His work is like that of the planter – for the future.”
In liberalised electricity systems, power markets are expected to ensure the long-term coordination of investments in order to guarantee security of supply, sustainability and competitiveness. In the reference energy-only market, it relies on the ability of power markets – where the hourly price is aligned with the marginal cost of the system – to provide an adequate price-signal for investors. However, in practice, questions have been raised about its ability to trigger investments in Low-Carbon Technologies (LCT) including in particular Renewable Energy Sources of Electricity (RES-E), and its ability to ensure capacity adequacy.
After a characterisation of these market failures, this dissertation tackles the two research topics within a methodological framework based on a System Dynamics model developed to simulate private investment decisions in power markets.
First, the results show that substituting out-of-market support mechanisms for RES-E by market-based investments helped by the sole implementation of a carbon price appears as a feasible solution to trigger RES-E development providing that there is a political commitment on a high carbon price.
Second, it also appears that the energy-only market with price cap is ineffective to ensure capacity adequacy in a context of mature markets with conventional thermal power plants under transition paths which involve a stable electricity demand thank to energy efficiency efforts and the exogenous development of RES-E thanks to support mechanisms in the absence of a high and fixed carbon price. Adding a capacity market or removing the price cap both bring benefits in terms of Loss Of Load Expectation (LOLE) and social welfare. Moreover, considering two various energy transition scenarios and different assumptions about the risk aversion of private investors, the capacity market is identified as the best option for regulators among the considered market designs.
Key words: Electricity markets, Investments, Renewables energy sources, Capacity ade-quacy, System Dynamics modelling.
Les marchés électriques libéralisés sont supposés assurer la coordination de long-terme des investissements afin de garantir sécurité d’approvisionnement, viabilité et compéti-tivité. Dans le modèle de référence energy-only, la formation des prix par alignement sur le coût variable de l’équipement marginal sur les marchés horaires successifs four-nit un signal prix pour les investisseurs. Cependant, en pratique, ce modèle est remis en question quant à sa capacité à déclencher des investissements dans les technologies bas-carbone et en particulier les énergies renouvelables (EnR) et quant à sa capacité à garantir la sécurité d’approvisionnement.
Cette thèse cherche d’abord à caractériser ces deux défaillances de marché puis s’intéresse à différentes solutions pour faire face à chacune d’entre elles. Pour cela, la réfléxion s’appuie sur un modèle en System Dynamics développé afin de simuler les investissements dans les marchés électriques.
Les résultats montrent que le remplacement des mécanismes de support hors marché par des investissements par le marché avec l’aide d’un prix du carbone apparait comme une solution pour déclencher le développement des EnR à condition d’un engagement politique fort en faveur d’un prix du carbone élevé.
Il apparait aussi que le marché energy-only avec des prix plafonnés ne parvient pas à as-surer l’adéquation en capacité dans un contexte de marchés électriques matures avec des centrales thermiques conventionnelles faisant face à des scénarios de transition énergé-tique. L’ajout d’un marché de capacité ou la suppression du plafond de prix permettent une amélioration en termes de nombre d’heure de délestage et de bien-être collectif. De plus, en considérant deux scénarios de transition énergétique et plusieurs hypothèses sur l’aversion au risque des investisseurs privés, le marché de capacité apparaît comme le meilleur choix pour le régulateur parmi les architectures de marché considérées.
Mots-clés : Marchés électriques, Investissements, Energies renouvelables, Adéquation de capacité, Modélisation en System Dynamics.
S’offrir trois années de recherche sur un même sujet : défi ou idée folle ? Après réflexion, j’ai décidé de me lancer dans cette aventure, accompagnée de la créativité telle qu’elle a été nécessaire à Oedipe1 pour résoudre l’énigme de la Sphinx.
“Ce qu’on cherche, on peut le trouver; mais ce qu’on néglige nous échappe.”
Sophocle, Oedipe Roi.
Ce projet a été mis en musique par deux remarquables chefs d’orchestre, Dominique Finon et Jan-Horst Keppler. Je tiens à remercier très sincèrement mes deux directeurs de thèse pour leurs suivis et leurs complémentarités. Je suis infiniment reconnaissante à Dominique pour sa disponibilité, sa créativité et ses avis pleins de sagesse.
Les conseils continus et précis de Tanguy Janssen, accompagnés de sa bonne humeur, ont très largement contribués à la réussite de cette thèse. Je le remercie pour sa persévérance et ses recommandations avisées. Je le remercie aussi pour m’avoir ouvert les portes de l’enseignement.
Je suis très reconnaissante à tous les membres de mon jury. Leurs conseils, leurs atten-tions et leurs quesatten-tions m’ont permis de terminer agréablement et efficacement ce travail de recherche.
Pour la réalisation de cette thèse, j’ai eu la chance de bénéficier d’un contrat CIFRE avec RTE et surtout d’un accueil toujours agréable au département Marchés. Je remercie très sincèrement Colas Chabanne, Silvano Domergue et Céline Marcy pour m’avoir soutenue dans ce projet à ses débuts, et bien-sûr Thomas Veyrenc pour avoir accepté de lancer une première thèse dans ce département. Je remercie également l’ensemble de mes collègues de RTE et plus particulièrement l’équipe ME2 de Cédric Léonard. Je n’oublie pas les
1Je précise que l’outil développé pendant ma thèse a été initialement nommé Outil pour l’Etude
Dynamique des Investissements dans la Production Electrique(OEDIPE).
La liste serait trop longue ici, mais je suis sûre qu’ils se reconnaîtront ! Parmi eux, je remercie spécialement Maxime et Soumaya pour m’avoir donné de leur temps pour relire certaines parties de cette thèse.
Je remercie les doctorants de la chaire CEEM avec qui j’ai partagé des moments agréables à Dauphine. Je remercie aussi Fatou pour m’avoir apporté son soutien encourageant et toujours très amical.
Je remercie Sanaa qui a été présente tout au long de ces trois années et qui a bien voulu relire attentivement certains passages de cette thèse. Choukran jidan ya Sanaa ! Je pense aussi à Alexandra. Nous avons eu la chance de nous retrouver à Paris, après ces lointaines années au lycée de Saint Rom. J’ai été heureuse que nous puissions partager nos expériences sur la thèse. Grazie cara !
J’ai également une pensée sincère pour tous ceux que je n’ai pas nommés mais qui ont de différentes manières participé à la réussite de ce projet.
Je n’oublie pas que mes parents et mon frère Pierre m’ont apporté leurs soutiens sans faille tout au long de ces trois années. Même depuis Lyon ou Oxford, vous avez réussi à me donner le courage nécessaire à cette étape. Merci pour tout !
Pour finir, cette expérience n’aurait pas été la même sans toi, Basem. Je te remercie infiniment pour ce que tu m’apportes chaque jour.
Abstract ix
Résumé xi
Remerciements xiii
Contents xv
List of Figures xix
List of Tables xxiii
Abbreviations xxv
General introduction 1
I Long-term investment incentives in liberalised electricity markets 13
I.1 Identifying and analysing the specificities of power systems . . . 15
I.1.1 Specificities of electricity demand . . . 15
I.1.2 Specificities of electricity supply-side . . . 17
I.1.3 Demand-response, a way to realign physical equilibrium and mar-ket equilibrium . . . 22
I.1.4 Defining electricity products based on the specificities of power systems . . . 24
I.2 Analysing the long-term coordination functions of electricity markets . . . 27
I.2.1 Long-term coordination of investments by electricity markets . . . 27
I.2.2 Limits of the long-term coordination by the energy-only market. . 30
I.3 Investments in capital-intensive equipments in the context of environmen-tal and climate policies. . . 36
I.3.1 Difficulties in investing in renewables and low-carbon technologies 37 I.3.2 Regulatory failures of the carbon pricing. . . 39
I.3.3 Out-of-market arrangements to support renewables and low-carbon technologies . . . 41
I.4 Capacity adequacy issues . . . 47
I.4.1 Defining capacity adequacy . . . 47
I.4.2 Alternative capacity mechanisms . . . 49
I.5 Synthesis of the chapter . . . 56
II Modelling investment decisions in electricity markets 59
II.1 Investment decisions in a risky environment . . . 61
II.1.1 The investment problem . . . 61
II.1.2 Investment decision criteria of private agents . . . 62
II.1.3 Risk aversion . . . 73
II.2 Long-term modelling of power markets and generation mix . . . 80
II.2.1 Comparison of levelised costs of generating technologies . . . 80
II.2.2 Optimisation models . . . 83
II.2.3 Microeconomic equilibrium models . . . 89
II.2.4 Simulation modelling by Agent-Based and System Dynamics ap-proaches . . . 92
II.2.5 Comparison of long-term modelling approaches of power markets . 99 II.3 The Simulator of Investment Decisions in the Electricity Sector (SIDES) . 106 II.3.1 Motivations for the adopted approach of System Dynamics modelling106 II.3.2 General presentation of the SIDES model . . . 107
II.3.3 Modelling an energy market . . . 112
II.3.4 Modelling a capacity market . . . 114
II.3.5 Modelling investment decisions . . . 119
II.3.6 Modelling risk aversion in investment decisions . . . 123
II.4 Synthesis of the chapter . . . 127
III Development of wind power without support mechanisms 129 III.1 Introduction. . . 131
III.2 Definition of the case study . . . 135
III.2.1 Methodology . . . 135
III.2.2 Assumptions and data . . . 138
III.3 Results. . . 141
III.3.1 Wind power in an initial pure fossil-fuel based system . . . 141
III.3.2 Wind power in a system with the nuclear option open . . . 147
III.4 Discussion . . . 149
III.4.1 Cost-price comparison of fossil-fuel technologies and wind power . 149 III.4.2 Profitability of wind power . . . 153
III.4.3 Energy spill-overs and power outages . . . 153
III.4.4 Sensitivity of the results to plant parameters and market design . 154 III.5 Conclusions . . . 157
IV Enhancing capacity adequacy of mature power systems 161 IV.1 Introduction. . . 163
IV.2 Definition of the study . . . 167
IV.2.1 Methodology . . . 167
IV.2.2 Data on technologies’ characteristics, costs and demand forecast . 169 IV.3 Results and discussion . . . 173
IV.3.1 Results under risk-neutrality . . . 173
IV.3.2 Effect of risk aversion . . . 192
IV.4 Conclusions . . . 199
A Glossary and nomenclature 209
A.1 Glossary . . . 209
A.2 Nomenclature . . . 210
B Utility and mean-variance objective functions 213 B.1 Common utility functions . . . 213
B.2 Equivalence between the exponential utility function and the mean-variance objective function. . . 214
C Understanding the basics of the SIDES model 217 C.1 Presentation of the case study. . . 217
C.2 Results. . . 219
C.2.1 Optimal generation mix by the screening curves approach . . . 219
C.2.2 Simulations with the SIDES model . . . 220
C.3 Insights on the functioning of the SIDES model . . . 222
D Price formation on a capacity market 225 D.1 Preliminary precisions . . . 225
D.1.1 Which costs should be considered? . . . 225
D.1.2 Missing money: a useful distinction. . . 226
D.2 Formation of the capacity price offered by producers . . . 227
D.2.1 Existing power plants . . . 227
D.2.2 New power plants . . . 231
D.2.3 Summary table . . . 234
E Electricity demand and wind data used in the simulations 237 E.1 Data used in chapter III . . . 237
E.2 Data used in chapter IV . . . 240
F Résumé en français 245 Introduction. . . 245
I.1 Defining the optimal generation mix by screening curves. . . 20
I.2 Impossible balance between supply and demand during extreme peak events. 22 I.3 Timeline of coordination by markets until delevery time. . . 26
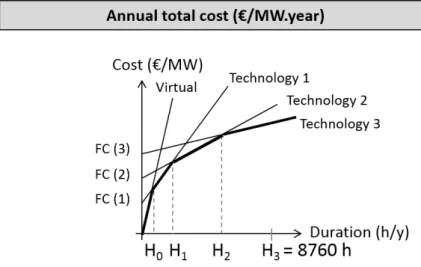
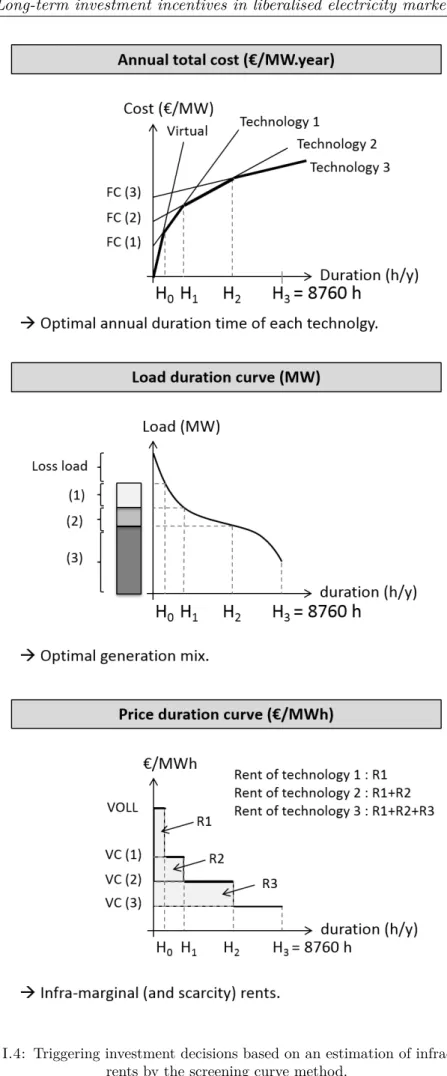
I.4 Triggering investment decisions based on an estimation of infra-marginal rents by the screening curve method. . . 29
I.5 Efficiency of price-based and quantity-based mechanism in reducing emis-sions.. . . 45
I.6 Classification of capacity mechanisms based on three design’s options. . . 51
II.1 Price load duration curve in the illustrative case. . . 71
II.2 Effect of 10% change on the NPV in the illustrative case. . . 72
II.3 Illustration of risk averse and risk seeking behaviours. . . 75
II.4 Mean-variance graph for portfolio selection. . . 76
II.5 Illustration of the principle of long-term optimisation solved in one step. . 85
II.6 Illustration of the principle of long-term optimisation solved by a decom-position between short-term dispatch and long-term investment. . . 86
II.7 Representation of future scenarios by a tree. . . 89
II.8 Example of a simplified causal-loop diagram of power systems . . . 95
II.9 Main characteristics to categorise the different models applied to the power systems. . . 100
II.10 Causal-loop diagram of the SIDES model . . . 108
II.11 Characterisation of the SIDES model. . . 109
II.12 Simulated marginal cost function and real marginal cost function . . . 112
II.13 Effect of wind power on net demand obligation (K1 and K2) from a load duration curve point of view. . . 116
II.14 Functioning of the capacity market . . . 117
III.1 Average electricity demand and its weather sensitivity (shaded area) . . . 140
III.2 Installed capacities (GW) over time for different carbon prices [case A]. . 141
III.3 Installed wind capacity over time for different carbon prices [case A]. . . . 142
III.4 Share of electricity production from thermal and wind power at the end of the simulation (on average over the 12 weather scenario) for different carbon prices [case A] . . . 143
III.5 CO2 emissions from electricity generation over time for different carbon prices (average values for weather scenarios) [case A].. . . 143
III.6 Evolution of the yearly average market price on the 20 years of the sim-ulation for different carbon prices (average values for weather scenarios) [case A]. . . 144
III.7 Average hours and volumes of electricity spill-overs, over the 12 weather
scenarios for different assumptions on carbon price [case A]. . . 145
III.8 Average hours and volumes of electricity outages (on average over the 12 weather scenarios) for different assumptions of carbon price [case A]. . . . 146
III.9 Levelised cost of electricity as a function of carbon price . . . 150
III.10Time-weighted and wind-weighted average price over years for the simu-lation with a carbon price of e 100 /tCO2 (for each year, on average over the 12 weather scenarios). . . 152
IV.1 Exogenous development of wind capacity (assumed for cases 1 and 2). . . 171
IV.2 Respective exogenous entries (for all cases) and closures of power plants (for case 2). . . 171
IV.3 Wind capacity factor as a function of installed capacity (own calculation) 172 IV.4 [Case 1, α = 0] Evolution of thermal capacity under the different market designs. . . 174
IV.5 [Case 1, α = 0] Evolution of the LOLE (hours/year) under the different market designs. . . 175
IV.6 [Case 1, α = 0] Evolution of the energy component of the consumers’ bill (the weighted average energy price) under the three market designs. . . . 179
IV.7 [Case 1, α = 0] Evolution of capacity price (in the market design CM). . . 180
IV.8 [Case 1, α = 0] Evolution of energy price for end-consumers with the distinction of its three components (energy, capacity and levy to finance wind power). . . 181
IV.9 [Case 2, α = 0] Evolution of thermal capacity under the different market designs. . . 183
IV.10[Case 2, α = 0] Evolution of the loss of load expectation (hours/year) under the different market designs. . . 183
IV.11[Case 2, α = 0] Evolution of energy component for consumers (weighted average energy prices; capacity component and renewables charge ex-cluded) under the three market designs. . . 187
IV.12[Case 2, α = 0] Evolution of capacity price in the market design CM. . . . 188
IV.13[Case 2, α = 0] Evolution of energy price for end-consumers with the distinction of its three components (energy, capacity and levy to finance wind power). . . 189
IV.14[Case 1] Evolution of total thermal capacity under design EOM3 for dif-ferent levels of risk aversion . . . 193
IV.15[Case 1] Variation of social welfare compared to the design EOM3 with no risk aversion (α = 0) . . . 195
IV.16[Case 2] Variation of social welfare compared to the design EOM3 with no risk aversion (α = 0). . . . 197
C.1 Definition of the reference mix (RefMix) . . . 220
C.2 Evolution of the generation mix over the 80-year period for the three cases221 C.3 Details on the decisions of new investments or early-retirements for the three cases. . . 221
C.4 Average mix (in GW) obtained in each case . . . 222
D.1 Illustrative time-line for an existing capacity. . . 228
D.3 Illustration of the value proposed on the capacity market in case of moth-balling option. . . 231
D.4 Illustrative time-line of moving an investment forward. . . 234
E.1 Load duration curves of the 12 historical scenarios used in chapter III. . . 238
E.2 Wind load factor versus electricity consumption, data used in chapter III. 239
E.3 Load duration curves of the 11 historical scenarios used in chapter IV. . . 241
E.4 Wind load factor versus electricity consumption, data used in chapter IV. 242
E.5 Effect of the introduction of 70 GW of wind power on the load duration curve (scenario 1). . . 243
F.1 Diagramme représentant le fonctionnement du modèle SIDES.. . . 252
F.2 Evolution de la capacité installée (GW) pour différents prix du carbone pour le cas d’étude sans nucléaire. . . 255
F.3 Variation du bien-être social par rapport au modèle de référence energ-only avec prix-plafond sans aversion au risque, pour le premier scénario de transition énergétique. . . 258
F.4 Variation du bien-être social par rapport au modèle de référence energ-only avec prix-plafond sans aversion au risque, pour le deuxième scénario de transition énergétique. . . 258
I.1 Characterisation of the different generation technologies. . . 19
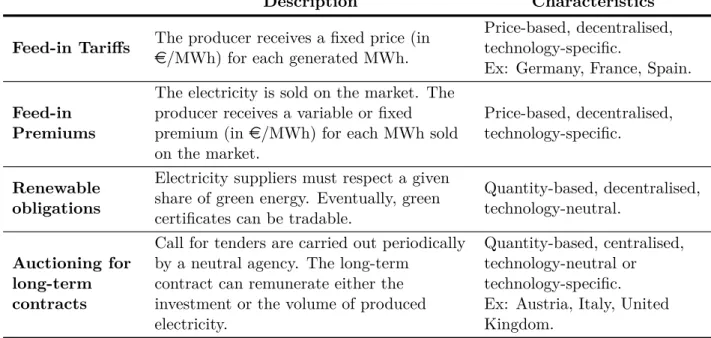
I.2 Presentation of the four most common support mechanisms. . . 43
I.3 Capacity mechanisms. . . 50
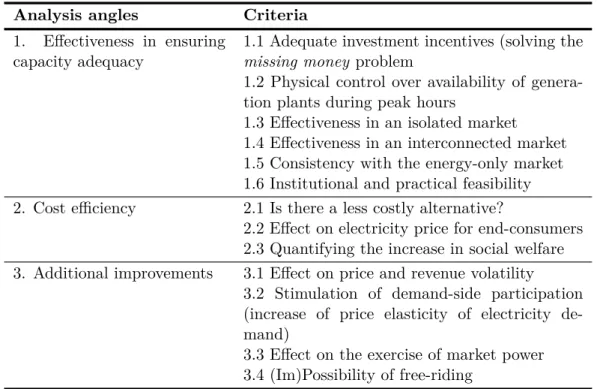
I.4 Analysis grid of capacity mechanisms. . . 54
II.1 Cost and technical assumptions of the illustrative case . . . 70
II.2 Investment criteria obtained for the illustrative case . . . 71
II.3 Different sources of risks identified in electricity generation projects. . . . 74
II.4 Comparison of nine SD models based on the proposed analytical framework.102
II.5 Comparison of the different modelling families based on the characteristics of the private investment process. . . 104
III.1 Economic and technical parameters of generating technologies used in chapter III. . . 138
III.2 Initial generation mix (cases A and B) . . . 139
III.3 Generation mixes at the end of the simulation for different carbon prices [case A]. . . 142
III.4 Annual share of wind capacity and energy (mean value over the 12 weather scenarios for the generation mix at the end of simulation) [case A] . . . . 143
III.5 Wind capacity at the end of simulation for different carbon prices with and without existing nuclear capacities [cases A and B-1] . . . 148
III.6 Levelised cost and fixed cost ratio for different carbon prices. . . 151
III.7 Wind capacity in case A and sensitivity to investment cost of wind power 155
III.8 Wind capacity in case A and sensitivity to the energy price cap . . . 156
IV.1 Presentation of the three market designs. . . 168
IV.2 Economic and technical parameters of generating technologies used in chapter IV. . . 169
IV.3 [Case 1, α = 0] Generation mixes (in GW of installed capacity) in the first year and at the end of the simulation for the different market designs.174
IV.4 [Case 1, α = 0] Loss of load expectation (h/year) under the different market designs . . . 176
IV.5 [Case 1, α = 0] Comparison of social welfare improvement by imple-menting scarcity pricing (EOM20) or capacity market (CM3 and CM0.5) (values per year on average) and respective risk levels. . . 178
IV.6 [Case 1, α = 0] Electricity bill for consumer on average over the 20 simu-lated years. . . 181
IV.7 [Case 2, α = 0] Loss of load expectation (h/year) under the three market designs. . . 182
IV.8 [Case 2, α = 0] Generation mixes (in GW of installed capacity) in the first year and at the end of simulation for the three market designs.. . . . 184
IV.9 [Case 2, α = 0] Comparison of social welfare improvement by implement-ing scarcity pricimplement-ing (EOM20) or capacity market (CM) (values per year on average) and respective risk levels, in a situation where new investments by the market are expected. . . 186
IV.10[Case 2, α = 0] Electricity bill for consumer on average over the 20 simu-lated years. . . 188
IV.11Comparison of social welfare improvement of scarcity pricing and capacity mechanism between case scenarios 1 and 2 (in Me/year on average), under risk-neutrality. . . 190
IV.12Comparison of risk level for CT through the average relative standard deviation of CT annual contribution margin for the three market designs and the two case scenarios. . . 191
IV.13[Case 1] Loss of Load Expectation (hours/year) on average over the simu-lation and at the end of the simusimu-lation, for the four market designs EOM3, EOM20 and CM3 and CM0.5, with different levels of risk aversion . . . . 194
IV.14[Case 1] Variation of social welfare (in Me/year on average over the pe-riod) compared to the reference risk-neutral case EOM3 . . . 194
IV.15[Case 2] Loss of Load Expectation (hours/year) on average over the sim-ulation and at the end of the simsim-ulation, for the three market designs EOM3, EOM20 and CM, with different levels of risk aversion. . . 197
IV.16[Case 2] Variation of social welfare (in Me/year on average over the pe-riod) compared to the reference risk-neutral case EOM3. . . 197
A.1 Nomenclature . . . 211
C.1 Definition of the different cases . . . 218
C.2 Plant parameters used in simulations . . . 219
C.3 Investment criteria estimated in the first year of the simulation . . . 221
C.4 Comparison of the generation mix (in GW) on average over the last 70 simulated years for the three different cases, and the optimal generation mix (RefMix). . . 222
D.1 Distinction between existing and new capacities concerning costs to be considered to define capacity offer. . . 226
D.2 Summary of capacity supply. . . 235
E.1 Descriptive statistics of electricity consumption scenarios used in chapter III.238
Acronym Full form
ACER Agency for the Cooperation of Energy Regulators
CARA Constant Absolute Risk Aversion
CAPM Capital Asset Pricing Model
CCGT Combined Cycle Gas Turbine
CCS Carbon Capture and Storage
CFO Chief Financial Officer
CRRA Constant Relative Risk Aversion
CT Oil-fired Combustion Turbine
DSO Distribution System Operator
EDF Electricité de France
ENTSO-E European Network of Transmission System Operators for Electricity EU-ETS EU Emissions Trading System
EUSE Expected Unserved Energy
FIP Feed-In Premium
FIT Feed-In Tariff
IEA International Energy Agency
IRR Internal Rate of Return
LCOE Levelised Cost Of Electricity
LCT Low-Carbon Technologies
LOLE Loss Of Load Expectation
LOLP Loss Of Load Probability
NPV Net Present Value
NSE Non-Supplied Energy
OECD Organization for Economic Co-operation and Development
O&M Operations and Maintenance
OTC Over The Counter
PI Profitability Index
PV Solar Photovoltaics
RES-E Renewable Energy Sources of Electricity
RSD Relative Standard Deviation
SD System Dynamics
SIDES Simulator of Investment Decisions in the Electricity Sector
TSO Transmission System Operator
UK United Kingdom
USA United States of America
VaR Value at Risk
VOLL Value Of Loss Load
WACC Weighted Average Cost of Capital
To my parents, for having consistently believed in me from the
beginning...
“Electre n.s. Amber; which, having the quality when warmed by friction of attracting bodies, gave to one species of attraction the name of electricity, and to the bodies that so attract the epithet electrick.”
Samuel Johnson, A Dictionary of the English Language, 1755. The liberalisation of the power sector has completely changed the paradigm of genera-tion units. The previous vertically-integrated utility service monopoly was based on the “cost-of-service” regulation model of pricing in which the electricity price was defined to compensate the average production cost. It has been replaced by a de-verticalised organisation with competition between generators upstream and suppliers downstream leading to a “market-based pricing model” (Borenstein and Bushnell, 2015). In the new model of competitive markets, generating assets get paid for the electricity sold on wholesale markets but without any long-term arrangements to guarantee the sufficient recovery of fixed costs. Indeed, this change in the remuneration paradigm of generation units – from average production cost to short-term marginal cost – had been a major motivation of the liberalisation. More specifically, in the early 1990’s, many countries in Europe and the United States experienced a structural overcapacity inherited from the monopolies. In such a situation, generation assets were not used at their optimal operating durations, leading to a paradoxical situation with increasing generation costs and decreasing short-term marginal costs due to the overcapacity. Hence, the liberal-isation of the sector was seen as a great opportunity to reduce the electricity bill of large consumers through their direct participation to wholesale markets. In that sense, in most countries, the liberalisation of the power sector was primarily motivated by the introduction of competition in short-term operations and less attention was paid to long-term efficiency (Joskow,1997).
The reform of the electricity sector was focused on the four activities of generation, transmission, distribution and retailing which consists in the commercial relationship with final consumers (Jamasb and Pollitt,2005,Borenstein and Bushnell,2015). Trans-mission grids as well as local distribution grids, considered as natural monopolies, were therefore separated from generation and supply activities seen as potentially competi-tive activities. In principle, the four aforementioned activities are to be performed by separate companies. In practice, the unbundling of transmission and distribution grids is not always clear-cut on the one hand, and generation and supply tend to be partly vertically integrated on the other hand.
Besides, the market design and the industrial structure of liberalised power systems can be diverse depending on the institutional legacy particular to each country. More importantly, this architecture is still under construction and is expected to evolve in response to the current and future trends on both generation and demand sides. Fu-ture power systems can involve smaller decentralised units under policies promoting the development of variable renewable plants (windpower, photovoltaics) with new oppor-tunities to adapt the electric demand to real-time signals. Historically, the interaction between generation, transmission, distribution and supply was mainly organised in a “one-way direction” from the generation to the transmission, distribution and finally to the supply. However, this structure is largely likely to evolve due to the increasing role of distributed energy sources which could completely change the consumer paradox and the role of self-generation in the future.
This general organisation of liberalised power systems based on the unbundling of the different activities is supposed to create incentives for efficiency and innovation motivated by competition. In this context of different activities of the value chain being fulfilled by independent entities, electricity markets should ensure the twofold short-term and long-term coordination function.
The twofold coordination function of electricity markets
In liberalised power systems, coordination mechanisms are needed to ensure the sound functioning of the four activities (generation, transmission, distribution and supply) operated by separate unbundled companies with several competing producers. In this
context, energy markets have emerged as the central element of the coordination of generators upstream and suppliers downstream. At the same time, the market design of liberalised power systems also encompasses sub-markets to offer specific products (balancing, ancillary services) to the Transmission System Operator (TSO) in order to guarantee system reliability in the real time, while providing locational price signals for generators. Thus, electricity markets should ensure the coordination of operating actions in the short-term and the long-term coordination of investments in generation and, to a lesser extent, transmission. Firstly, in the short-term, energy markets guarantee efficient operations of existing plants and demand response. Secondly, price signals indicate scarcity (or surplus) of capacity for the different technologies and thus, guide investors’ long-term investment (respectively retirement) decisions. In theory, short-term and long-short-term market coordination signals are consistent under the assumption of pure competition, perfect information and no risk aversion. However, as developed further in this dissertation, different market failures can be identified.
Short-term coordination of operating actions
In the short-term, the use of different plants spanning several technologies should be organised according to both technical and economic considerations. To this end, short-term electricity markets aim at coordinating the different participants in order to serve the demand at least cost while respecting the operational constraints of electricity sys-tems.
The day-ahead electricity market is considered as the first element2 of the
opera-tional coordination of power systems through the selection of the plants according to the merit-order of the different operators’ bids on the hourly3 markets. Then,
balanc-ing and ancillary services markets allow for real-time adjustments to the evolutions of the electricity system. The short-term electricity prices can be structured on nodal or
2Generally, intra-day electricity markets can be considered as a continuation of the day-ahead elec-tricity market.
zonal basis to reflect local scarcities of transmission capacity4. More specifically,
short-term power markets can be analysed through the identification of four building blocks (Hogan,1998,Stoft,2002,Saguan et al.,2009): (i) forward energy market which gener-ally corresponds to both day-ahead energy markets and intraday markets, (ii) forward transport market, (iii) forward reserve requirements and finally (iv) the real-time block which mainly refers to the balancing and ancillary services markets. Each of these blocks has several organisation options leading to a variety of power markets’ architectures.
Long-term coordination function of energy markets
On longer horizons, economic signals coming from energy markets are supposed to trigger investment decisions in new generation units eventually including demand response. In particular, wholesale electricity markets are supposed to guide new investments in different technologies by “creating rents to support fixed investment costs in a relatively small number of hours” (Joskow,2006b). The recovery of fixed investment and operating costs is ensured by the so-called “infra-marginal rent” which refers to the difference between the variable costs of the considered generator and the hourly price aligned on the bid of the marginal generator. The anticipation of these future rents is supposed to trigger investment decisions in the different technologies including peaking units despite the fact that they will only run during the few hours5 of extreme peak demand, varying
from one year to another. In doing so, the long-term coordination of power systems by electricity markets aims at guaranteeing the capacity adequacy which is defined as “the ability of the electric system to supply the aggregate electrical demand and energy requirements of the end-use customers at all times” (NERC,2016).
Investments in generating capacities are generally characterised by a capital-intensive cost structure6, an irreversible one-step process and a long payback period, which are
4Generally, electricity prices are nodal in the US and zonal in Europe. More precisely, in almost all European countries, day-ahead electricity prices are defined for the whole country; except in Italy where there are six market areas, in Norway where there are five market areas and in Sweden where there are four market areas. In most other European countries, the zonal day-ahead price is defined for each hour of the following day and it respects some technical constraints of power units that are translated in the bids of electricity producers. Then, the networks constraints are taken into account into real-time balancing markets. On the contrary, electricity markets in the US directly define nodal electricity prices that reflect technical constraints of power generation units and networks’ constraints.
5These extreme peak demand period during which peaking units generate electricity are known as “scarcity period”.
6At least one technology cannot be considered as capital-intensive: Combined Cycle Gas Turbine (CCGT).
all to be decided with a high level of long-term uncertainties (Olsina et al., 2006). In liberalised power systems, there is no long term guarantee of cost recovery as it was generally the case before the liberalisation reforms by construction of the retail prices, as pointed out above. Consequently, investments are confronted to a more risky environment, thus a threat of under-capacity on the long-term. However, it should be noted that only two decades after the liberalisation of the European electricity sector, the experience on the long-term investment signals remains insufficient when compared to the long lifetime of generating technologies (Green,2006).
This dissertation proposes to focus on the long-term coordination function of liberalised electricity markets and more specifically on investments in electricity generation. Indeed, long-term issues of electricity markets seem to have received less attention than short-term operations since the liberalisation reforms (Joskow, 1997) and continue to raise a number of legitimate questions (Cramton and Stoft,2006,Aïd,2010,Finon,2013).
Market failures in the long-term coordination function
un-der policy objectives: Present and future challenges
While energy markets are supposed to ensure the long-term coordination function of in-vestments, different market failures can be identified with regard to the ability of market signals to trigger investments. More precisely, incentives to invest in capital-intensive equipments are particularly restricted compared to other technologies that involve lower fixed costs. Among these capital-intensive equipments facing market failures, two spe-cific contexts can be identified for (i) peaking units which are essential for capacity adequacy, and (ii) Low-Carbon Technologies (LCT) and Renewable Energy Sources of Electricity (RES-E) which participate in the decarbonisation of the electricity sector.
Market failure to invest in capital-intensive equipments
The restructuring of electricity markets was based on the idea implied by Joskow and Schmalensee(1983) that if generators were not able to bear investments risks, the previ-ous vertical integration could be replaced by bilateral contracts between generators and retailers (or large consumers) through multilateral markets for spot trading and through
financial markets for hedging arrangements. This would suppose the completeness of markets including financial hedging products with long maturity (IEA and NEA,2007). However, Chao et al. (2008) show that restructuring based on unbundling and short-term market trading is not sufficient to hedge against all generation risks and thus they support that a balanced mixture of vertical integration (by long-term arrangements) and liberalised markets is superior to the two extreme situations, namely an energy-only market without long-term contracts on the one hand, and a vertically integrated utility monopoly on the other hand. Besides, in most countries, there is no financial market which could offer long-term hedging products to generators. Consequently, generators are incentivised to invest in equipments with low capital costs as for example Combined Cycle Gas Turbine (CCGT) rather than capital-intensive technologies7.
Specific market failure impeding investments in peaking units for guarantee-ing capacity adequacy
According to the peak-load pricing theory (Boiteux, 1949, Joskow, 1976), electricity markets should theoretically ensure that short-term scarcity situations during peak-load periods are reflected in wholesale prices, providing long-term signals for investments in different technologies. The implementation of scarcity pricing constitutes a recurrent issue of designing electricity markets. In particular, scarcity rents during few hours of extreme peaks or other exceptional situations should provide investment signals in favour of peaking units needed for long-term reliability. Thus, peaking units can be considered as particularly capital-intensive plants given that their investment cost is to be recovered on very few hours.
In this context, growing evidence suggests that current electricity markets fail to guar-antee supply reliability according to reliability criteria set by policy makers. Firstly, the implementation of price caps resulting from the political unacceptability of very high power prices constitutes a regulatory imperfection that leads to chronic revenues shortage for plant operators, known as the missing money in the academic literature. Secondly, risk aversion related to investing on the basis on very uncertain revenues dur-ing scarcity events can explain that investment in peakdur-ing units is lower than the level
7Roques et al.(2008) andRoques(2011) highlight this effect by modelling optimal portfolio choices. CCGT presents two main advantages for private investors: (i) a low initial up-front investment cost, but also (ii) a correlation between hourly market prices and variable cost, for a significant number of hours when CCGT is the marginal technology.
which ensures long-term reliability under risk-neutrality assumptions. Thirdly, adminis-trative procedures as the preventively use of reserves can further disrupt investments in peaking units (De Vries,2007, Joskow, 2008). In addition, the market failure to invest in peaking units is further amplified by the development of variable RES-E with low marginal costs (Cramton et al., 2013). Indeed, during peak periods, electricity gener-ated by RES-E at low variable cost displaces the merit-order curve to the detriment of peaking units whereas there is an additional risk of wind scarcity during these peak periods.
Specific market failure impeding investments in LCT and RES-E
Price signal emanating from the sole power market can fail to fully incentivise invest-ments in LCT and RES-E for several reasons identified in the academic literature (Jaffe et al.,2005,Hepburn,2006,Lehmann and Gawel,2013).
Firstly, non-mature8LCT and RES-E face specific investment difficulties caused by their
very high cost compared to other technologies and increased by the difficulty in bene-fiting from learning effects (Del Río and Unruh,2007,Negro et al.,2012). Secondly, in addition to investment risks worsened by a cost structure with a high share of invest-ment cost and low or zero variable cost, LCT and RES-E also face important political and regulatory risks exacerbated by the low credibility of the carbon price signal9
stem-ming from an emissions trading system (Grubb et al., 2008). Besides, additional risks exist for variable non-dispatchable RES-E because of their uncertain generation profile and its correlation with peak-load periods. Consequently, even in areas where a carbon price is implemented, investments in several LCT and RES-E are supported by specific mechanisms10 designed to guarantee long-term revenues and to reduce long-term risks
through transfer arrangements.
8Indeed, LCT and RES-E include several technologies with different levels of economic maturity: wind power, photovoltaic and biomass are almost mature technologies whereas marine energies are not mature yet.
9Market players’ perceptions of regulatory and policy uncertainties can also have a significant effect on the carbon price (Koch et al.,2014).
10For example, feed-in tariffs, feed-in premiums or green certificates are different specific mechanisms to promote RES-E technologies.
Present and future challenges for the long-term coordination function
The market failures related to the long-term coordination function of investments and the expected solutions to address them are bound to play a major role in the evolution of power systems. In particular, the development of distributed generation and innovations in digital devices could open up strong opportunities in the role of demand side and its potential participation to the balance of consumption and generation. Besides, electric-ity consumption is expected to be stable or decreasing in most developed countries11.
Combined with out-of market RES-E entries, it suggests that the value of conventional existing plants is likely to decrease, potentially causing early retirements and challenges for capacity adequacy and security of supply in the future.
In the following, this dissertation addresses two key long-term coordination issues: (i) investments in LCT and RES-E characterised by high fixed costs and low or zero variable costs, hence the complexity of investment decisions in electricity markets with marginal pricing, and (ii) capacity adequacy to guarantee supply reliability in any given situation in the context of mature electricity systems disrupted by entries of RES-E capacities with variable generation.
Research questions and methodology
Focusing on the generation function, this dissertation tackles long-term coordination issues in a liberalised electricity system by addressing two key research questions.
In a market design without specific support schemes, what carbon price can trigger market-based investments in variable renewables?
On the one hand, the current functioning of electricity markets raises legitimate ques-tions as to its ability to trigger investments in Low-Carbon Technologies (LCT) including in particular Renewable Energy Sources of Electricity (RES-E) which are characterised by high upfront investment costs and low or zero variable costs. However, climate change considerations and the willingness to achieve energy independence can explain that these
particular technologies should be encouraged from a social point of view. In this con-text, many LCT and RES-E are currently supported by out-of-market mechanisms in many countries. Usually, these specific supports to LCTs including RES-E consist in a guarantee of remuneration with a low level of risks for a long time period (commonly more than a decade).
On the other hand, these mechanisms, designed to boost the development of LCTs in-cluding RES-E, lead to the co-existence of two investment regimes: (i) a market based investment process for conventional technologies and (ii) an out-of-market investment process for many LCT and RES-E. While the long-term functioning of electricity mar-kets still raises a number of questions, the massive out-of-market entry of LCTs includ-ing RES-E increases both the volume-risk and the price-risk for conventional generatinclud-ing technologies under the market-based investment paradigm and thus, further disrupts the long-term coordination of investments. This can be seen as a clear paradox from the economic perspective of liberalised electricity markets (Finon, 2013) which has to be tackled in order to ensure capacity adequacy of future power systems.
In this context, it seems reasonable to reconsider the support mechanisms to LCTs including in particular RES-E in order to estimate if it could be possible to shift to a unique investment regime that would apply to all types of generating technologies. This is precisely the first research question addressed in this dissertation. The objective is to assess whether the implementation of a carbon price (which is translated into an increase of the variable cost of each generating technology according to its emission factor) would trigger market-based investments in LCTs including RES-E.
How can a capacity mechanism enhance the capacity adequacy in a mature power system facing energy transition policies?
Another critical aspect of liberalised electricity systems is their ability to guarantee a socially-acceptable capacity adequacy. Indeed, it is still unclear whether liberalised elec-tricity markets can provide a sufficient level of elecelec-tricity supply (Hogan,2005,Joskow,
2008,Finon and Pignon,2008, Keppler,2014) as the former electric monopoly was in-tended to do before the reforms of most electricity systems. Moreover, this issue is even more crucial in the context of the current massive entry of intermittent RES-E as wind power and solar power which are characterised by an undispatchable electricity
generation. To address this long-term issue of capacity adequacy, different evolutions of the market architecture are suggested and analysed (Pérez-Arriaga,2001, De Vries,
2007). In particular, the different capacity mechanisms vary in their setting of capacity remuneration, technologies concerned and time horizon.
In this context, the question of capacity adequacy is raised in power systems facing energy transition policies which is translated into a massive entry of variable RES-E and a stable electricity demand thanks to efforts in energy efficiency. The objective is to quantify how different market designs, including the implementation of a capacity-wide capacity mechanism, can enhance the capacity adequacy and the resulting social welfare of power systems.
Besides, private investors in liberalised electricity markets are now facing significant uncertainties on the long-term evolution of supply and demand sides of power systems. Thus, considering risk aversion in investment decisions can tend to less installed capacity, thus a further disruption compared to the socially-optimal level of capacity. As a result, the generation mix can be more or less far from the socially-acceptable level of security of supply depending on the market architecture and the inherent level of uncertainties that is seen by investors. For this reason, this second research question is addressed in the context of risk-averse private investors in order to quantify how risk aversion affects the generation mix under the different studied market designs.
Methodology
In this dissertation, these research questions are tackled from the point of view of private investors in liberalised electricity markets with imperfect information on the future evo-lution of electricity demand. To do so, the adopted approach consists in a new System Dynamics model which has been developed for this purpose and which is called Simulator of Investment Decisions in the Electricity Sector (SIDES). The choice of this method-ological approach is justified by the importance given to the feature of private investors with (i) economic-based investment criterion with a certain level of risk aversion, (ii) myopic imperfect foresight, (iii) delay between investment decisions and commissioning of new power plants and (iv) the possibility to decommission existing power plants be-fore the end of their lifetime if they are not economically profitable. Besides, the System Dynamics approach is designed to focus on temporal evolution (rather than long-term
equilibria) and thus allows to observe and quantify how past decisions or exogenous decisions can influence the future evolution of electricity systems. This latter aspect is particularly relevant in the context of the current liberalised markets with inherited capacities and significant development of RES-E pushed by energy and climate policies.
Organisation of the dissertation
The first chapter analyses the long-term coordination function of electricity markets and the ongoing related challenges. In particular, this chapter addresses the issues of investments in Low-Carbon Technologies (LCT) and Renewable Energy Sources of Electricity (RES-E) and capacity adequacy, and summarises the state of the art of the literature on these topics.
The second chapter focuses on the modelling of investment decisions in electricity mar-kets with discussions on investment criteria, uncertainties, risk aversion and the different approaches to take these features into account in a long-term model of electricity sys-tems. Then, the chapter provides a detailed description of the System Dynamics model12
which is introduced as an analytical framework to tackle the two research questions. The third chapter focuses on the market-based development of LCTs including in particular RES-E with a stable carbon price known in advance, rather than specific support schemes as currently in most countries. On-shore wind power is chosen as a representative renewable technology because of its relatively mature development. Supposing the shift to a single market-based investment paradigm for RES-E as well as conventional plants, this chapter intends to assess how investments in wind power can be triggered by the market and to quantify the magnitude of the carbon price which would be needed. This chapter is based on a published article13.
The fourth chapter analyses the specific issue of capacity adequacy in the context of energy transition under different market designs: the energy-only with price cap considered as the benchmark and two reformed designs, namely the energy-only market with scarcity pricing and the addition of a capacity mechanism to the energy market
12The Simulator of Investment Decisions in the Electricity Sector (SIDES) was entirely developed from scratch for this PhD dissertation.
13Petitet, M., Finon, D., and Janssen, T., 2016. Carbon price instead of support schemes: Wind power investments by the electricity market. The Energy Journal, 37(4):109-140.
with price cap. The comparison is carried for different levels of risk aversion and for two different paths of energy transition including a path with exogenous closures of some coal and nuclear power plants. This chapter is based on a working paper14 and on a
conference paper15 which involves risk averse investor behaviours.
14Petitet, M., Finon, D., and Janssen, T., 2016. Ensuring capacity adequacy during energy transition in mature power markets: A social efficiency comparison of scarcity pricing and capacity mechanism. CEEM Working Paper no20.
15Petitet, M., 2016. Effects of risk aversion on investment decisions in electricity generation: What consequences for market design? In Proceedings of the 13th International Conference on the European Energy Market.
Long-term investment incentives
in liberalised electricity markets
* * *
The current debate on market design for the power sector cannot be dissociated from the issue of investments in electricity generation. The electricity sector has some specificities that make it particularly complex but fully interesting to study from an economic and technical point of view. In several countries, the power sector has seen a complex transformation from a central planner model to a totally liberalised organisation with private investors taking their decisions in a risky environment. Thus, this new paradigm completely changes conditions of decision-making process and raises new challenges for investments in electricity generation.
This chapter starts with an overview of power systems’ characteristics explaining the specificities of power markets in sectionI.1, before addressing the particular role of these markets for the long-term coordination of investments in sectionI.2. The chapter then discusses two key long-term issues of the generation function. Section I.3addresses the difficulties associated with investments in capital-intensive equipments in the context of environmental and climate policies. Then, section I.4 discusses long-term capacity issues and some design options to enhance the long-term efficiency of liberalised power systems.
I.1 Identifying and analysing the specificities of power systems . . . 15
I.1.1 Specificities of electricity demand . . . 15
I.1.2 Specificities of electricity supply-side . . . 17
I.1.3 Demand-response, a way to realign physical equilibrium and mar-ket equilibrium . . . 22
I.1.4 Defining electricity products based on the specificities of power systems . . . 24
I.2 Analysing the long-term coordination functions of electricity markets . . . 27
I.2.1 Long-term coordination of investments by electricity markets . . . 27
I.2.2 Limits of the long-term coordination by the energy-only market. . 30
I.3 Investments in capital-intensive equipments in the context of environmen-tal and climate policies. . . 36
I.3.1 Difficulties in investing in renewables and low-carbon technologies 37
I.3.2 Regulatory failures of the carbon pricing. . . 39
I.3.3 Out-of-market arrangements to support renewables and low-carbon technologies . . . 41
I.4 Capacity adequacy issues . . . 47
I.4.1 Defining capacity adequacy . . . 47
I.4.2 Alternative capacity mechanisms . . . 49
I.1
Identifying and analysing the specificities of power
sys-tems
Electricity is not a common commodity particularly because physical equilibria can dif-fer from economic equilibria of the market. This effect results from the limited storage capacities which cause the rigidity and price-inelasticity of the real-time supply on one side, and a specific commercial relationship with end-users through ex-post payments which partly explains the price-inelasticity of short-term demand on the other side. In practice, economic supply-demand equilibria come from hourly (or semi-hourly) markets whereas physical equilibria are managed independently by the system operator. Con-trary to most mono-product industries with one dominating industrial process, the power sector is characterised by a mix of different technologies in relation to the specificities of the demand and supply functions.
This section starts with a characterisation of electricity demand in subsectionI.1.1and of the supply-side in subsectionI.1.2, before discussing how demand-response could realign physical and economic equilibriums in subsectionI.1.3. Finally, subsectionI.1.4analyses how the different electricity products can be identified based on the specificities of power systems.
I.1.1 Specificities of electricity demand
Price inelasticity of electricity demand
Electricity use is more similar to a service or an intermediary good than similar to a final product. In that sense, when the electricity bill is to be paid after the consumption period and when it represents a small share of their revenues, small or medium-size consumers are quite insensitive to electricity prices. However, there is a distinction between short-term and long-term price elasticities of electricity consumption. In long periods, people can adapt their source of energy toward the one appearing to be the least expensive. Meanwhile, it is impossible for consumers to change the processes and appliances in short periods but it is possible on some occasions to modulate their electricity consumption (see I.1.3). In the economic literature, several studies aim at estimating the price elasticity of electricity. Lijesen(2007) proposes a synthesis of these
studies and points out the lack of real-time elasticity estimations. According to these estimations which were conducted in various contexts, the long-term price elasticity of electricity demand varies from -0.1 to -3.4 while the short-term price elasticity generally remains between -0.8 and 0. Although estimations are very different from a study to another, it confirms the intuition that the short-term price elasticity of electricity demand is much more limited than the long-term one. Therefore, the very low short-term price elasticity of electricity consumption can be identified as a driver for the high wholesale price spikes during extreme peak periods. It may also facilitate the exercise of market power, from the part of generators, to increase their net surplus during these hours (Kirschen,2003) eventually to recover the fixed costs of peaking plants.
However, large consumers should be distinguished from small consumers in particular in the price elasticity of their electricity consumption. Usually connected to the trans-mission network, large consumers are rather directly exposed to the wholesale market prices, and consequently they are more able to adapt their energy consumption to the large variations of hourly prices.
Variability of electricity demand
Electricity consumption in a given area significantly varies from year to year, from month to month and from hour to hour. These variations are generally not explained by the variations of hourly electricity prices. Indeed, electricity consumption is highly sensitive to at least three drivers: (i) the weather conditions1 which can drive some electrical uses
as lighting, cooling and heating devices, (ii) the economic activity which can influence the volume of electricity consumption and its shape, and (iii) the day of the week, the season and the hour of the day which can drive the level of consumption depending on the activities of consumers at that hour and thus it can influence the shape of electricity consumption.
1For example, in France, the electricity consumption increases by approximately 2,400 MW when the temperature decreases by one degree Celsius during the winter period (RTE, 2015). France is responsible for roughly half of the European consumption-temperature gradient of Europe in winter. This high variability of the French electricity consumption is partially explained by the high use of electric heating: between 2005 and 2009, more than 60% of new residential housing was equipped with electrical heating. In 2014, roughly 30% of new residential housing is still equipped with electric heating, among which two thirds correspond to heat pumps.
Thus, analysing a given power system needs to well represent the fluctuations of elec-tricity consumption. In particular, hourly data and a representative number of weather scenarios can be necessary.
I.1.2 Specificities of electricity supply-side
In order to serve the demand, the supply side of electricity markets is provided by electricity generation units – either large power plants or smaller decentralised ones – for the most part and by actions on the electricity demand to a lesser extent.
Electrical energy can be generated by several technologies from the conventional ther-mal power plants to the decentralised Renewable Energy Sources of Electricity (RES-E). Each thermal generating technology is characterised by at least two dimensions: (i) its costs among which social costs in terms of environmental impacts, and (ii) its specific operational constraints (start-up time, minimum running time, minimum downtime and gradients). To put it simple, peaking units have high variable costs, low fixed costs and fast start-up and shut-down times. Base-load units have low variable costs, high fixed costs and generally long start-up and shut-down times. Mid-load units have char-acteristics in between. As long as available storage facilities are limited, each of these generating technology is used when it is the most appropriate in terms of economic rel-evance and technical feasibility. On their part, RES-E generate electricity when their primary sources (for example wind, solar, waves) are available depending on weather conditions. Besides, this latter type of technologies is generally of smaller power capac-ity size and they can be decentralised and connected to the low-voltage network.
Operation of power plants under technical characteristics
A first distinction should be made between dispatchable and non-dispatchable power plants. A practical definition of the dispatchable character of power units is given by Joskow (2011): dispatchable units “can be turned on and off based primarily on their economic attractiveness at every point in time both to supply electricity and to supply network reliability services”. On the contrary, non-dispatchable or in other words variable generation units can only partially be controlled. Their available production is directly related to weather conditions such as wind speed, clouds or water flow. In
that sense, variable generation units can be disconnected from the grid if technologically feasible in specific situations2 but their generation level cannot be fixed at will.
Dispatchable technologies are mainly conventional thermal technologies and nuclear power. Each of those technologies has its proper technical constraints3: start-up time,
ramp rate, minimum running time, downtime and minimum stopping time. The dif-ferent dispatchable technologies also vary in their probability of forced outages. Forced outages are defined as the technical impossibility to generate electricity due to unplanned technology failures. Usually, technical maintenance works are planned by the plant’s op-erator in periods during which the power unit is not expected to generate electricity so that energy revenues are maximised and the functioning of the system is not disrupted.
Cost structure of generating units: towards defining the theoretical optimal technology mix
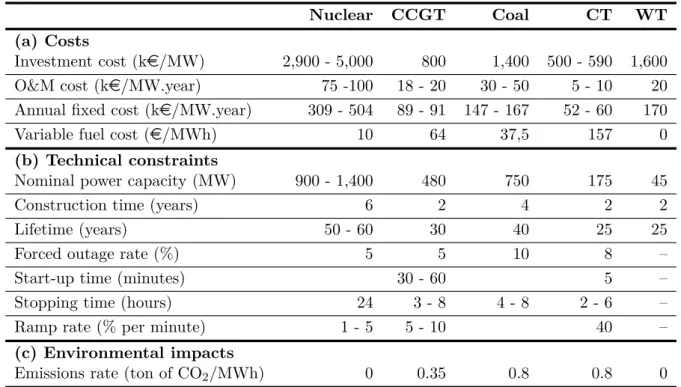
Each generating technology is characterised by its cost structure and in particular by the ratio between fixed costs and variable costs. The different costs of generating technolo-gies and the terminology used in this dissertation are precised in appendixA. Table I.1
summarises assumptions on technologies’ characteristics for four typical conventional technologies and one renewable technology: nuclear power plants (Nuclear), combined cycle gas turbines (CCGT), coal-fired power plants (Coal), oil-fired combustion turbines (CT) and wind turbines (WT).
When storage capacities are limited and given that there are several generating technolo-gies with different cost structures (and different operational characteristics), it would not be economically optimal to generate all the needed electricity by a single technology. In fact, serving the electricity demand at low cost can be achieved only through a com-bination of several generating technologies. Conceptually ,the optimal generation mix can be defined based on (i) the cost structures of the different technologies and (ii) the
2It could be relevant to disconnect variable generation units in at least two specific situations: (i) to manage local congestions and (ii) to balance supply and demand in case base-load units have operational constraints which prevent them from decreasing their generation.
Nuclear CCGT Coal CT WT (a) Costs
Investment cost (ke/MW) 2,900 - 5,000 800 1,400 500 - 590 1,600
O&M cost (ke/MW.year) 75 -100 18 - 20 30 - 50 5 - 10 20
Annual fixed cost (ke/MW.year) 309 - 504 89 - 91 147 - 167 52 - 60 170
Variable fuel cost (e/MWh) 10 64 37,5 157 0
(b) Technical constraints
Nominal power capacity (MW) 900 - 1,400 480 750 175 45
Construction time (years) 6 2 4 2 2
Lifetime (years) 50 - 60 30 40 25 25
Forced outage rate (%) 5 5 10 8 –
Start-up time (minutes) 30 - 60 5 –
Stopping time (hours) 24 3 - 8 4 - 8 2 - 6 –
Ramp rate (% per minute) 1 - 5 5 - 10 40 –
(c) Environmental impacts
Emissions rate (ton of CO2/MWh) 0 0.35 0.8 0.8 0
Sources: IEA and NEA(2010), DGEC (2008) andD’Haeseleer (2013) for details on nuclear.
Table I.1: Characterisation of the different generation technologies.
monotonous load duration curve4 which is a common simplified approach to analyse the
electricity demand. In practice, the generation mix should also allow for the generation of a sufficient volume of electricity in relation to electricity consumption in each period while complying with operational constraints.
The screening curves method is a classical and common approach to define the opti-mal generation mix for a given load duration curve under simplifications on the power units’ functioning (Stoft, 2002, Green, 2006). This method is related to the marginal cost pricing introduced by Boiteux (1949). As noted in Stoft (2002), this theory was developed in the context of regulated power systems but it is still relevant to get insights on competitive markets.
The screening curves approach proposes a graphical illustration of the problem of defin-ing an optimal generation mix. To do so, this approach needs assumptions on the cost of generating technologies and on the load duration curve to be served. The load duration
4The monotonous load duration curve corresponds to hourly electricity consumption sorted in de-scending order within a year. This simplified representation does not allow for a good understanding of the electricity demand within a year because it does not considers time relation between hours. How-ever, such a representation is sufficient to: (i) get an estimation of the operating periods for an existing generation mix or (ii) define “from scratch” an optimal generation mix for a given load duration curve.