OATAO is an open access repository that collects the work of Toulouse
researchers and makes it freely available over the web where possible
Any correspondence concerning this service should be sent
to the repository administrator:
[email protected]
This is an author’s version published in:
http://oatao.univ-toulouse.fr/23677
To cite this version:
Casasanta Garcia, Lucianne and Kamsu-Foguem, Bernard
BIM-oriented data
mining for thermal performance of prefabricated buildings. (2019) Ecological
Informatics, 51. 61-72. ISSN 1574-9541
BIM-oriented data mining for thermal performance of prefabricated
buildings
Lucianne Casasanta Garcia
a, Bernard Kamsu-Foguem
b,⁎aUniversidad Nacional de Rosario (UNR), Calle Riobamba 220bis, Rosario, Santa Fe, Argentina
bLaboratoire Génie de Production, Ecole Nationale d'Ingénieurs de Tarbes, 47 Avenue Azereix, BP 1629, F-65016 Tarbes, Cedex, France
A R T I C L E I N F O Keywords: Data mining Association rules Clustering Building information Green buildings A B S T R A C T
The use of energy efficiency procedures is a typical practice in building construction process that creates a huge amount of data regarding the building. This is particularly valid in structures which include complex colla-borations, for example, ventilation, sunlight-based increases, inner additions, and warm mass. This paper pro-poses a new approach for automating building construction when improving their energy efficiency, aiming to foresee comfort levels based on Heating, Ventilating, Air Conditioning (HVAC), constructive systems perfor-mance, environmental conditions, and occupant behavior. More specifically, it presents a research work about thermal performance of prefabricated construction systems developed by an Argentine enterprise called Astori, using two Knowledge Discovery in Databases (KDD) processes to extract knowledge. In this context, Building Information Modeling (BIM) will give data to support the calculation to outline goal levels of a sustainable building performance concerning classification systems. The data were collected from a project in Uruguay referring to the construction systems and the energy efficiency of the building. The data mining tool SPMF was used to test the performance of classification and its use in prediction. Particularly, FP-Growth Algorithm and Clustering methodologies were used to analyze a combination of ambient conditions, in order to compare them using Revit© software. The results generated by these methods can be generalized for a set of buildings, ac-cording to the objective to be achieved concerning the thermal building performance.
1. Introduction
In recent years, the construction industry has experienced a sharp increase in the production of buildings using prefabricated construction systems. It is also known that civil construction has evolved every day, new constructive technologies arise with the purpose of optimizing processes and being less aggressive to the environment. As of late, the energy consumption in buildings experienced a significant increase as a result of enlarged demands for thermal comfort and the increasing number of electrical equipment used. In a period characterized by the gradual acceleration of global warming and economic and environ-mental decline, energy efficiency is a strategic vector for sustainability. Clear comprehension of major impacting factors in performance-based building energy approach is an important procedure when de-termining thermal performance strategies. This production associated with the advancement of technology and the ability to digitally collect information increased the data and information storage of these buildings. The challenge may originate from a complexity of factors, such as climatic conditions or occupant behavioral patterns. Also, its
potential and its ability to adopt big data techniques have not been sufficiently studied (Oman, 2016). For this reason, construction was considered lagging behind the use of data technology compared to other industries. In order to manage this data, the introduction of BIM technology in the construction of operation and maintenance is cur-rently in progress (Peng et al., 2017).
It's important to balance the maximization of building energy po-tency associated users' desired level of comfort whereas using an eco-nomical building management system. Therefore, BIM plays a key role in construction automation and corresponding management systems. Despite the capability of BIM sanctioning its potential observe throughout building lifecycle phases, designers-contractors centered totally on the appliance of BIM throughout design-construction man-agement stages. Moreover, integration of knowledge manman-agement sys-tems empowers handling and sharing of building maintenance in-formation throughout the building lifecycle. This can be essential for post-construction property performance.
Much effort has been devoted to promoting the creation, sharing and integration of BIM as well as information and Knowledge
https://doi.org/10.1016/j.ecoinf.2019.02.012
⁎Corresponding author.
2. State of the art
It is recognized that buildings with high-performance technologies and systems can reduce building energy consumption by 50–70% or more. Currently, information technology is efficient for capturing, or-ganizing and storing large amounts of data. However, it cannot be said that the data stored in these databases are information or knowledge (Pichiliane, 2011). The knowledge arises when these data have some relations between them and can be interpreted to acquire meaning. This information is organized in order to generate a purpose of under-standing (Gonzalez and Zampirolli, 2014), and turning them into meaningful information is a task that requires capable processes.
The construction industry, including infrastructure and buildings, consumes 60% of the raw materials extracted from the lithosphere, 40% of which are for the building sector only (Zabalza Bribián et al., 2011). Several efforts have been made to improve construction standards to reduce the environmental impacts of buildings. These building perfor-mance frameworks include ongoing efforts to develop a building life cycle assessment system. Therefore, manifold tools and certifications have been developed, such as the LEED (Leadership in Energy and Environmental Design), focusing on environmental indicators and building aspects. A smart building makes trade-offs between building performance indicators (Augenbroe and Park, 2005). This involves the measurement and evaluation as well as the management of energy, lighting, thermal comfort, operational processes and maintenance ac-cording to the interests of the owners, operators, and occupants of the buildings (O'sullivan et al., 2004). Numerous categories for LEED cer-tification consist of design aspects, making it imperative for building designers to find the right combination of strategies (active and pas-sive). Active design strategies use energy-consuming mechanical sys-tems, while passive design strategies rely on natural energy sources. That is why high-performance buildings place importance on passive strategies while trying to downsize the active systems as much as pos-sible.
However, the energy efficiency targets/performance criteria for buildings are common to all the frameworks mentioned above, but they often lack quantifiable parameters that can be used to specify and monitor the energy performance of buildings. It should be noted that certification is based on information obtained prior to the operation of the building, based on data obtained during the design and the con-struction phase. The performance of the systems during the operation of the building is therefore not evaluated and does not affect the achievement of certification (Lessard et al., 2015).
Examples of various buildings (Zhou and Yang, 2016) demonstrate high variance in energy consumption patterns. There are diverse works using data mining tools for building performance related to building diagnostics, energy impact, satisfaction impact, and comfort impact. These studies (detailed inTable 1) show that occupants behavior have a significant impact on building energy consumptions. However, even though major studies concern energy impact as an important topic, a few studies have applied some direct position technologies to learn occupant behavior and assist building controls. The analysis was based on the research of (Ashouri et al., 2018) which categorize the influen-tial factors in building energy performance into four significant cate-gories: (i) Building Characteristics: all physical aspects of the building (e.g. material, insulation); (ii) System Efficiency and Operation: refers to space heating/cooling and hot water supply, pumps, fans, etc. (iii) Occupant Behavior: include their presence, activities and operation. (iv) Climatic Conditions: refers to outside temperature, solar radiation, humidity, and wind velocity. These authors explain that the evaluation methods currently available do not generally address the socio-cultural and economic aspects of sustainability, being directed towards the verification of energy efficiency and the environmental impacts gen-erated by the buildings. In this context, relating building performance measures to broader sustainability indicators presents a challenge for the area.
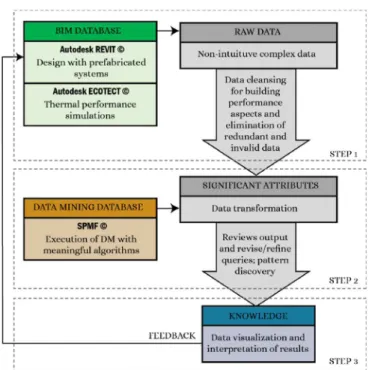
Fig. 1. The process of using the BIM concept DM techniques on the project. Management (KM) throughout the the lifecycle of an AEC project, whereas few paid their attention to knowledge extraction and re-presentation of BIM (Lin et al., 2013). The use of building, construction, waste and maintenance databases provides the background for using KDD and Data Mining (DM) techniques to increase the quality of future projects. In the design phase of the project initial metrics and objectives are generated, in the construction phase these data are updated by the commissioning tests and in the verification and maintenance step, the metric data is monitored in real time for performance evaluation. These technologies combine machine learning, artificial intelligence, pattern recognition, statistics, database, visualization techniques, and can help to automatically extract important concepts, interrelations, and models of the interest database. Present in several areas of study has become a tool of great utility for the various objectives related to the extraction of relevant information. Systematic management of knowledge can help in a better continuous improvement, sharing tacit knowledge, faster re-sponse to customers, dissemination best practices, reduction in rework (Carrillo and Chinowsky, 2006).
The decision to construct with a system can be established on a large number of attributes. As proven in previous researches (Delzendeh et al., 2017; Moyle et al., 2002), it is relevant to note how the choice of attributes impacts on occupant behavior and building energy analysis. For data validation to obtain metrics and key performance indicators, a building analysis of a project in Uruguay was used as input to further decision support and DM analyses. For this process (Fig. 1), three steps were adopted: (i) Organization and standardization of Autodesk Revit© and Autodesk Ecotect© model parameters for building performance aspects, eliminating redundant and invalid data. Autodesk Ecotect© consider these factors to model building performance, and Revit© considers the designed/simulated building energy performance. (ii) Execution of DM with significant a lgorithms. ( iii) A nalysis a nd re-presentation of the results obtained.
In Section 2, studies and related applications of BIM and DM building performance are reviewed. The next two sections present the clustering and the associative rule mining methods, respectively. Then a validation of the proposed approach using the project in Uruguay. The last section provides a discussion and a conclusion.
It is notable that in the studies presented in Table 1there is an absence of explanation in connection with the occupant behavior that regards the role of the user in the analysis methodology. Other re-searches indicate the need to review the evaluation parameters initially proposed. This is the case in the Netherlands, where it has been found that more efficient technologies generally reduce the prices of energy services, encouraging users to change their energy consumption (Visscher et al., 2013). In the United Kingdom, according toStevenson, 2013, the problem is centered on the absence of more concise studies on the usability of low carbon technologies. Thus, when these technologies do not meet the intended purpose - presenting defects in installation and operation, for example - a potential negative reaction to their adoption by the occupants is generated. Therefore, sustainability measures should be related to users' daily lives and to their expectations (in terms of cost, comfort, and safety). In this sense, in addition to ef-ficiency issues, this research aimed to identify the role of occupants in reducing environmental impacts, analyzing their habits and actions.
In order to understand the complex research problems and appli-cations in the area of Environment-Behavior, it was necessary to accept both quantitative and qualitative methods. In this sense, the application of several methods for the collection of different types of data on the same phenomenon allows to counterbalance the deviations/trends (bias) in a method with the deviations of the other methods used, since one can assume that the techniques used for each method have different deviations in those investigations. Such methodological improvement is justified in the sense of bringing possible solutions to the frequent problems in the area of building performance evaluation: (i) the effi-ciency of the evaluation results; (ii) the possibility of greater interaction between the researcher and the user in the evaluation; (iii) the reduc-tion of evaluareduc-tion costs; (iv) the effectiveness of tabulareduc-tion of evalua-tion results; (v) the capacity of the evaluaevalua-tion to constitute the process of transformation of the place. The analyzed attributes were evaluated individually (raw data) and aggregated (overlapping techniques and data crossing), to establish comparative and analytical patterns of the results obtained. The methodological procedures developed, as well as
the results, contribute effectively to the improvement of prefabricated buildings and their thermal performance.
For the application of the listed methods, specific softwares were used. A “data-driven” Decision Support System is useful for exploiting multidisciplinary data within a smart city setting, for example, Frequent Pattern Mining using the FP-growth algorithm may recognize unobserved patterns of energy consumption in relation to users' beha-vior or weather constraints, which can be verified from contextual in-formation concerning numerous diverse buildings (Marinakis et al., 2018). To facilitate the third-party verification for green buildings, data mining techniques were used to suggest a selection of target credits, particularly a methodology including classification models has been developed for the selection of target LEED credits based on project in-formation and climatic factors (Jun and Cheng, 2017).
The approach presented in this article represents a set of methods and techniques for evaluating performance in the use of buildings and built environments that considers not only the specialists' point of view but also the occupant satisfaction. This enables consistent and thorough diagnoses of the positive and negative aspects found in built environ-ments that will inform the recommendations and interventions for the case studies, as well as for future similar projects, thus defining a quality feedback loop in the design process. It is hoped, therefore, that this work can contribute with a more conscious practice of the design exercise, in that it inserts knowledge about the needs and desires of users as a fundamental part of the design process of any design pro-posal. In this paper, several data mining algorithms are compared and tested to build the occupant individual behavior and group schedule prediction models. The learned occupancy schedules are compared with the data used in LEED buildings. The Revit© model simulation results are compared between the Autodesk Ecotect© model to discover the energy impact of group schedules under different climate conditions.
3. Study case
To test the feasibility of the methods developed in this research, we
Studies Building
characteristics System efficiency andoperation Occupantbehavior Climateconditions
Zhang et al., 2018 X X X
On the feature engineering of building energy data mining.
Ding et al., 2018 X X
Building energy savings: Analysis of research trends based on text mining.
Sato et al., 2018 X
Data mining based on clustering and association rule analysis for knowledge discovery in multiobjective topology optimization.
Magalhães et al., 2017 X X X
Modeling the relationship between heating energy use and indoor temperatures in residential buildings through Artificial Neural Networks considering occupant behavior.
Fan et al., 2017 X X
Unsupervised data analytics in mining big building operational data for energy efficiency enhancement
Molina-Solana et al., 2017 X X
Data science for building energy management
Zhou et al., 2016 X X
Understanding household energy consumption behavior: The contribution of energy big data analytics.
Capozzoli et al., 2015 X
Fault detection analysis using data mining techniques for a cluster of smart office buildings.
Fan et al., 2015 X X
A framework for knowledge discovery in massive building automation data and its application in building diagnostics.
Lee and Malkawi, 2014 X X
An agent-based approach to model active behaviors.
Bonte et al., 2014 X
Impact of occupant's actions on energy building performance and thermal sensation. Table 1
4. Description of the proposed methodology
There are several surveys that prove the results of using data mining in architectural, engineering, and construction (AEC) project manage-ment. In the case of projects with a large volume of data, data mining methods are even more advantageous when it comes to data analysis. Data mining is one of them because it provides means (methods and techniques) for information and knowledge discovery from the data-bases in order to obtain decision making support for digitally stored data and is of great importance to organizations (Vissotto and Camargo, 2013). As in the building, many elements are considered for the cal-culation of its performance (Fig. 3). To limit the study, only thermal aspects and constructive systems were considered in this paper analysis. The data collected from the elements were compared to the char-acteristics generated through data mining. Subsequently, these were scaled in Revit© software to verify the authenticity of the knowledge generated.
4.1. SPMF tool
To manipulate and exploit large amounts of data, a tool that meets the desired goals is required. Currently, there are several alternatives that meet the operational needs of KDD. SPMF1is an open-source DM
library written in Java, specialized in pattern mining (the discovery of patterns in data), that comprises several algorithms of data preparation, mining, and validation of results. In order to complement the various forms of evaluation and analysis of the results, SPMF tool was used in this study, by means of two different instruments detailed in this article: (i) FP-Growth Algorithm and (ii) Clustering. The FP-Growth is an al-gorithm for discovering frequent itemsets in a transaction database. Is a very fast and memory efficient algorithm (Han et al., 2000) and it is
intended to identify strong rules discovered in databases. The clustering is the task of grouping a set of objects in such a way that objects in the same group (called a cluster) are more similar (in some sense) to each other than to those in other groups (clusters).
4.2. Association rule mining
Association rule mining is the following step of a process in which support and confidence are the reliability of the association rule. Due to its high performance and wide applicability, the FP-Growth (frequent-pattern growth) algorithm was used in this study to find frequent itemsets related to building elements and energy efficiency. In a recent update of the software SPMF in 8th January 2019, speedier and more memory productive calculations have been proposed. The database used to specify the relevant attributes (Table 2) was elicited from technical specifications of a residential project in Uruguay built with prefabricated elements. After applying the association rule mining to the dataset, 820 rules were extracted from 106 frequent itemsets and 12 transactions. A minimum 40% support and 60% threshold were used.
Table 3represents the room specifications codes used in the cal-culation of the FP-Growth Algorithm. Were considered as attributes the specifications regarding an energy efficiency project in AEC, as well as the Astori construction systems used in every area. In this study case, there is three types of Astori system: (i) Cerramientos Lisos (C.L.), (ii) Cerramientos Lisos y Losa Hueca (C.L. L.H.) and (iii) Modular.Table 4 represents the coding used for each itemset.
The outcome of an association rule mining algorithm is a group of association rules with a specified minsup and minconf thresholds. In the results, 7 important itemsets were annotated with its support and confidence. It can be seen in the results regarding the WALL_MATERIAL_EXTERNAL_CONCRETE (itemset 180) and the WALL_MATERIAL_INTERNAL_DRYWALL (itemset 190), both with a support of 12. Natural ventilation, a fundamental principle in the adoption of design strategies, could also be visualized among the items in the data mining of FP-Growth Algorithm. VENTILAT-ION_TYPE_NATURAL (Itemset 120) has a support of 7, justifying its importance in the project design. Through the results shown byTable 5, it was possible to observe that the items related to the constructive systems and the materiality are most frequent in the database of the project. Hence, it is concluded that the items mentioned above of ex-treme importance in the determination of design guidelines for the guarantee of the thermal comfort and the energy efficiency in the buildings.
Looking at extracted rules after using the FP-Growth algorithm, it is observed that some rules were generally expected, but others were hidden interrelationships among the itemsets that might not be iden-tified by other methods. Thus, one can observe the effectiveness of association rule mining. As an example, the rule FLOOR_TYPE_AND_COLOR_PVC_GREY (Itemset 131) ⇒ VENTILAT-ION_TYPE_NATURAL (Itemset 210), that has a support of 6 and con-fidence of 100%. The PVC vinyl floor, despite having a good thermal and acoustic performance, in this case, the color grey (which has an absorbance percentage of 71%, 48% less with a lighter color of the same material) implies the use of natural ventilation to guarantee the thermal comfort. This strategy only has an effect if the natural venti-lation through the internal spaces is restricted throughout the day, as the ventilation varies the internal temperature directly according to the external environment, without the thermal delay characteristic of the flow of heat through the floor, walls, and ceiling. Similar analyses can be used in the rule FLOOR_TYPE_AND_COLOR_PVC_GREY (Itemset 131) ⇒ FRAME THICKNESS_5CM (Itemset 171), VENTILAT-ION_TYPE_NATURAL (Itemset 210). As an important factor in de-termining the thermal performance of the project in question, it can be noted how the choice of the floor system, its materiality, and its color affect directly in design methods to improve the thermal comfort in the building. Because of the high absorbance of the material
1It can be downloaded athttp://www.philippe-fournier-viger.com/spmf/.
selected as a case study a single-family building constructed with pre-fabricated systems from the company Astori, located in the department of Maldonado, Uruguay (Fig. 2). This construction was chosen due to its similarities in relation to the research objects in BIM, as well as the previous contact of the researcher with the project, which would fa-cilitate the methodological application proposed by this article. The project has an area of approximately 280m2. The constructive systems
and the building thermal performance were compared with the results generated by mining of data and scaled through the Revit software, according to technical standards.
Considering the evaluation method carried out in the project in question, it is possible to observe the existence of two interdependent moments in the present work: (i) Application of the evaluation instru-ments for the collection of data concerning to the building condition, evaluation of behavioral, functional, technical-environmental and aes-thetic-formal aspects; (ii) Systematization of the obtained data and in-ferential analysis of research results in order to foster methodological reflections for improvements in the product (building) and also in its process (design).
The building consists of 14 rooms with different purposes. It was designed with an overall daylight factor of 5%. This will facilitate a room with enough natural light. The façade was designed to balance the daylight with relevant solar gain and overheating. The design for labs and offices differ slightly. The glazing is coordinated with the overall room layout. A solar control glass is fitted at the ground level, with a transmission rating of 20%, limiting glare to avoid full window blinds. The data warehouse (DW) is the central repository for storing and processing the building's performance data. This provides more ideal performance data relevant to energy efficient sp ace us age an d facil-itates successful DM analysis, which allows a building performance analysis and diagnosis along with construction.
FLOOR_TYPE_AND_COLOR_PVC_GREY (Itemset 131), in addition to the need for passive strategies of natural ventilation VENTILAT-ION_TYPE_NATURAL (Itemset 210) to guarantee air quality, the project also has to consider an optimization of the wall thickness FRAME THICKNESS_5CM (Itemset 171), considering the material and its thermal conductivity, density, and specific heat for better thermal comfort.
The materiality of the openings was also considered important in the definition of thermal comfort strategies. When examining the as-sociation rules, we have the WINDOW_TYPE_DOUBLE_GLAZING (itemset 140) a material that, on the one hand, increases the energy efficiency of the building and on the other hand can reduce the air quality. The window comprises two glass window sheets isolated by a vacuum or gas-filled space to diminish warm exchange over a piece of the building envelope. Despite being called a passive system, natural ventilation has an active process when we deal with the envelope of a building. The occupants can control their comfort, and if there is human control, there is also human error. The use of glass and openings that are not designed for effective air inlet and outlet will not result in a satisfactory air renewal rate. A Harvard study indicates that green buildings offer a higher rate of air renewal and consequently a lower level of CO2 in the spaces. Thus, for the occupants, cognitive functions become higher when CO2 levels are reduced.
There is an increasing interest in the use of natural ventilation in project design due to savings in the electric power consumption, im-provement of air quality and reduction of environmental problems in buildings containing mechanical ventilation. And regarding the thermal comfort, the occupant's satisfaction is related to the heat balance be-tween their body and the environment. Through the association rule WINDOW_TYPE_DOUBLE_GLAZING (itemset 140) ⇒ VENTILAT-ION_TYPE_NATURAL (itemset 210), it can be observed the effects of choosing the façade materials for determining the thermal performance of the building. With the support of 7, this association rule indicates the importance of checking the comfort of occupants in spaces that have areas with a lot of glass. In buildings with large glazed facades, many design solutions show improvements in thermal comfort through the
use of brises, shutters and polyester films applied on the glass, to reduce dazzle caused by lighting and block UV rays, decreasing the absorption of heat. In the project concerned, it can be noted that these large glazed facades have involved passive cooling using natural ventilation to guarantee thermal performance and improve indoor air quality. Similar interpretations can be used in rule 140, 210 ⇒ 36. According toPalmer and Gentry (2012), glass makes up one of the largest complexities among building components, having a greater influence on thermal and visual comfort and energy consumption. A simple colorless glass transfers > 75% of the incident radiation and > 85% of the visible light, allowing great heat input into the building and assuming, under typical summer conditions, a high thermal load (Ashrae, 2009). When examining the association rules with the database from Autodesk Eco-tect©, the WINDOW_TYPE_DOUBLE_GLAZING (Itemset 140) had a very efficient performance in solar control and thermal insulation, as these reduce the heat gain from direct solar radiation through the opening. Hence, VENTILATION_TYPE_NATURAL (Itemset 210) well used in a building project, further enhancing energy efficiency and reducing energy costs.
In the case of rule 140, 171 ⇒ 131, in which is considered that WINDOW_TYPE_DOUBLE_GLAZING and FRAME THICKNESS_5CM im-plying the FLOOR_TYPE_AND_COLOR_PVC_GREY, it can be said that there is a direct relation between the choice of the constructive systems and their elements. The type and dimensions of the building envelope system were highly determinant in the choice of the floor system. For the envelope, precast concrete panels from Astori were used. The panels include solved the requirements of resistance to wind, fire and with thermal and hydraulic insulation. For intern divisions, the drywall was mainly used. Therefore, the choice of the constructive system con-tributed to the determination of the materials used externally and in-ternally.
When examining the association rule FLOOR_TYPE_AND_COLOR_ PVC_GREY (itemset 131), VENTILATION_TYPE_NATURAL (Itemset 210) ⇒ OCCUPANCY_AVERAGE_2 (Itemset 202), it can be observed how the strategies of thermal performance and project design are di-rectly related to occupant behavior. The strategies imply the air inside Fig. 2. Revit model of study case.
the room and all the heat transfer processes (convection, conduction, solar radiation, and infrared radiation) within the room and through the building envelope. Hence, it takes into consideration the heat transferred through walls, ceiling, floor and windows, and its implica-tions in occupancy and thermal comfort levels. Occupant behavior is recognized as a noteworthy contributing component in the performance gap among actual and simulated building energy consumption. That's down to occupancy (presence of occupants), to adaptive behavior (al-tering clothing level, ventilation, air movement), and non-adaptive behavior (the use of electricity, types of equipment). In the project, the thermal properties of FLOOR_TYPE_AND_COLOR_PVC_GREY (Itemset 131) suggested that design elements, such as a floor type and color, may have a significant impact on thermal comfort. As previously stated, the PVC vinyl floor has a high absorbance percentage, which implies the use of natural ventilation to guarantee thermal comfort. There are studies (Kim et al., 2012; Luo et al., 2015; Yatim et al., 2011) that discuss the effectiveness of different thermal comfort models in esti-mating thermal sensations in relation to ventilation types, in particular as regards the natural ventilation. As such, the VENTILAT-ION_TYPE_NATURAL (Itemset 210) is an important aspect for evalu-ating the efficiency of thermal comfort-oriented design strategies. In all the variants of the simulation model, it can be clearly seen averaged internal heat gains from occupancy, project design, material type and ventilation strategies implemented. As a result, the thermal comfort levels of a given space is strongly dependent on occupancy and occu-pant behavior, which must be studied and defined in a thermal comfort-controlled space due to their high effect on setting energy efficiency
targets and developing instruments to speed up behavior change in the building sector.
When analyzing association rule FLOOR_TYPE_AND_COLOR_ PVC_GREY (Itemset 131), WINDOW_TYPE_DOUBLE_GLAZING (Itemset 140), FRAME THICKNESS_5CM (Itemset 171) ⇒ VENTILAT-ION_TYPE_NATURAL (Itemset 210), there are two observations made. First, complementing the previous analyses, the choice of materials and systems for an efficient project determine the strategies (passive or active) used in the building. In this case, the choice of a floor, envelope type, and wall thickness implied in the strategy of natural ventilation to reduce the energy demand of HVAC systems, thus reducing buildings' energy consumption. And secondly, the choice of floor, window type, and frame thickness were linked to each other, since it is a prefabricated building and logically, both the wall and window modules, as well as the frame thickness, must be compatible with the floor system module. Although the double glazing (Itemset 140) improves occupants' visual comfort and reduces the lighting and heating energy consumption, it may result in large hot surface areas when exposed to intense solar radiation, thus affecting the thermal comfort. Therefore, this item has been linked to a passive design strategy (Itemset 210) to create a comfortable living environment, thus minimizing energy consumption. 4.3. Clustering
This section describes data collection, integration, and processing along with the calculations of occupants' thermal comfort and indoor daylight levels. To have a high range of different input values, data Fig. 3. BIM database filtering process, performing data mining and analyzing the results obtained.
from 10 rooms with different specifications were used. The physical specifications of these rooms were obtained from the BIM and are shown inTable 6. The proof of the calculation is generated by calcu-lating the area marked under the entire curve of the boundary of an environment and summing them together (calculating an integer around a closed contour). For each edge of a boundary, was calculated a number of (eY * dX). This number represents the area under an edge (the area between an edge and X-axis). The resulting areas are positive, if the edge is going towards the decrease X, and negative if it goes the other way. The top of the boundary contributes a positive area under the top of the boundary while the bottom contributes a negative value
by subtracting the area over the base. For linear segments, the areas marked are calculated as:
½ (x0 x1) (y0+y1)
In this equation, (x0, y0) and (x1, y1) are coordinates of the be-ginning of the segment and ordered endpoints with respect to the an-ticlockwise direction. For arc segments, the areas marked are calculated as:
R yc a0 cos a1 ½ R a1 a0
½ without 2a0 sin 2a1
(cos ) (
( )
2
+ +
Attributes Room specification
Room type Bath Hall Kitchen &
Dining Laundry Living Bath Bath Bedroom Bedroom Entry Hall MasterBath MasterBedroom Elevation 0.0 0.0 0.0 0.0 0.0 3.0 3.0 3.0 3.0 3.0 3.0 3.0 Orientation N/A North Ouest N/A East N/A N/A South South North South Ouest Width 1.5 6.0 6.0 2.1 6.0 1.7 1.7 3.0 3.0 6.0 2.3 6.0 Length 1.8 6.0 11.8 2.4 11.8 2.4 2.4 4.5 4.5 10.4 3.2 6.0 Area 3.0 24.0 73.0 5.0 70.0 4.0 4.0 14.0 14.0 30.0 7.0 27.0 Height 3.0 3.0 3.0 3.0 3.0 3.0 3.0 3.0 3.0 3.0 3.0 3.0 Window surface 0.0 11.0 72.0 0.0 15.0 0.0 0.0 4.0 4.0 7.0 4.0 7.0 Number of fixtures 1 2 4 1 4 1 1 2 2 2 2 3
System type C. L. C. L. C. L. L. H. Modular C. L. L. H. Modular Modular C. L. C. L. C. L. Modular C. L. L. H. Wall color White Wood White
matte White Wood White White Whitematte Whitematte Wood White Whitematte Ceiling color White White
matte Whitematte White Whitematte White White Whitematte Whitematte Whitematte White Whitematte Floor type and
color Whiteceramic PVC grey Whiteceramic Whiteceramic PVC grey Whiteceramic Whiteceramic PVC grey PVC grey PVC grey Whiteceramic PVC grey Window type N/A Double
glazing Doubleglazing N/A Doubleglazing N/A N/A Doubleglazing Doubleglazing Doubleglazing N/A Doubleglazing Glazing surface 0.0 11.0 72.0 0.0 15.0 0.0 0.0 4.0 4.0 7.0 4.0 7.0 Panel surface 9.0 61.0 147.0 15.0 195.0 12.0 12.0 38.0 38.0 83.0 17.0 74.0 Frame thickness N/A 0. 01 m 0. 01 m N/A 0. 01 m N/A N/A 0. 01 m 0. 01 m 0. 01 m N/A 0. 01 m Wall material
external Concrete Concrete Concrete Concrete Concrete Concrete Concrete Concrete Concrete Concrete Concrete Concrete Wall internal Dry walls Dry walls Dry walls Dry walls Dry walls Dry walls Dry walls Dry walls Dry walls Dry walls Dry walls Dry walls Occupancy
average 1 2 4 1 4 1 1 2 2 2 1 2
Ventilation type Artificial Natural Natural Artificial Natural Artificial Artificial Natural Natural Natural Artificial Natural
Table 3
Rooms' codes table for associative rules.
Attributes Room specification codes
Room type 1 2 3 4 5 1 1 6 6 2 8 7 Elevation 11 11 11 11 11 12 12 12 12 12 12 12 Orientation 25 21 23 25 24 25 25 22 22 21 22 23 Width 31 36 36 33 36 32 32 35 35 36 34 36 Length 41 45 47 42 47 42 42 44 44 46 43 45 Area 51 56 60 53 59 52 52 55 55 58 54 57 Height 70 70 70 70 70 70 70 70 70 70 70 70 Window surface 81 84 86 81 85 81 81 82 82 83 82 83 Number of fixtures 91 92 94 91 94 91 91 92 92 92 92 93 System type 101 101 102 103 102 103 103 101 101 101 103 102 Wall color 110 112 111 110 112 110 110 111 111 112 110 111 Ceiling color 120 121 121 120 121 120 120 121 121 121 120 121 Floor type and color 130 131 130 130 131 130 130 131 131 131 130 131 Window type 141 140 140 141 140 141 141 140 140 140 141 140 Glazing surface 150 153 155 150 154 150 150 151 151 152 151 152 Panel surface 160 165 167 163 168 161 161 164 164 166 162 166 Frame thickness 170 171 171 170 171 170 170 171 171 171 170 171 Wall material external 180 180 180 180 180 180 180 180 180 180 180 180 Wall internal 190 190 190 190 190 190 190 190 190 190 190 190 Occupancy average 201 202 203 201 203 201 201 202 202 202 201 202 Ventilation type 211 210 210 211 210 211 211 210 210 210 211 210 Table 2
In this equation, yc is the y-coordinate of the center of the arc, R is the radius of the segment and a0 and a1 are angles of the start and stop of the arc respectively. For segments that do not contain arcs, the straight lines are calculated numerically. The following output con-ventions are used: (i) Each output environment is its own coordinate system which is defined to be parallel to XY coordinates of the model but X the source is selected to be the leftmost corner of an environment while Y the origin is in the lower corner of the environment. (ii) Each environment is represented by a separate table that contains rows for each edge of the environment boundary. If the environment has interior boundaries, then the edges of them follow the outside environment boundaries in the same table. For each edge, there is a table row that contains a segment type, area under this edge, X and Y of the starting point, X and Y of the endpoint. If the edge is a circular arc, then the line contains radius, center-Y, and initial/final arc angles measured from the X-axis.Table 1presents the data used for each record, in addition to its properties used by the data mining tool.
All designs used in gathering have passed through the stage of technical analysis. This step aims to analyze all the charges that will be applied in the building through the simulation of models, as well as all the particularities of each project with its performance elements. In this ROOM TYPE
ROOM_TYPE_BATH 1
ROOM_TYPE_HALL 2
ROOM_TYPE_KITCHEN & DINING 3
ROOM_TYPE_LAUNDRY 4 ROOM_TYPE_LIVING 5 ROOM_TYPE_BEDROOM 6 ROOM_TYPE_MASTER BEDROOM 7 ROOM_TYPE_MASTER BATH 8 ELEVATION ELEVATION_GROUND FLOOR 11 ELEVATION_FIRST FLOOR 12 ORIENTATION ORIENTATION_NORTH 21 ORIENTATION_SOUTH 22 ORIENTATION_OUEST 23 ORIENTATION_EAST 24 ORIENTATION_N/A 25 WIDTH WIDTH_1.5 31 WIDTH _1.7 32 WIDTH _2.1 33 WIDTH _2.3 34 WIDTH _3.0 35 WIDTH _6.0 36 LENGTH LENGTH_1.8 41 LENGTH_2.4 42 LENGTH_3.2 43 LENGTH_4.5 44 LENGTH_6.0 45 LENGTH_10.4 46 LENGTH_11.8 47 AREA AREA_3.0 51 AREA_4.0 52 AREA_5.0 53 AREA_7.0 54 AREA_14.0 55 AREA_24.0 56 AREA_27.0 57 AREA_30.0 58 AREA_70.0 59 AREA_73.0 60 WINDOW SURFACE WINDOW_SURFACE_0.0 81 WINDOW_SURFACE_4.0 82 WINDOW_SURFACE_7.0 83 WINDOW_SURFACE_11.0 84 WINDOW_SURFACE_15.0 85 WINDOW_SURFACE_72.0 86 NUMBER OF FIXTURES NUMBER_OF_FIXTURES_1 91 NUMBER_OF_FIXTURES_2 92 NUMBER_OF_FIXTURES_3 93 NUMBER_OF_FIXTURES_4 94 SYSTEM TYPE SYSTEM_TYPE_CERRAMIENTOS LISOS 101 SYSTEM_TYPE_CERRAMIENTOS LISOS_AND_LOSA_HUECA 102 SYSTEM_TYPE_MODULAR 103 WALL COLOR WALL_COLOR_WHITE 110 WALL_COLOR_WHITE_MATTE 111 WALL_COLOR_WOOD 112
FLOOR TYPE AND COLOR
FLOOR_TYPE_AND_COLOR_WHITE_CERAMIC 130 FLOOR_TYPE_AND_COLOR_PVC_GREY 131 WINDOW TYPE WINDOW_TYPE_DOUBLE_GLAZING 140 WINDOW_TYPE_N/A 141 Table 4 (continued) ROOM TYPE GLAZING SURFACE GLAZING_SURFACE_0.0 150 GLAZING_SURFACE_4.0 151 GLAZING_SURFACE_7.0 152 GLAZING_SURFACE_11.0 153 GLAZING_SURFACE_15.0 154 GLAZING_SURFACE_72.0 155 PANEL SURFACE PANEL_SURFACE_9.0 160 PANEL_SURFACE_12.0 161 PANEL_SURFACE_15.0 162 PANEL_SURFACE_17.0 163 PANEL_SURFACE_38.0 164 PANEL_SURFACE_61.0 165 PANEL_SURFACE_83.0 166 PANEL_SURFACE_147.0 167 PANEL_SURFACE_195.0 168 FRAM THICKNESS FRAME THICKNESS_3CM 170 FRAME THICKNESS_5CM 171
WALL MATERIAL EXTERNAL
WALL_MATERIAL_EXTERNAL_CONCRETE 180 WALL INTERNAL WAL_MATERIAL_INTERNAL_DRY_WALLS 190 OCCUPANCY AVERAGE OCCUPANCY_AVERAGE_1 201 OCCUPANCY_AVERAGE_2 202 OCCUPANCY_AVERAGE_4 203 VENTILATION TYPE VENTILATION_TYPE_NATURAL 210 VENTILATION_TYPE_ARTIFICIAL 211 Table 5
– Results of data mining with the FP-Growth Algorithm by SPMF.
Itemsets Support Confidence 131 ⇒ 210 #SUP: 6 #CONF: 1.0 140 ⇒ 210 #SUP: 7 #CONF: 1.0 140,171 ⇒ 131 #SUP: 6 #CONF: 0.8571428571428571 140,210 ⇒ 36 #SUP: 5 #CONF: 0.0.7142857142857143 131,210 ⇒ 202 #SUP:5 #CONF: 0.8333333333333334 131 ⇒ 171,210 #SUP: 6 #CONF: 1.0 131 140,171 =≥ 210 #SUP: 6 #CONF: 1.0 Table 4
Room type Segment type Sub-area x0 y0 x1 y1 yc R a0 a1 Social Bath Linear 3 m2 1528 1799 0 1799 N/A N/A N/A N/A
Linear 0 m2 0 1799 0 0 N/A N/A N/A N/A
Linear 0 m2 0 0 1528 0 N/A N/A N/A N/A
Linear 0 m2 1528 0 1528 1799 N/A N/A N/A N/A Linear 3 m2 1528 1799 0 1799 N/A N/A N/A N/A Hall Linear 0 m2 3202 6330 3202 6280 N/A N/A N/A N/A Linear 20 m2 3202 6280 0 6280 N/A N/A N/A N/A
Linear 0 m2 0 6280 0 4821 N/A N/A N/A N/A
Linear −7 m2 0 4821 1430 4821 N/A N/A N/A N/A Linear −9 m2 1430 4821 3243 4821 N/A N/A N/A N/A Linear 0 m2 3243 4821 3243 2737 N/A N/A N/A N/A Linear 0 m2 3243 2737 3243 978 N/A N/A N/A N/A Linear 0 m2 3243 978 3243 0 N/A N/A N/A N/A
Linear 0 m2 3243 0 6202 0 N/A N/A N/A N/A
Linear 0 m2 6202 0 6202 280 N/A N/A N/A N/A Linear 0 m2 6202 280 6202 4900 N/A N/A N/A N/A Linear 0 m2 6202 4900 6267 4900 N/A N/A N/A N/A Linear 0 m2 6267 4900 6267 6330 N/A N/A N/A N/A Linear 19 m2 6267 6330 3202 6330 N/A N/A N/A N/A Kitchen & Dining Arc 3 m2 5000 3000 4000 3000 3000 500 0.00°° 180.00°°
Arc −3 m2 4000 3000 5000 3000 3000 500 180.00°° 360.00°° Linear 0 m2 11,798 2457 11,798 4440 N/A N/A N/A N/A Linear 0 m2 11,798 4440 11,798 4593 N/A N/A N/A N/A Linear 0 m2 11,798 4593 11,798 5948 N/A N/A N/A N/A Linear 0 m2 11,798 5948 11,798 6101 N/A N/A N/A N/A Linear 72 m2 11,798 6101 0 6101 N/A N/A N/A N/A
Linear 0 m2 0 6101 0 0 N/A N/A N/A N/A
Linear 0 m2 0 0 11,798 0 N/A N/A N/A N/A
Linear 0 m2 11,798 0 11,798 2 N/A N/A N/A N/A Linear 0 m2 11,798 2 11,798 834 N/A N/A N/A N/A Linear 0 m2 11,798 834 12,000 834 N/A N/A N/A N/A Linear 0 m2 12,000 834 12,000 0 N/A N/A N/A N/A Linear 0 m2 12,000 0 12,498 0 N/A N/A N/A N/A Linear 0 m2 12,498 0 12,498 2375 N/A N/A N/A N/A Linear 1 m2 12,498 2375 12,000 2375 N/A N/A N/A N/A Linear 0 m2 12,000 2375 12,000 1764 N/A N/A N/A N/A Linear 0 m2 12,000 1764 11,798 1764 N/A N/A N/A N/A Linear 0 m2 11,798 1764 11,798 2457 N/A N/A N/A N/A Laundry Linear 4 m2 2176 2375 565 2375 N/A N/A N/A N/A Linear 1 m2 565 2375 0 2375 N/A N/A N/A N/A
Linear 0 m2 0 2375 0 0 N/A N/A N/A N/A
Linear 0 m2 0 0 2176 0 N/A N/A N/A N/A
Linear 0 m2 2176 0 2176 698 N/A N/A N/A N/A Linear 0 m2 2176 698 2176 2375 N/A N/A N/A N/A Living Linear 0 m2 6000 0 6000 11,720 N/A N/A N/A N/A Linear 36 m2 6000 11,720 2940 11,720 N/A N/A N/A N/A Linear 27 m2 2940 11,720 665 11,720 N/A N/A N/A N/A Linear 2 m2 665 11,720 496 11,720 N/A N/A N/A N/A Linear 6 m2 496 11,720 0 11,720 N/A N/A N/A N/A
Linear 0 m2 0 11,720 0 0 N/A N/A N/A N/A
Linear 0 m2 0 0 6000 0 N/A N/A N/A N/A
Bath Linear 0 m2 0 0 2376 0 N/A N/A N/A N/A
Linear 0 m2 2376 0 2376 1676 N/A N/A N/A N/A Linear 4 m2 2376 1676 0 1676 N/A N/A N/A N/A
Linear 0 m2 0 1676 0 0 N/A N/A N/A N/A
Bedroom Linear 0 m2 3224 0 3224 4500 N/A N/A N/A N/A Linear 15 m2 3224 4500 0 4500 N/A N/A N/A N/A
Linear 0 m2 0 4500 0 3852 N/A N/A N/A N/A
Linear 0 m2 0 3852 0 2116 N/A N/A N/A N/A
Linear −1 m2 0 2116 385 2116 N/A N/A N/A N/A Linear 0 m2 385 2116 385 1736 N/A N/A N/A N/A
Linear 0 m2 385 1736 385 0 N/A N/A N/A N/A
Linear 0 m2 385 0 3224 0 N/A N/A N/A N/A
Entry Hall Linear 0 m2 8981 4685 8981 0 N/A N/A N/A N/A Linear 0 m2 8981 0 11,905 0 N/A N/A N/A N/A Linear 0 m2 11,905 0 11,905 6115 N/A N/A N/A N/A Linear 18 m2 11,905 6115 8940 6115 N/A N/A N/A N/A Linear 0 m2 8940 6115 8940 6065 N/A N/A N/A N/A Linear 54 m2 8940 6065 0 6065 N/A N/A N/A N/A
Linear 0 m2 0 6065 0 4685 N/A N/A N/A N/A
Linear −14 m2 0 4685 3000 4685 N/A N/A N/A N/A Linear −12 m2 3000 4685 5495 4685 N/A N/A N/A N/A Linear −16 m2 5495 4685 8981 4685 N/A N/A N/A N/A
(continued on next page)
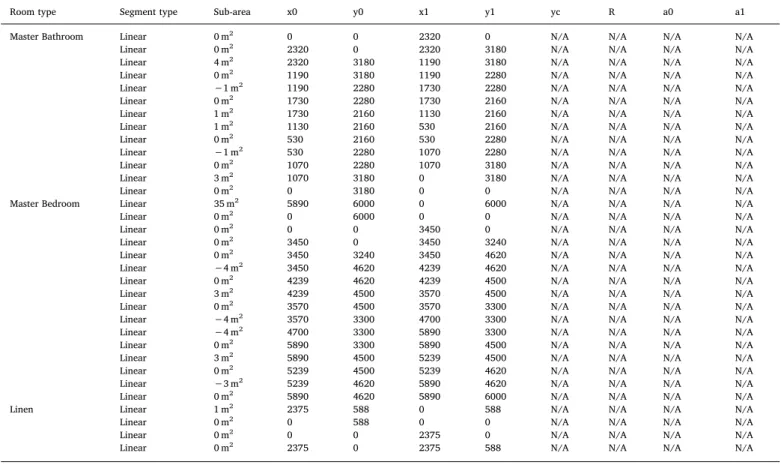
Table 6
study case, the areas of each room, their forms, and the interior and exterior openings were analyzed as attributes of clustering (Table 7).
Alvarez et al., 2010defend the need to optimize the consumption of environmental resources, without increasing the initial cost of con-struction, by designing solutions that provide natural ventilation and lighting. In this way, it becomes possible to reduce dependence on ac-tive cooling or heating systems. This study analyzed the segments of each room, their total area and the surface of windows, in order to separate a group of instances (vectors of double values) into teams of instances (clusters) in keeping with their similarity (Fig. 4).
In relation to the thermal comfort (ventilation, lighting, and tem-perature), satisfactory results were obtained, in which the majority instances described the places with low thermal comfort (red cluster). It is important to note the existence of low levels of satisfaction for all the criteria analyzed in this study case, suggesting the evaluation of existing problems together with other aspects that interfere in such perceptions
-such as the solar orientation. Through the analysis carried out by Autodesk Ecotect©, in view of the international standards of building labeling, the target measure is room temperature which is strongly correlated with room air temperature. To identify rooms with low en-ergy demands for future usage, historical weather data were needed. These include temperature, humidity, light level, total and diffuse ra-diation, outlook, wind direction, and speed. The data classification was carried using training and test data sets. Adjustments were carried out to determine the most optimal division between test and training data sets.
Room type Segment type Sub-area x0 y0 x1 y1 yc R a0 a1 Master Bathroom Linear 0 m2 0 0 2320 0 N/A N/A N/A N/A
Linear 0 m2 2320 0 2320 3180 N/A N/A N/A N/A Linear 4 m2 2320 3180 1190 3180 N/A N/A N/A N/A Linear 0 m2 1190 3180 1190 2280 N/A N/A N/A N/A Linear −1 m2 1190 2280 1730 2280 N/A N/A N/A N/A Linear 0 m2 1730 2280 1730 2160 N/A N/A N/A N/A Linear 1 m2 1730 2160 1130 2160 N/A N/A N/A N/A Linear 1 m2 1130 2160 530 2160 N/A N/A N/A N/A Linear 0 m2 530 2160 530 2280 N/A N/A N/A N/A Linear −1 m2 530 2280 1070 2280 N/A N/A N/A N/A Linear 0 m2 1070 2280 1070 3180 N/A N/A N/A N/A Linear 3 m2 1070 3180 0 3180 N/A N/A N/A N/A
Linear 0 m2 0 3180 0 0 N/A N/A N/A N/A
Master Bedroom Linear 35 m2 5890 6000 0 6000 N/A N/A N/A N/A
Linear 0 m2 0 6000 0 0 N/A N/A N/A N/A
Linear 0 m2 0 0 3450 0 N/A N/A N/A N/A
Linear 0 m2 3450 0 3450 3240 N/A N/A N/A N/A Linear 0 m2 3450 3240 3450 4620 N/A N/A N/A N/A Linear −4 m2 3450 4620 4239 4620 N/A N/A N/A N/A Linear 0 m2 4239 4620 4239 4500 N/A N/A N/A N/A Linear 3 m2 4239 4500 3570 4500 N/A N/A N/A N/A Linear 0 m2 3570 4500 3570 3300 N/A N/A N/A N/A Linear −4 m2 3570 3300 4700 3300 N/A N/A N/A N/A Linear −4 m2 4700 3300 5890 3300 N/A N/A N/A N/A Linear 0 m2 5890 3300 5890 4500 N/A N/A N/A N/A Linear 3 m2 5890 4500 5239 4500 N/A N/A N/A N/A Linear 0 m2 5239 4500 5239 4620 N/A N/A N/A N/A Linear −3 m2 5239 4620 5890 4620 N/A N/A N/A N/A Linear 0 m2 5890 4620 5890 6000 N/A N/A N/A N/A
Linen Linear 1 m2 2375 588 0 588 N/A N/A N/A N/A
Linear 0 m2 0 588 0 0 N/A N/A N/A N/A
Linear 0 m2 0 0 2375 0 N/A N/A N/A N/A
Linear 0 m2 2375 0 2375 588 N/A N/A N/A N/A
Table 7
Coding used for data mining Clustering.
ROOM TYPE SEGMENTS OF WALLS AREA WINDOW AREA SOCIAL_BATH 4 3 m2 N/A HALL 14 24 m2 11 m2 KITCHEN_DINING 19 73 m2 72 m2 LAUNDRY 6 5 m2 N/A LIVING 7 70 m2 15 m2. MECH 5 2 N/A ENTRY_HALL 10 30 m2 7 m2 BATH_1 4 4 m2 N/A BEDROOM_1 8 14 m2 4 m2 BATH_2 4 4 m2 N/A BEDROOM_2 9 14 m2 4 m2 MASTER BATHROOM 13 7 m2 4 m2 MASTER BEDROOM 16 27 m2 7 m2 LINEN 4 1 m2 N/A
Fig. 4. Clustering analysis regarding the 42 instances from the study case. Table 6 (continued)
5. Conclusion
The quickly developing and the enormous assemblage of stored information in the construction industry, combined with the require-ment for data analysis, has created an urgent need for powerful tools that can extract valuable knowledge of building performance en-hancement from numerous datasets. In this regard, data mining is an advantageous and potent instrument that can extract valuable knowl-edge in an enormous amount of data. It certainly meets the require-ments for a more integrated approach of applicable knowledge dis-covery in the construction field. It has been proven that the uses of information technologies (Kamsu-Foguem et al., 2019;Abanda et al., 2017;Kamsu-Foguem and Abanda, 2015) have helped the optimization of tasks in the area of architecture, engineering, and construction (AEC). Therefore, for the broad understanding of the data analysis process generated by AEC industry, stakeholders have data mining techniques as an important tool to obtain useful knowledge in order to facilitate critical reasoning and ensure building performance. Regarding this article, the results obtained through these tools are an important instrument for construction agents, especially architects and engineers, as they can be effectively applied to support the elaboration of future projects.
The objective was to analyze the use of data mining and all the concepts that encompass could inform through a database collected on existing projects and already validated, what the ideal composition of a structural element considering the existing scenario data. It demon-strated what type of profile to use in a given situation, is easily inter-preted, yielding to the user speed in the process, prediction of events, besides having a high percentage of confidence in its results and among other characteristics that will aid in the resolution of problems. Then, check that the element raised by the data mining could be used in a real case of panel analysis, which used a project as an object of study to perform scaling through software.
In view of the results obtained, it can be said that the process can be applied to other types of elements and for other constructive systems, because they rely on only the data and how they are organized. Other reviews in the database of structural elements can be made, you only need to apply other techniques and data mining tasks. In addition, the results can be used as performance assumptions, since they already inform what is the ideal profile for a particular situation. This makes the process more agility and avoids possible errors of interpretation. Therefore, it can be affirmed that the aim of this work was achieved according to the tests conducted and the results obtained.
Thinking about building in all its stages is of fundamental im-portance to ensure the quality of the built environment. The partici-pation of users in this process guarantees not only better attendance of their needs, but also enables the establishment of qualitative guidelines for future construction. A probable justification for so many indices of dissatisfaction in the study case evaluated refers to the repetition of tripartite typologies (in the social, intimate and service sectors). However, there are several transformations that society has undergone since such a model was initially conceived and the introduction of in-novative technologies and equipment in the residential environment, leading to the emergence of other forms of domestic leisure, changes in the notions of privacy and individuality and the transfer of work ac-tivities to living spaces. Thus, as a consequence of not attending to the new functions of the domestic environment, changes are often made in the buildings, when the construction system, the materials, and the project are flexible to the new demands. Therefore, for any building plan to be effective, one must consider the complex articulation be-tween laws, social and functional changes, land regularization, archi-tectural and urban planning, and the beneficiaries, evaluating all these aspects not only from a quantitative point of view but mainly from the qualitative perspective.
The quantitative evaluation followed a structure with dichotomic (yes/no), trichotomic (yes/no/do not know) and multiple-choice items
with a semantic differential scale (use of a scale of values). The ana-lyzed attributes were evaluated individually (raw data) and aggregated (overlapping techniques and data crossing), in order to establish com-parative and analytical patterns of the results obtained.
From the above, it is clear that the provision of projects adapted to the needs of the user depends on a series of factors to ensure the energy efficiency of the building. The characteristics of the site of implantation (its dimensions and climatic conditions), the systems and materials used, the openings according to the orientation of the building and the characteristics of the public to which the project will be destined should be considered. Only from this information can it guarantee the final quality of the buildings offered. Finally, it is believed that the product of these evaluative actions can structure positive agendas in the future of green buildings, integrating the active role of each agent in the process of its production and guaranteeing a building energetic effi-ciency.
Acknowledgments
This work was jointly funded by the financial support of CONICET (Consejo Nacional de Investigaciones Científicas y Técnicas) of Argentina and ENIT (Ecole Nationale d’'Ingénieurs de Tarbes) of Université de Toulouse of France through the “Soutien à la Mobilité Internationale (SMI) with grant IDs : ENIT-SMI-KFB-CGL-2018.
References
Abanda, F.H., Kamsu-Foguem, B., Tah, J.H.M., April 2017. BIM – New rules of mea-surement ontology for construction cost estimation. Eng. Sci. Technol. Int. J. 20 (2), 443–459.
Alvarez, A., Brasileiro, A., Silva, O., 2010. Estudo de proteção de fachadas em diferentes orientações para protótipo habitacional sustentável. In: Encontro Nacional de Tecnologia do Ambiente Construído, 13., 2010, Canela. Anais do XIII ENTAC, Canela, pp. 1–10.
American Society of Heating, Refrigerating and Air-Conditioning Engineers, 2009. ASHRAE handbook: Fundamentals. American Society of Heating, Refrigeration and Air-Conditioning Engineers, Atlanta, GA.
Ashouri, M., Haghighat, F., Fung, B.C.M., Lazrak, A., Yoshino, H., 2018. Development of building energy saving advisory: A data mining approach. Energy Build. 172, 139–151.
Augenbroe, G., Park, C., 2005. Qualification methods of technical building performance. Build. Res. Inf. 159–172.
Bonte, M., Thellier, F., Lartigue, B., 2014. Impact of occupant's actions on energy building performance and thermal sensation. Energy Build. 76 (0), 219–227.
Capozzoli, A., Lauro, F., Khan, I., 2015. Fault detection analysis using data mining techniques for a cluster of smart office buildings. Expert Syst. Appl. 42 (9), 4324–4338.
Carrillo, P., Chinowsky, P., 2006. Exploiting knowledge management: the engineering and construction perspective. ASCE J. Manag. Eng. 2–10.
Delzendeh, E., Wu, S., Lee, A., Zhou, Y., 2017. The impact of occupants' behaviours on building energy analysis: a research review. Renew. Sust. Energ. Rev. 80. Ding, Z., Li, Z., Fan, C., 2018. Building energy savings: analysis of research trends based
on text mining. Autom. Constr. 96, 398–410.
Fan, C., Xiao, F., Yan, C., 2015. A framework for knowledge discovery in massive building automation data and its application in building diagnostics. Autom. Constr. 50, 81–90.
Fan, C., Xiao, F., Li, Z., Wang, J., 2017. Unsupervised data analytics in mining big building operational data for energy efficiency enhancement: a review. Energy Build. Gonzalez, Zampirolli, 2014. Sistemas Inteligentes e Mineração de Dados. Triunfal Gráfica
e Editora, Santo André.
Han, J., Pei, J., Yin, Y., 2000. Mining frequent patterns without candidate generation. In: Proceeding of the 2000 ACM-SIGMOD international conference on management of data (SIGMOD’00). Dallas, TX, pp. 1–12.
Jun, M., Cheng, J., 2017. Selection of target LEED credits based on project information and climatic factors using data mining techniques. Adv. Eng. Inform. 32, 224–236. Kamsu-Foguem, Bernard, Abanda, Fonbeyin Henry, June 2015. Experience modeling with
graphs encoded knowledge for construction industry. Comput. Ind. 70, 79–88. Kamsu-Foguem, B., Abanda, F.H., Doumbouya, M.B., Tchouanguem, J.F., June 2019.
Graph-based ontology reasoning for formal verification of BREEAM rules. Cogn. Syst. Res. 55, 14–33.
Kim, B., Mim, Y.-K., Kim, J.-H., 2012. The physical thermal environment for a learner-Centered comfort learning environment in summer: the comparison of PMV- and CSV-based thermal comfort conditions. Commun. Comput. Inf. Sci. 342, 347–353. Lee, Y., Malkawi, A., 2014. Simulating multiple occupant behaviors in buildings: an
agent-based modeling approach. Energy Build. 69, 407–416.
Lessard, Y., Anand, C., Amor, M.B., 2015. Environmental Performance of Green Building Certification Systems. In: 7th International Conference on Life Cycle Management,
Bordeaux, France. 30 août – 2 septembre 2015.
Lin, J., Hu, Z., Zhang, J., 2013. BIM oriented intelligent data mining and representation. In: Proceedings of 30th CIB W78 International Conference on Applications of IT in the AEC Industry, Beijing, China.
Luo, M., et al., 2015. Evaluating thermal comfort in mixed-mode buildings: a field study in a subtropical climate. Build. Environ. 88 (0), 46–54.
Magalhães, S.M.C., Leal, V.M.S., Horta, I.M., 2017. Modelling the relationship between heating energy use and indoor temperatures in residential buildings through Artificial Neural Networks considering occupant behavior. Energy Build. 151, 332–343. Marinakis, V., Doukas, H., Tsapelas, J., Mouzakitis, S., Sicilia, A., Madrazo, L., Sgouridis,
S., 2018. From big data to smart energy services: An application for intelligent energy management. Futur. Gener. Comput. Syst.https://doi.org/10.1016/j.future.2018.04. 062.In press, corrected proof. Available online.
Molina-Solana, M., Ros, M., Ruiz, M.D., Gómez-Romero, J., Martin-Bautista, M.J., 2017. Data science for building energy management: A review. Renew. Sust. Energ. Rev. 70, 598–609.
Moyle, S., Bohanec, M., Ostrowski, E., 2002. Large and Tall Buildings: A case study in the application of Decision Support and Data Mining. In: Proceedings of ECML/PKDD-2002 Workshop on Integrating Aspects of Data Mining, Decision Support and Meta-Learning Net.
Oman, B., 2016. Application of Data Mining and Big Data Analytics in the Construction Industry. Ohio State University.
O'sullivan, D.T., Keane, M.M., Kelliher, D., Hitchcock, R.J., 2004. Improving building operation by tracking performance metrics throughout the building lifecycle (BLC). Energy Build. 1075–1090.
Palmer, C.M., Gentry, 2012. T. A Better Distinction for Standard Specifications of Low-E
ambiental em habitações. O caso do Reino Unido. In: Villa, S.B., Ornstein, S.W. (Eds.), Qualidade ambiental na habitação: avaliação pós-ocupação. Oficina de Textos, São Paulo, pp. 359–378.
Visscher, H., Werf, E.V., Voordt, T.J.M., 2013. Eficiência energética no parque habita-cional holandês. In: Villa, S.B., Ornstein, S.W. (Eds.), Qualidade ambiental na habitação: avaliação pós-ocupação. Oficina de Textos, São Paulo, pp. 343–358. Vissotto, E.M., Camargo, A.B., 2013. Aplicativo de Mineração de Dados Aplicado em Base
de Dados Acadêmicas. Anais do EATI – Encontro Anual de Tecnologia da Informação e Semana Acadêmica da Tecnologia da Informação.
Yatim, S.R.M., et al., 2011. Thermal Comfort in Air-Conditioned Learning Environment, in 3rd International Symposium & Exhibition in Sustainable Energy & Environment. Zabalza Bribián, I., Capilla, A.V., Usón, A.A., 2011. Life cycle assessment of building
materials: Comparative analysis of energy and environmental impacts and evaluation of the eco-efficiency improvement potential. Build. Environ. 46 (5), 1133–1140. Zhang, C., Cao, L., Romagnoli, A., 2018. On the feature engineering of building energy
data mining. Sustain. Cities Soc. 39, 508–518.
Zhou, K., Yang, S., 2016. Understanding household energy consumption behaviour: The contribution of energy big data analytics. Renew. Sust. Energ. Rev. 56, 810–819. Coatings for Diverse Climate Conditions. PLEA, North Carolina at Charlotte USA. Peng, Y., Lin, J.-R., Zhang, J.-P., Hu, Z.-Z., 2017. A hybrid data mining approach on
BIM-based building operation and maintenance. In: Building and Environment. Pichiliane, M.C., 2011. Conversando sobre Banco de Dados. Cidade 198–219. Sato, Y., Izui, K., Yamada, eT., Nishiwaki, S., 2018. Data mining based on clustering and
association rule analysis for knowledge discovery in multiobjective topology opti-mization. Expert Syst. Appl.