Monitoring of a carbon anode paste
manufacturing process using machine vision
and latent variable methods
Thèse
Doctorat en génie chimique
Philosophiæ doctor (Ph.D.)
Résumé
Le procédé de réduction électrolytique Hall-Héroult est utilisé pour la fabrication industrielle d’aluminium primaire. Ce procédé nécessite l’utilisation d'anodes de carbone. L’uniformité de la qualité de celles-ci est un paramètre très important pour assurer la stabilité et des performances optimales des cuves d’électrolyse.
Malheureusement, les fabricants d'anodes sont actuellement confrontés à une augmentation de la variabilité des matières premières. Cette situation est due à une diminution de la disponibilité de matières premières de bonne qualité à faibles coûts. Pour compenser, les fabricants d'anodes doivent diversifier leur choix de fournisseurs, ce qui augmente la variabilité. Cependant, les usines ne sont pas préparées pour réagir à cette situation tout en maintenant une qualité d'anode stable. Cette situation est due, entre autres, à un manque de mesures quantitatives en temps réel de la qualité des anodes. Plusieurs exemples d’applications industrielles de vision numérique ont été présentés dans la littérature. Par conséquent, il existe une opportunité de développer un tel système pour obtenir une mesure non destructive et en temps réel de la qualité de la pâte d'anode. Le développement du capteur a été fait avec de la pâte et des anodes pressées à l'échelle laboratoire. Un ensemble de caractéristiques de texture d'images calculées à partir de la transformée en ondelettes discrète (DWT) et de matrices de cooccurrence de niveaux de gris (GLCM) ont été sélectionnées. Ces caractéristiques étaient sensibles aux variations dans la formulation et de la quantité de brai dans la pâte. Le capteur est aussi capable de détecter la quantité optimale de brai (OPD) pour différents cokes. Ensuite, la sensibilité et la robustesse du capteur ont été testées avec de la pâte industrielle.
Finalement, les usines collectent déjà beaucoup de mesures de procédé en temps réel. Ces données peuvent être utilisées dans une stratégie de monitorage statistique pour détecter et investiguer des déviations de qualité. Une nouvelle méthode statistique multivariée par variables latentes PLS multi-blocs séquentiels (SMB-PLS) a été développée pour améliorer l'interprétation des données industrielles par rapport aux méthodes usuelles de PLS multi-blocs. Cette méthode a également été utilisée pour discuter de la pertinence d’utiliser les caractéristique d'image de la pâte à un modèle statistique pour la surveillance de la variabilité du procédé.
Abstract
The Hall-Héroult electrolysis reduction process used for the industrial aluminium smelting relies on the consumption of carbon anodes. The quality and consistency of these anodes are very important for the stability and performance of the reduction cells.
Unfortunately, the anode manufacturers currently face an increase in the raw material variability. This is due to the declining availability of high quality, low cost and consistent materials on the market forcing the anode manufacturers to diversify their suppliers.
However, the anode plants are not prepared to compensate for this increase in variability and still maintain consistent anode quality. There is a lack of real-time quality monitoring and control of the baked anodes properties and the most important raw material and process parameters.
Machine vision applications have been successful in many industrial applications. Therefore there is an opportunity to develop such a system to obtain a non destructive and online measurement of the anode paste quality. This sensor could then be used in a feedback/feedforward control strategy for attenuating the unmeasured raw material and process variations.
The sensor development was performed using laboratory scale paste and pressed anodes. A set of image texture features computed from discrete wavelet transform (DWT) and gray level co-occurrence matrix (GLCM) methods were selected. These features could capture variations in formulation, pitch ratio in the paste and in pitch demand. The sensor was also found to be sensitive to the optimum pitch demand (OPD) of two different cokes. Then, the sensitivity and robustness of the sensor was tested using industrial paste.
Finally, the anode plants already collect some real-time process measurement and off-line raw material and baked anode properties that can be used to monitor and troubleshoot process and quality deviations. A new sequential multi-block PLS (SMB-PLS) method was developed to improve the interpretation of complex industrial dataset compared to already available multi-block PLS methods. This method was also used to discuss the relevance of adding real-time paste image feature to a statistical model for monitoring of the process variability.
Contents
Résumé ... iii Abstract ... v Contents ... vii Table list ... ix Figure list ... xi Acknowledgments ... xix Chapter 1 Introduction ... 1 1.1 Aluminium manufacturing ... 1 1.2 Anode manufacturing ... 21.3 Anode raw materials ... 4
1.4 Anode fabrication process ... 5
1.5 Anode properties ... 8
1.6 Problems ... 10
1.7 Objectives ... 15
1.8 Thesis organization ... 17
Chapter 2 Latent variable methods ... 19
2.1 Principal Component Analysis (PCA) ... 19
2.2 Projection to Latent Structures (PLS) ... 22
2.3 Data scaling ... 24
2.4 Number of latent variables (A) ... 24
2.5 Model interpretation tools ... 27
Chapter 3 Image texture analysis ... 29
3.1 Machine vision ... 29
3.2 Digital image ... 30
3.3 Image texture analysis ... 31
3.3.1 Gray level co-occurrence matrix (GLCM) ... 32
3.3.2 Wavelet texture analysis (WTA) ... 37
Chapter 4 Experimental ... 47
4.1 List of softwares ... 47
4.2 Laboratory anode fabrication ... 47
4.2.1 Industrial raw material formulation ... 47
4.2.2 Laboratory raw material formulation ... 49
4.2.3 Laboratory anode fabrication ... 51
4.2.4 Industrial paste sampling ... 53
4.3 Image analysis methodology ... 54
4.3.1 Description of the imaging set-up ... 54
4.3.2 Description of the image analysis methodology ... 55
Chapter 5 A new Multi-block PLS algorithm including a sequential pathway ... 61
5.1 Introduction ... 61
5.2 Description of the multi-block methods ... 66
5.2.1 Multi-block PLS (MB-PLS) ... 66
5.2.2 Sequential Orthogonal PLS (SO-PLS) ... 68
5.2.3 Proposed algorithm: the Sequential Multi-block PLS (SMB-PLS) ... 69
5.3 Description of the dataset used for the case studies ... 71
5.3.1 Simulated data from film blowing process ... 71
5.3.1.1 First case – No correlation between raw materials and process data ... 72
5.3.1.2 Second case – Correlation between raw materials and process data ... 73
5.4 Results and discussion ... 75
5.4.1 Selecting the number of components ... 75
5.4.2 Results for the film blowing example ... 77
5.4.3 Industrial data from the anode manufacturing process ... 86
5.5 Conclusion ... 100
Chapter 6 Paste image texture analysis ... 103
6.1 Introduction ... 103
6.2 Laboratory paste and anode experiments ... 107
6.2.1 Preliminary design on paste formulation ... 107
6.2.2 Detailed design on paste formulation ... 108
6.2.3 Pitch optimization experiments ... 112
6.3 Selection of preprocessing operations and image textural features ... 114
6.3.1 Dataset and criteria used for the comparative analysis ... 115
6.3.2 Choice of preprocessing ... 116
6.3.3 Choice of wavelet ... 119
6.3.4 Selection of textural features ... 120
6.4 Results ... 123
6.4.1 Preliminary design on paste formulation ... 123
6.4.2 Detailed design on paste formulation ... 127
6.4.3 Pitch optimization experiment anodes ... 134
6.5 Conclusion ... 138
Chapter 7 Industrial paste imaging ... 141
7.1 Introduction ... 141
7.2 Sampling and data synchronization ... 142
7.3 Datasets and results... 143
7.3.1 Normal operation ... 144
7.3.2 Paste plant start-up ... 149
7.3.3 Industrial pitch optimization experiments ... 153
7.4 Joint modelling of image features and paste plant data using SMB-PLS ... 165
7.5 Conclusions ... 171
Chapter 8 Conclusions and recommendations ... 175
8.2 Development of the machine vision sensor ... 175
8.3 Sensitivity and robustness to industrial paste ... 177
8.4 SMB-PLS algorithm ... 178
8.5 Recommendations ... 179
8.5.1 Multivariate monitoring and control ... 179
8.5.2 Real-time paste quality measurement ... 180
Bibliography ... 183
Table list
Table 1 – Typical dry aggregate particle size (Jones 1986) ... 5
Table 2 – Anode properties typically measured from core samples ... 9
Table 3 – GLCM features of the images in Figure 16 ... 36
Table 4 – Properties of the industrial coke used for the laboratory paste manufacturing .. 48
Table 5 – Particle size distribution (measured at the plant) for each material fractions ... 48
Table 6 – Properties of the industrial pitch supplied by ADQ for the laboratory anodes .... 49
Table 7 – Base mix formulation for the laboratory anode fabricated with the industrial raw materials ... 49
Table 8 – Laboratory coke aggregate formulation ... 50
Table 9 – Laboratory coke properties ... 50
Table 10- Laboratory pitch properties ... 51
Table 11 – Heat-up rate during the laboratory anode baking ... 53
Table 12 – Choice of GLCM distance L and comparison to the particle size distribution .. 59
Table 13 – Band pass size in period (i.e. spatial dimensions) for each decomposition level of the DWT ... 60
Table 14 – List of the Y variables used for the anode manufacturing dataset case study . 74 Table 15 – Formulations used in the first series of experiments aiming at varying the amounts of coke fines and pitch in the paste. ... 108
Table 16 – Changes in the paste formulation tested in the second set of experiments ... 110
Table 17 – List of experiments for the laboratory pitch optimization ... 113
Table 18 – Impact of adding contrast enhancement on PLS model statistics... 117
Table 19 – Impact of wavelet type and filter length on PLS model statistics ... 119
Table 20 – Impact of different combinations of textural features on PLS model statistics 121 Table 21 – PLS model statistics for changes in fines and pitch percentages in the paste formulation ... 124
Table 22 – PLS models statistics for the detail design on paste formulation ... 128
Table 23 – PLS model statistics for the pitch optimization experiments ... 135
Table 24 – Correlation coefficients between the paste formulation variables for the normal operation data ... 145
Table 25 – Statistics of the PLS models built on normal operation data ... 146
Table 26 – Sample number and elapse time since the first start-up sample ... 150
Table 27 – Statistics PCA model built on the paste plant start-up data ... 151
Table 28 – Changes implemented on pitch % set-point in the industrial pitch variations dataset ... 155
Table 29 – Correlation coefficients between the paste formulation variables for the experiments on pitch ratio ... 156
Table 30 – Coke and pitch properties for each pitch variation experiments ... 156
Table 31 – Statistics of the PLS model for the design of experiments on pitch ratio ... 160
Table 32 – Statistics of the GAD SMB-PLS model... 167
Table 33 – Performance statistics of the original dataset PLS model in cross-validation, prediction of the validation set and prediction of new data ... 194
Table 34 – Performance statistics of the new PLS model in cross-validation and prediction of the validation set ... 197
Figure list
Figure 1 – Cross section of a prebaked reduction cell technology (Courtesy of Alcoa) ... 2
Figure 2 – Anode manufacturing process flowsheet (Fischer et al. 1995) ... 3
Figure 3 – New anode assembly (Courtesy of Alcoa) ... 4
Figure 4 – Illustration of the difference in pitch demand for two paste mixes ... 7
Figure 5 – Schematic of a baking furnace section (Grégoire et al. 2013) ... 8
Figure 6 – Illustration of the different behavior of GAD and BAD as a function of pitch % . 12 Figure 7 – Effect of constant operating conditions ... 12
Figure 8 – Illustration of the effect of different raw material and processing conditions of the anode paste visual appearance: a) and b) 2 different industrial pastes and c) laboratory paste ... 15
Figure 9 – Schematic of the machine vision methodology for anode paste ... 16
Figure 10 – Schematic representation of PCA ... 20
Figure 11 – NIPALS algorithm for PCA ... 22
Figure 12 – Matrices of PLS ... 22
Figure 13 – NIPALS algorithm for PLS ... 24
Figure 14 – Schematic of the machine vision approach (Liu 2005; Duchesne 2010) ... 29
Figure 15 – Examples of GLCM matrices (Tessier et al. 2008) ... 32
Figure 16 – Two stone surfaces with different texture used for the GLCM features example (http://www.highresolutiontextures.com) ... 35
Figure 17 – Frequency band divisions of the DWT of a vector (one-dimensional signal) .. 40
Figure 18 – 2-D DWT decomposition a) schematics of the filter bank used at the jth decomposition and b) frequency distribution of the detail and approximation images (Liu & MacGregor 2007) ... 41
Figure 19 – Composite image of different textures (http://www.highresolutiontextures.com) ... 42
Figure 20 – Approximation and detail coefficients of the composite texture image: a) approximation at scale 3, b) comparison of the reconstructed detail at scale 1 for sub-images 1 and 7, c) comparison of the reconstructed detail at scale 1 and 3 of sub-image 5 and d) comparison of the direction sensitivity for the reconstructed detail at scale 1 of sub-image 2. ... 43
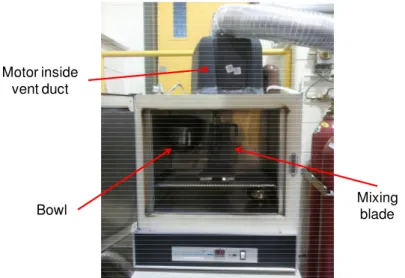
Figure 21 – Details of the mixer and oven for laboratory paste preparation ... 51
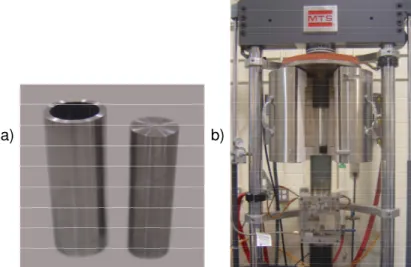
Figure 22 – Details of the press: a) cylindrical mold and dye and b) the press with the oven to control the pressing temperature (Azari Dorcheh 2013)... 52
Figure 23 – Laboratory baking furnace and baking box ... 53
Figure 24 – Imaging set-up installed at the ADQ industrial plant ... 54
Figure 25 – Image acquisition set-up ... 55
Figure 26 – Anode paste machine vision flowsheet ... 56
Figure 27 – Example of paste image: a) laboratory paste and b) industrial paste ... 57
Figure 28 – Results of the image pre-processing: a) low-pass filtered grayscale image, b) image after contrast enhancement and c) comparison of the intensity histogram for both images ... 58
Figure 30 – Illustration of the block order for an industrial process ... 61 Figure 31 – The MB-PLS algorithm for 2 regressor blocks (adapted from (Westerhuis et al. 1998)) ... 67 Figure 32 – The SO-PLS algorithm shown for 2 regressor blocks ... 68 Figure 33 – The SMB-PLS algorithm for two X blocks ... 70
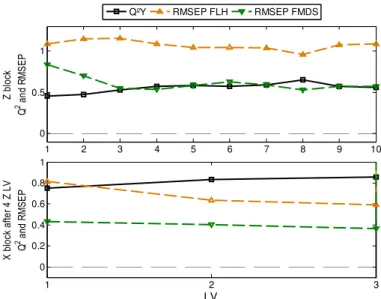
Figure 34 – Simulated end section of a film blowing process (adapted from (Duchesne 2000)) ... 72 Figure 35 – Data blocks collected from the anode manufacturing process (Modified from (Lauzon-Gauthier et al. 2012)) ... 74 Figure 36 – Q2Y and RMSEP statistics for selecting the number of components of the MB-PLS algorithm for case 1 (Z and X are orthogonal) ... 77
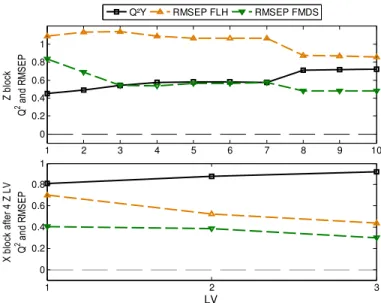
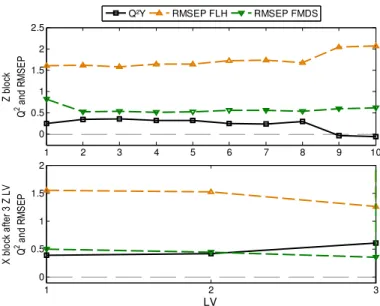
Figure 37 – Q2Y and RMSEP statistics for selecting the number of component of the SO-PLS model for case 1 ... 78 Figure 38 – Q2Y and RMSEP statistics used for selecting the number of component of the SMB-PLS model for case 1 ... 79 Figure 39 – Q2Y and RMSEP statistics used for selecting the number of component for the MB-PLS algorithm for case 2 ... 79 Figure 40 – Q2Y and RMSEP statistics used for selecting the number of components of the SO-PLS model for case 2 ... 80 Figure 41 – Q2Y and RMSEP statistics used for selecting the number of components of the SMB-PLS model for case 2 ... 80 Figure 42 – Explained Y variance for the three multi-block methods built on the film
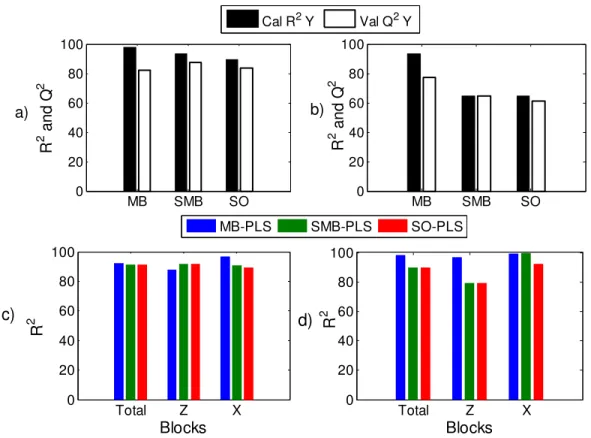
blowing datasets: a) case 1 and b) case 2. Z and X block variance explained and total (i.e.
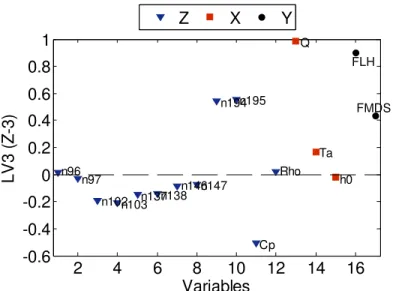
concatenated regressor blocks) variance explained: c) case 1 and d) case 2 ... 81 Figure 43 – Relative importance of each block by LV for: a) MB-PLS case 1, b) MB-PLS, case 2, c) SMB-PLS case 1 and d) SMB-PLS case 2 ... 84 Figure 44 – Loadings of Z, X and Y blocks in the 3rd
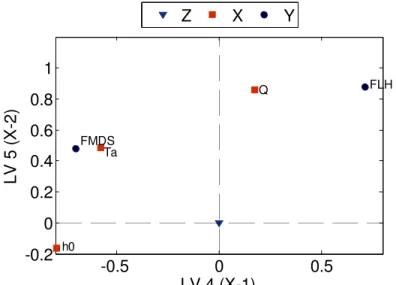
SMB-PLS component (Z-3) for case 2. ... 85 Figure 45 – Loadings of Z, X and Y blocks in the 4th and 5th SMB-PLS component (X-1 and X-2) for case 2. ... 86 Figure 46 – Selection of the number of LVs for the MB-PLS model computed from the anode manufacturing dataset: a) Q2Y and b) RMSEP for all Y variables ... 87
Figure 47 – Selection of the number of LVs for the SO-PLS model computed from the anode manufacturing dataset ... 87 Figure 48 – Selection of the number of LV for the SMB-PLS anode model ... 88 Figure 49 – Results obtained with the multi-block algorithms on the anode manufacturing dataset: a) R2Y and Q2Y for all methods, b) overall R2X by block for all methods, relative weights (bars) and block variance explained R2X (lines) by LV for c) MB-PLS and d) SMB-PLS ... 90 Figure 50 – Bi-plot of the block weights and Y loadings for first two components (Z-1 and
Z-2) of the SMB-PLS model built on the anode manufacturing dataset ... 91 Figure 51 – Amount of pitch used in the formulation as a function of the amount of coke fines particles for different raw material blends (combinations of coke and pitch suppliers) ... 94
Figure 52 – Z and X1 block weights bi-plot for LV1 and LV2 of MB-PLS ... 95 Figure 53 – Bi-plots of X2 block weights and Y loadings: a) LV 5 of MB-PLS and b) LV6 (X2-1) of SMB-PLS... 96 Figure 54 – Baking block (X3) scores and loadings bi-plot: a) PLS block scores, b) MB-PLS block weights for LV4-LV5, c) SMB-MB-PLS block scores and d) SMB-MB-PLS block weights for LV7-LV8 (X3-1 and X3-2). The blue and red markers indicate the anodes baked in the coldest and hottest positions in the furnace ... 97 Figure 55 – Comparison of the information mixing in MB-PLS and SMB-PLS models: a) super scores (LV1-LV2) of MB-PLS, b) super scores (LV1-LV2) of SMB-PLS, c) Z scores
(LV2-LV3) of MB-PLS and d) Z scores (LV2-LV3) of SMB-PLS ... 99
Figure 56 – Anode paste image... 105 Figure 57 – Baked and green anode density (BAD and GAD) for the pitch optimization anodes using cokes from two different sources (A and B) ... 113 Figure 58 – ∆BAD of the lab formulation anodes ... 116 Figure 59 – Scores of the PLS models for the lab formulated anodes: a) no contrast
enhancement and b) with contrast enhancement ... 118 Figure 60 – Score plots for the first two PLS components (LVs 1-2) of four models from Table 20: a) model 1, b) model 4, c) model 9 and d) model 7 ... 122 Figure 61 – Final image texture analysis procedure ... 123 Figure 62 – Scores and loadings weights of the PLS model (replicates averaged) for the case where fines and pitch variations were introduced in the paste formulation: a) LV1-LV2 scores, b) weights and loadings of LV1 and c) weights and loadings of LV 2 ... 125 Figure 63 – Reproducibility of the imaging sensor in the case of the preliminary design on formulation. The averaged LV1 and LV2 scores are shown for replicated samples along with their one standard deviation error bars ... 127 Figure 64 – Butts size distribution span ... 128 Figure 65 – Scores and loadings weights of the PLS model built on averaged replicated samples data for the case of the detailed design on formulation: a) X scores on LV1 and
LV2, b) Y scores on LV1 and LV2, c) weights and loadings of LV1 and d) weights and
loadings of LV2 ... 130 Figure 66 – Interpretation of the PLS model built using averaged replicated samples data for the case of the detailed design on formulation. Variations in the scores and associated contribution plots: a) and b) increase in the pitch ratio, c) and d) shot coke addition, e) and f) decrease in the fines ratio and g) and h) change from a coarser to a finer formulation 131 Figure 67 – Reproducibility of the imaging sensor in the detailed design on formulation. The averaged LV1 and LV2 score values are shown for a) image replicates and b) mix replicates along with their one-standard deviation error bars ... 134 Figure 68 – Comparison of the predicted and measured ∆BAD for the replicated averages model ... 135 Figure 69 – Scores and loadings of the PLS model (averaged replicates) for the pitch optimization experiments: a) LV1 scores , b) LV1 weights and loadings, c) LV2 scores and d) LV2 weights and loadings ... 136 Figure 70 – Scores of the 3rd and 4th components of the PLS model built on the pitch optimization dataset (averaged features) ... 137
Figure 71 – Reproducibility of the imaging sensor in the pitch optimization experiments. The scores of the first two components of the PLS model built on all samples are shown along with one standard deviation error bars ... 138 Figure 72 – Formulation variables for the normal operation industrial dataset: a) dry
aggregate % and b) pitch ratio ... 144 Figure 73 – First component’s scores (a) and loadings (b) of the PLS model (averaged replicate data) built on normal operation data of the ADQ paste plant ... 146 Figure 74 – Second component’s scores (a) and loadings (b) of the PLS model (averaged replicate data) built on normal operation data of the ADQ paste plant ... 147 Figure 75 – Third component’s scores (a) and loadings (b) of the PLS model (averaged replicate data) built on normal operation data of the ADQ paste plant ... 147 Figure 76 – Uncertainties in the scores of the PLS model built on normal operation data: a) LV1, b) LV2 and c) LV3. One standard deviation error bars on the scores are shown. ... 149 Figure 77 – Time series of a 5h plant start-up period: a) GAD and b) scores of LV1, LV2 and LV3 ... 152 Figure 78 – Scores and loadings of the PCA model built on the industrial paste start-up data (averaged image replicates): a) LV1 and LV3 score plot and b) LV1 loadings plot.. 153 Figure 79 – Changes in the formulation variables for the industrial dataset where pitch ratio was varied. The five sampling campaigns are indicated by letters A-E. ... 154 Figure 80 – Baked anode core properties: a) BAD for experiments C and E, b) electrical resistivity, c) compressive strength, d) CO2 reactivity residue (CRR) and e) Young’s
modulus ... 158 Figure 81 – Predicted versus measured pitch ratio obtained using the PLS model built on data collected during the design of experiments on pitch ratio (averaged replicates) ... 160 Figure 82 – Scores and loadings of the PLS model (averaged replicates) component 1 for the designed experiments on pitch ratio: a) LV1 scores, b) LV1 weights and loadings, c) scatter plots of LV1 scores and coarse % and d) scatter plots of LV1 scores and pitch % ... 161 Figure 83 – Scores and loadings of the PLS model (averaged replicates) component 2 for the designed experiments on pitch ratio: a) LV2 scores, b) LV2 weights and loadings and c) scatter plots of LV2 scores and pitch % ... 163 Figure 84 – Scores and loadings of the PLS model (averaged replicates) component 3 for the designed experiments on pitch ratio: a) LV3 scores and b) LV3 weights and loadings ... 164 Figure 85 – Uncertainties in the scores of the PLS model (all sample) for the data obtained during the design of experiments on pitch ratio): a) LV1, b) LV2 and c) LV3. One standard deviation error bars of the scores are shown in the figure. ... 165 Figure 86 – Data blocks and variables used in the SMB-PLS model for predicting GAD 166 Figure 87 – Relative contribution (bars) of each regressor block in the SMB-PLS model. The explained variance of each regressor block R2X (black lines) and of the Y block R2Y (gray line) are also shown ... 168 Figure 88 – Loading weights of the raw material properties (Z) in component LV Z-1 ... 169
Figure 89 – Block weights of LV Z-2: a) raw material (Z) and b) image features (X3) ... 170
Figure 91 – Model residuals: a) Hoteling’s T2 and b) prediction residual ... 194 Figure 92 – Residual contribution: a) Observation A, b) Observation b and c) Observation C of Figure 91 ... 196
Acknowledgments
For the last four years I have spent a significant amount of time working on this Ph.D. project. It was a very challenging but also rewarding period of my life. I am grateful for the support of many people and organizations and I would like to take this opportunity to express my gratitude to all of these important persons.
I am thankful for the financial support of Alcoa, the Fonds de recherche du Québec –
Nature et technologies (FRQNT), the Aluminum Research Centre – REGAL, NSERC,
Université Laval and Rio Tinto Alcan. With this support, I was able to focus my attention on my project and my family.
I would like to express my profound gratitude and respect for my supervisor, Dr. Carl Duchesne. You have given me all the tools, support and opportunities that I needed to accomplish this project and much more. With your guidance, I have become confident in my abilities and knowledge.
Special tanks to Dr. Jayson Tessier, your continued support of my project within Alcoa and your thoughtful inputs on the problems and results were invaluable.
The Université Laval chemical engineering department has been my home for the last ten years. I need to mention the contribution of the many people that support the students every day. Thanks to Dr. Alain Garnier, Ann Bourassa, Nadia Dumontier, Pierrette Vachon, Jean-Nicolas Ouellet and Yann Giroux.
I would like to thank the technicians and research assistants who helped me during my experimental work: Guillaume Gauvin, Donald Picard, Hughes Ferland and Vicky Dodier. I had a lot of fun working with you. I would also like to thank Jean-Phillip Giguère who helped me as an intern to fabricate numerous laboratory anodes and for the BAD measurements.
Many thanks to Kamran Azari Dorcheh and Francois Chevarin, this Ph.D. would have been much more difficult without your previous laboratory work on anode fabrication and your generous help in the lab. I also appreciated working with the MACE3 chair and RDC-anode groups: Geoffroy, Ramzi, Behzad, François G., Dave, Pierre-Olivier, Stéphane and the others.
Many folks within Alcoa have contributed to the success of this project. I have felt at home every time I went to the plant and I felt that you supported the project. This was important for me. Thanks to Francis-Joé, Isabelle, Réal, Romain, Christian, Marc, Katie, Don, John and the many operators who helped me during my experiments.
To my colleagues in the office, much of the day to day life in the department was shared with you and I enjoyed it very much. It was also a pleasure to share many activities with all of you. Thanks to Amélie, Pierre-Marc, Wilinthon, Alexandre, Jean-Pascal, Thierry, Mathias, Juliette, Karl, Simon, Corinne and Moez.
Massoud, thanks for your friendship and availability when we needed to discuss the latent variable methods or the interpretation of the results.
Finally, many thank to my family for the support during all these years, especially to my wife Marilou. I could not have completed a Ph.D., raise two beautiful kids, start my professional career and still have a normal life without you.
Chapter 1
Introduction
The aluminium industry is a very important component of the Canadian economy. In 2010, Canada was the third largest aluminium producer with 7% of the world production (source: International Aluminium Institute http://www.world-aluminium.org). It sustains approximately 10,000 direct jobs in the Province of Québec alone and injects 2.5 billion dollars per year in its economy (source: Association de l'aluminium du Canada http://ledialoguesurlaluminium.com).
There are some manufacturing challenges to address during the fabrication of the carbon anodes used to produce aluminium. The most important aspect in terms of smelters operation is the consistency of the anode quality. Unfortunately, anode manufacturers have to cope with increasing raw material variability and they are not adequately prepared to face this situation. To maintain consistent anode quality over time, carbon plants need to adapt the formulation and the processing conditions in response to the raw materials variations. However, the key raw material properties and process measurements are not available in real-time to implement such adjustment. This thesis focuses on issues related with real-time quality control of baked carbon anodes and the lack of fast and relevant measurements to cope with raw materials variability. New data-driven methods and non-destructive sensing techniques are proposed to improve process understanding, monitoring and control of the anode manufacturing process.
Some sections (i.e. 1.1 to 1.5) of this chapter are a reproduction with minor modifications and additions of the most important parts of the chapter 2 of the author’s M.Sc. thesis (Lauzon-Gauthier 2011). It is reproduced here to give the readers the necessary background of the manufacturing of industrial carbon anodes.
1.1 Aluminium manufacturing
The industrial production of primary aluminum is performed using the so-called Hall-Héroult process (Grjotheim & Kvande 1993). Basically, aluminum is obtained through the electrolytic reduction of alumina taking place within a typically large number of metallurgical reactors (reduction cells) electrically connected in series. The electrochemical reaction (shown below) involves dissolved alumina (in a cryolitic bath) and carbon as the reactants, and yields liquid aluminum and carbon dioxide (gaseous emission).
( ) ( ) ( ) ( )
2 3 diss s l 2 g
2Al O
+
3C = 4Al
+
3CO
1.1Figure 1 presents a schematic diagram of a pre-baked anode reduction cell, also called pot in the industry. A high electrical current (i.e. from 100 kA to 600 kA for current technologies (Tabereaux 2000; Charmier et al. 2015)) is passed through the cell, entering from the conducting rods and the baked carbon anodes, and exiting by the cathode block after passing through the cryolitic bath and the liquid aluminum pad. The anodes are immersed into a bath made of cryolite, a chemical that dissolve alumina. The reduction reaction takes place in the bath and liquid aluminium settles at the bottom of the pot. The metal is tapped on a daily basis to ensure a constant height of liquids (i.e. liquid aluminium and molten electrolytic bath) in the pot. Since the anodes are consumed by the alumina reduction reaction (equation 1.1), they need to be periodically replaced. During pot operation, the anodes are lowered continually as they are consumed to keep the anode to cathode distance (ACD) constant. When the anodes reach approximately 1/3 of their original size, they are replaced by new ones. The residual anodes, called butts, are recycled to produce new anodes.
Figure 1 – Cross section of a prebaked reduction cell technology (Courtesy of Alcoa)
1.2 Anode manufacturing
The anode manufacturing plant is a vital part of a smelter’s operation because it supplies one of the main raw materials for the aluminium reduction process (i.e. the baked carbon
New anode Alumina feeders Steel shell Conducting rod Spent anode Bath Molten aluminum Lining Cathode block
anodes). A typical process flowsheet is shown in briefly described in the following paragraphs
2000; Lauzon-Gauthier 2011; Azari Dorcheh 2013)
effect of raw material properties and process operation on anode quality
Figure 2 – Anode manufacturing process flowsheet
The anode raw materials consist of calcined petroleum coke, liquid coal tar pitch and recycled anode butts. The anode filler particles (e.g. coke and butts) are classified and ground into a desired particle size distribution. The mix of coke and butts is called the dry aggregate mix. The dry aggregate is than pre
(i.e. the binder) to obtain
anode block of specific dimensions using either
“green” anode. Finally, the green anode is baked in a furnace then attached to a conducting
A typical process flowsheet is shown in Figure 2 (Fischer et al. 1995) briefly described in the following paragraphs. The interested readers are referred to Gauthier 2011; Azari Dorcheh 2013) for a more detailed description effect of raw material properties and process operation on anode quality.
Anode manufacturing process flowsheet (Fischer et al. 1995)
The anode raw materials consist of calcined petroleum coke, liquid coal tar pitch and The anode filler particles (e.g. coke and butts) are classified and into a desired particle size distribution. The mix of coke and butts is called the dry aggregate mix. The dry aggregate is than pre-heated before it is mixed with
to obtain the so-called anode paste. The paste is then
anode block of specific dimensions using either a press or a vibrocompactor to obtain a Finally, the green anode is baked in a furnace. The baked anode block
conducting rod, and the assembly is finally ready to be
(Fischer et al. 1995) and is are referred to (Hulse descriptions of the
(Fischer et al. 1995)
The anode raw materials consist of calcined petroleum coke, liquid coal tar pitch and The anode filler particles (e.g. coke and butts) are classified and into a desired particle size distribution. The mix of coke and butts is called the dry it is mixed with liquid pitch then formed into an vibrocompactor to obtain a baked anode block is ready to be set in the pots.
Figure 3 – New anode assembly (Courtesy of Alcoa)
An anode assembly (i.e. baked anode and connecting rod) is presented in Figure 3. The aluminium rod is used to connect the anode assembly to the pots. The tripod is fixed to the anode by pouring cast iron in the stub holes gaps.
1.3 Anode raw materials
Calcined coke is manufactured from the residual heavy oil fractions of the petroleum refining industry. It is a low value by-product (i.e. waste) and therefore, refineries have no incentive to control and/or improve its quality. Therefore, the quantity, quality and price of calcined cokes available on the market vary significantly over time. This implies that carbon plants need to adapt to cokes having important differences in physical properties and chemical impurities from shipment to shipment (McClung and Ross 2000).
The following steps are required to transform heavy oil into coke: a delayed coking process yields the green coke and this process is followed by a calcining operation to produce the calcined coke of interest for the aluminum industry. Calcined coke quality is influenced by the calcining conditions and green coke quality which is influenced by crude oil quality, refining operation and delayed coking operation parameters (Fischer et al. 1995). Several papers describe the effects of oil quality, and process operation on green coke quality (e.g. (Fischer & Perruchoud 1985) and (Vitchus et al. 2013)).
Coal tar pitch (CTP) is the binder used for making the baked anodes for the aluminum industry. This pitch is produced from coal tar through a distillation process. Coal tar is a by-product of the metallurgical coke by-production from coal. The role of the pitch in the anode
Conducting rod
Tripod
recipe is to bind the dry aggregate together to enable forming the anode into a block of specific dimensions. It is also useful to fill some of the coke particle porosity. To obtain good mechanical properties after forming, the anodes are baked to transform the amorphous pitch into semi-crystalline coke.
Anode butts consist of the unconsumed portion of the anodes left after they are removed from the pots (typically about 1/3 of their original size). Anodes are not consumed completely to avoid metal contamination from the steel stubs. However, anode butts surfaces are contaminated by sodium and other contaminants from the anode cover material and frozen bath. Thus a cleaning step is required before the butts are stripped from the stubs. After cleaning and stripping, the butts are crushed, screened to the desired size distribution and stored in silos for use in the production of fresh anodes. This reduces the amount of waste materials and the amount of fresh coke needed to formulate the anodes. Butts constitute approximately 15-30% of the green anode formulation (Fischer and Perruchoud 1991).
1.4 Anode fabrication process
In the first step of the process, the dry aggregate particles (coke and butts) are pre-processed by screening and crushing. The finer coke particles are produce by milling some of the material in a ball mill as well as collecting the dust throughout the anode plant. The coke is usually classified in three distinct fractions: coarse, intermediate and fines. The butts, which are less porous than the coke, consist mainly of coarse material (Fischer et al. 1995). The typical particle size for each fraction is given in Table 1 (Jones 1986).
Table 1 – Typical dry aggregate particle size (Jones 1986)
The fineness of the fines size fraction is characterized by the Blaine number, which measures the particle surface area. Blaine number increases with decreasing particle size because the particle surface area increases for smaller sizes. Hence, it is used to characterize particles too small to be classified by sieve analysis. This parameter is usually closely monitored by the paste plant operators.
Particle size (US mesh) Particle size (µµµµm) Coarse -¼ in/+30 -6.3 mm/+600 Intermediate -30/+100 -600/150 Fine -100 -150 max 1 in max 25 mm Dry aggregate Coke
The dry aggregate blend is formulated using weight belts and is discharged in a pre-heating equipment. Dry aggregate temperature is raised to between 150 and 200°C (Hulse 2000) prior to adding pitch to the dry aggregate blend. Pitch is also pre-heated to a temperature ranging between 170 and 230°C (Hulse 2000) before it is incorporated in the dry aggregate mix to form the anode paste The temperature difference between the pitch and the dry aggregate is closely monitored to avoid partial solidification of the pitch on the coke particles when these are put into contact, which would hinder proper pitch penetration in the filler matrix and lead to a more heterogeneous paste. The paste is then fed into a mixer in order to evenly distribute the pitch within the dry aggregate and to ensure that the internal pores of the coke particles are filled with the binder. Mixing temperature is usually set between 155°C to 180°C. Anode quality generally increases with increased coke and pitch temperature up to the degassing temperature of pitch volatiles. The paste viscosity decreases with an increase in the temperature and this will improve the mixing, spreading and penetration of the binder matrix in the paste (Hulse 2000).
The paste’s pitch ratio is also of great importance. Under-pitched anodes will have insufficient mechanical properties leading to anode failure in the pots and high electrical resistivity due to a poor binding behaviour. Over-pitched anodes lead to slump formation (i.e. problems when forming the anodes), high weight loss, swelling and cracks formation during baking due to greater volatiles degassing, to packing material sticking also while baking and finally stub hole deformations (Mannweiler & Keller 1994; Hulse 2000). Pitch demand (i.e. appropriate amount of pitch for a given dry aggregate) is a function of the coke fines fraction and filler particle properties but also mixing temperature and duration. There exist an optimum between particle size distribution, formulation, mixing duration and temperature and pitch ratio (Belitskus 1978; Hulse 2000).
Optimum pitch demand (OPD) is defined by the amount of pitch needed to obtain optimum anode properties for a given type of coke, formulation and processing parameters. This is illustrated in Figure 4 where the baked apparent anode density (BAD), a key anode property, and the amount of pitch needed to reach the OPD are different for two paste recipes. It is shown in this figure that the BAD increases with pitch % up to the optimum. Then, adding more pitch becomes detrimental to the anode quality.
Figure 4 – Illustration of the difference in pitch demand for two paste mixes
In this thesis, the optimum pitch demand will often be defined using the baked anode apparent density (BAD). The BAD is used because it usually correlates well with the optimum of other anode properties (Belitskus 1978; Belitskus 1981; Belitskus 1993; Belitskus & Danka 1988; McHenry et al. 1998; Hulse 2000; Belitskus 2013). It is also straightforward to measure on small anodes (i.e. lab scale or core samples). Other properties such as electrical resistivity or any groups of properties can also be used to define the OPD (Hulse 2000).
Anode forming is performed either by pressing or vibro-compaction. The quality of pressed anodes depends largely on raw material properties and recipe. Vibrated anode quality depends also on raw material quality but is more sensitive to anode forming process parameters (e.g. paste temperature during vibro-compaction) (Hulse 2000). If the temperature is too high, the paste viscosity will be too low and the anode could collapse when taken out of the mold and a low temperature causing high viscosity will lead to improper compaction. How evenly the paste is distributed within the mold also has an impact on anode quality. Uneven distribution usually leads to anisotropic anode properties within the block.
Anode baking is typically performed using an open ring baking furnace. Details of the operation of this type of unit are provided in (Fischer et al. 1995; Keller & Sulger 2008). In brief, a section of the furnace is made of several pits (generally 6 or 7) where the anodes are staked vertically (e.g. 6 anodes large by 3 anodes high). The space between each pit (i.e. flue wall) is a cavity where natural gas and pitch volatiles are burned in order to supply heat to the anodes according to a pre-defined baking cycle. A schematic of a baking furnace section in provided in Figure 5 (Grégoire et al. 2013).
BAD
Pitch %
Paste 1
Figure 5 – Schematic of a baking furnace section (Grégoire et al. 2013)
Anode baking aims essentially at developing the mechanical properties of the anodes. The pitch needs to be cokefied in order to increase the anode mechanical strength to sustain the pot’s operating temperature (e.g. about 960°C). The heat-up rate, the final temperature and soaking time (e.g. amount of time the anodes are maintained at final temperature) are the most important baking parameters (Mannweiler & Keller 1994). Also, a minimal temperature gradient between the different positions within the furnace needs to be maintained to minimise the variability in the anode properties at different position in the furnace (Fischer et al. 1993). This is accomplished by an appropriate design of the baffles and flow path in the flue walls as well as adjusting the pressure and diameters of the burners to obtain an optimum flame profile. Additionally, some process parameters can also be adjusted. First, the under-pressure (i.e. to adjust the amount of oxygen in the flues) can be manipulated. Also, temperature profiles can be adjusted in response to variations in raw material (e.g. amount of volatiles in the pitch).
1.5 Anode properties
Anode quality is defined by a number of properties measured in the laboratory from core samples collected from a certain number of baked anodes according to a pre-defined sampling plan. These quality attributes (listed in Table 2) are grouped into four categories: physical properties, mechanical properties, reactivity and chemical composition (e.g. contaminants). Details on the laboratory analyses are available in (Fischer et al. 1995).
Anodes Coke
Refractories
Table 2 – Anode properties typically measured from core samples
The anode properties measured in the laboratory are used as an indication of process stability and anode quality, but there are some issues with the use of core samples for quality control. Typically, less than 1% of the weekly anode production is sampled (i.e. core physically extracted from the anode). Moreover, the core samples (50 mm diameter and approximately 400 mm in length) are collected from a specific location on the anode and are not necessarily representative of the anode block (i.e. approximately 0.6 m3 and 930 kg), which properties can be anisotropic. Furthermore, the cores are generally not long enough to measure all the properties on the same sample. Thus, the lab results might
Unit
Air permeability nPm
Apparent density kg/dm3
Thermal conductivity W/mK
Electrical resistivity mohm*cm
Flexural strengh MPa
Fracture energy J/m2
Coefficient of thermal expansion K-1
Compressive strength MPa
Young's modulus GPa
Real density kg/dm3 Cristalite size Lc nm Ash content % CO2 reactivity CO2 loss CRL % CO2 dust CRD % CO2 residue CRR %
Air reactivity Air loss ARL %
Air dust ARD %
Air residue ARR %
Chemical impurities Sulphur S %
Vanadium V ppm Nickel Ni ppm Silicon Si ppm Iron Fe ppm Aluminium Al ppm Sodium Na ppm Calcium Ca ppm Properties
not be representative of the whole anode population (Sinclair & Sadler 2009). There is also a few weeks delay between the sampling and the availability of the lab results, so oftentimes, the anodes have already been set in the pots and it is too late to take corrective actions on the anode manufacturing process. However, when used correctly (i.e. good sampling strategies), these laboratory measurements can be use to assess the overall anode quality over a certain time window (aggregated measurements) or to compare the effect of different operating parameters. But due to the long processing time, the anode properties obtained from the quality control laboratory cannot be used for real-time feedforward/feedback control (Sinclair & Sadler 2006; Sinclair & Sadler 2009).
1.6 Problems
As introduced earlier, anode quality is critical to the optimum operation of the aluminium smelters. However, the quality of baked anodes is becoming less consistent over time due to three main reasons. First, the declining availability of good quality anode raw materials: coke and pitch. Second, most smelters purchase coke materials from an increasing number of suppliers to meet availability and quality targets (i.e. they blend cokes) but also to reduce purchasing costs. This introduces supplier-to-supplier variations in addition to lot-to-lot variability from any given supplier. Finally, some of the anode plants (especially the older plants) do not have the flexibility to cope with such an increased variability. Indeed, frequent adjustments to process operating parameters are required to attenuate the impact of raw material variability, and most plants are not equipped to make those corrections in a timely fashion. For example, there is a general lack of on-line sensors to measure critical-to-quality attributes at the various stages of the anode manufacturing, from raw materials characterization, to the different processing steps and final anode quality assessment. Minimizing the impact of raw material variability is of great importance for aluminium smelters because of the significant impact it has on the performance of the reduction cells and the economical performance of the smelters (Fischer & Perruchoud 1991; Jentoftsen et al. 2009).
In the future, the suppliers of coke and pitch are expected to support the growing demand for aluminum, but the major issues will be the increasing cost and the availability of high quality raw material (Mannweiler et al. 2009; Baron et al. 2009; Edwards et al. 2012). There are several reasons for the decrease in quality of the carbon materials and the most important one is that both coke and pitch are by-products of their respective industries which have no or very little economical incentive to improve or control their quality. The
second reason is that both raw materials are dependent on the source of crude oil or coal and the conditions of the cokefaction or distillation process used to produce them. Coke properties are highly dependent on the diversity of crude oil sources. As low sulfur, low contaminant crudes become rarer, higher contaminated crudes are being refined. This leads to higher levels of contaminations in the coke, especially for vanadium and sulphur. It also leads to changes in the coke micro-texture from a sponge-like appearance to a more isotropic texture which can increase anode cracking in the cells (Edwards et al. 2009; Edwards et al. 2012).
Due to the rarity of high quality raw materials on the market, the higher cost of coke and pitch drives the carbon plant to more frequent supplier changes which in turn increase even more the variability of raw material incoming to the carbon plants. Some manufacturer are even considering using non-traditional lower cost type of coke in the anode paste (e.g. shot coke (Edwards et al. 2009)).
Unfortunately, the anode manufacturers are not well prepared to manage this increase in raw material variability. There is a general lack of real-time measurements of key raw material and green and baked anode properties. The coke and pitch properties are characterized by laboratory analysis or by simply using the certificate of analysis (COA) from the manufacturer, but these are often available after the manufacturing of the anodes. Furthermore, the baked anode properties are measured by sampling cylindrical core of less than 1% of the production.
The issues with the representativeness of the anode core sample properties have been discussed earlier, but the main problem is with the long delay to obtain those measurements (i.e. a few weeks). The results are available too long after the anode has been produced to be used for implementing corrective actions in the process (Sinclair & Sadler 2006; Sinclair & Sadler 2009). Only long term deviations can be observed by this monitoring strategy, and it is of limited use when raw material supply changes frequently. Currently, the green anode quality is controlled by manipulating the amount of pitch in the paste (i.e. pitch ratio in the formulation). Hulse (Hulse 2000) presented a review of empirical model based pitch optimization techniques. At the plant, a combination of operator experience, visual inspection of the newly formed green anode and the use of the green anode density (GAD) as a quantitative metric are used to estimate the required amount of binder (i.e. pitch demand) in the anode. Pitch is also adjusted to ensure smooth
operation of the paste plant for any given formulation of paste or raw material blend. Unfortunately, the GAD is not a good indicator of baked anode properties since it does not show an optimum based on the pitch demand. The GAD increases even if the baked anode properties are decreasing due to over-pitching (Hulse 2000). This is illustrated in Figure 6 as opposed to the BAD which has an optimum. Also, since this choice of the optimum pitch level depends on the operator’s experience, the quality of the anode can change from one operator to the other.
Figure 6 – Illustration of the different behavior of GAD and BAD as a function of pitch % Other process conditions (e.g. mixing temperature, paste formulation, etc.) are generally kept at constant operating values. Almost no real-time changes are implemented in response to the raw material variability due to the lack of on-line quantitative quality measurements. This situation is illustrated in Figure 7. It is shown that given the increasing variability of incoming raw materials, if the process conditions are not adjusted (kept constant), that the variability propagates through the baked anode final properties. Real-time adjustments of process conditions, through feedforward and feedback control actions, are necessary to help produce anodes of consistent quality.
Figure 7 – Effect of constant operating conditions
GAD
BAD
Pitch %
GAD
In summary, the long delays in obtaining the raw material and baked anode properties from the laboratory and the lack of online quantitative measurements in the paste plant make it very difficult to face the increase in coke and pitch variability.
This situation can be improved by using the data that are already available at the smelters and carbon plants. Tessier et al. (Tessier, Duchesne, Tarcy, et al. 2011) identified a set of combined (i.e. multivariate) anode properties that could help ensure good pot performance in the smelter. The availability of the information on anode quality, in real-time and for all anodes, could prevent the introduction of faulty anodes in the reduction cells. The carbon plant data coming from the raw material properties and the process operation conditions can be used to predict the baked anode properties. Lauzon-Gauthier et al. (Lauzon-Gauthier et al. 2012) have shown that, at the Deschambault smelter (ADQ), between 20-60% of the variance (i.e. model fit) in the anode properties (i.e. physical and mechanical properties and gas reactivity) can be explained by using the routinely collected raw material and process data. The multivariate statistical model proposed in that work only used the data routinely measured in the plant and was shown to provide useful predictions of the baked anode properties, available right after the baking process. This could allow for early detection of faulty anodes and investigation of process deviations. However, the model could only predict the properties for anodes baked at two specific positions within the furnace due to the anode sampling strategy in place at ADQ. The above studies have both shown that the data already routinely collected at the plant contains relevant and useful information, but that new measurements are still necessary to explain a greater percentage of the variations in baked anode properties which, in turn, will help improve quality control. A combination of the currently available data and new measurement techniques is therefore sought as a promising solution.
There are good opportunities in the anode manufacturing process to develop new tools and sensors to improve the measurement of process variability and increase the ability of the manufacturers to reduce the impact of the raw material variability. Machine vision applications for process monitoring and control have become increasingly popular in recent years. Duchesne et al. (Duchesne et al. 2012) reviewed several of these applications including the detection of defaults in lumber wood, monitoring of the mineral froth in a flotation process and detection of steel slab surface defects. Since the variations in raw material quality and operating conditions of the paste plant can influence the visual
appearance of the anode paste, there is a good opportunity to develop a machine vision sensor capable of monitoring change in the paste quality.
Several methods for characterizing coke or paste properties using images have been reported in the literature. Most of the proposed method used some automatic image analysis scheme, but all of them lack the possibility to be applied in real-time. Eilertsen et
al. (Eilertsen et al. 1996) have proposed a method for analysing the coke micro-texture
(i.e. coarseness and anisotropy) using a polarising light microscopy technique. Adams et
al. (Adams et al. 2002) developed a method to measure the thickness of the pitch layer on
coke particles by microscopy. Rorvik et al. (Rorvik et al. 2006) also proposed a method using a microscope to measure the pitch layer thickness and the pore sizes. The main disadvantages of these methods are the sample size is small and time consuming sample preparation is required for each measurement. These techniques are not rapid enough to support on-line monitoring of the process.
Sadler (Sadler 2012) proposed a method to monitor the macroscopic visual appearance of the baked anode surfaces using a microscope and found that visible structural changes in the surface texture could be observed on anode fabricated under different operating conditions. It was used on baked anodes, but applicability to green anode or paste would enable carbon plants to react to process changes before the baking step. However, this approach was not automated and also suffers from the same drawbacks as the other methods using microscopy and described in the previous paragraphs.
An internal report from Alcoa (Adams et al. 2007) describes a method based on images used to measure the amount of pitch in the paste. This is the only known method of automatic paste image analysis so far. Its major drawback was its lack of robustness to changes occurring in industrial paste samples.
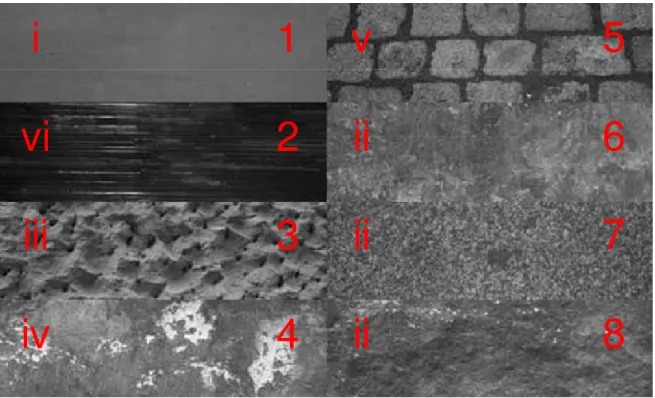
The fundamental hypotheses made and tested in this Ph.D. thesis is that the paste visual textural appearance is influenced by the dry aggregate particle size distribution, the coke particle porosity (i.e. pitch demand), the amount of pitch and the processing conditions of the paste, and a machine vision approach should allow quantifying the effect of these parameters. To support this, a few anode paste images obtained under different formulation and processing conditions are shown in Figure 8.
Figure 8 – Illustration of the effect of different raw material and processing conditions of the anode paste visual appearance: a) and b) 2 different industrial pastes and c) laboratory
paste
1.7 Objectives
The general objective of this thesis is to address issues related with the lack of fast and relevant measurements to help cope with raw materials and process variability and enable real-time quality control of the green and baked anodes. It is a twofold approach where a new non-destructive machine vision system is developed to add real-time information about the green anode paste quality. This sensor could be used in a feedfoward/feedback control strategies to compensate for disturbances in raw material properties or formulation variability that are difficult to measure with the usual monitoring approach. Also, a new multi-block latent variable method is developed to improve the interpretation of the data already available from the manufacturing process and to be able to include the additional data coming from the machine vision sensor and other non-destructive real-time measurement in the future in empirical models of the carbon plant.
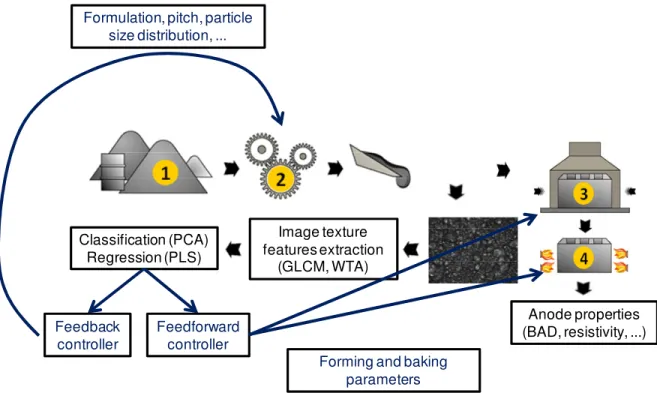
The new sensor should be sensitive to changes in formulation and in the pitch demand of the paste. The images are taken on the paste after mixing, but before compaction. An illustration of the methodology is presented in Figure 9.
a)
b)
Figure 9 – Schematic of the machine vision methodology for anode paste
The first specific objective is to develop a machine vision algorithm (i.e. image preprocessing, image analysis and features selection) at a laboratory scale. This method was developed with lab scale anodes in the laboratory at Université Laval. Paste samples were prepared by varying the conditions of fabrication. These variations included the use of different types of coke and pitch, variations of the dry aggregate particle size distribution, of the fine particles fineness (i.e. the Blaine number), of the amount of pitch as well as the mixing temperature of the paste. Each paste sample was imaged using a camera in the visible spectrum (i.e. RGB). The image texture characteristics that enabled the differentiation and classification of the different blends of paste were identified. The image texture features were computed using advanced image texture analysis method: the co-occurrence of gray level matrices (GLCM) and also wavelet texture analysis (WTA). Multivariate latent variable statistical methods such as principal component analysis (PCA) and projection to latent structures (PLS) were use to analyse the image features.
The second specific objective is to test the robustness of the machine vision sensor for industrial scale anode paste. This was performed in the Alcoa Deschambault smelter’s (ADQ) carbon plant. Off-line samples of paste were taken from the process after mixing during several days of operation and the sensitivity of the sensor developed in the laboratory to the various process conditions were tested.
Extraction de
caractéristiques
Classification (PCA),
Régression (PLS)
Classification (PCA) Regression (PLS) Image texture features extraction (GLCM, WTA) Anode properties (BAD, resistivity, ...) Feedforward controller Feedback controllerFormulation, pitch, particle size distribution, ...
Forming and baking parameters
The third specific objective is the development of a new sequential multi-block PLS algorithm (SMB-PLS). Based on observations made in previous work by Tessier et al. (Tessier, Duchesne & Tarcy 2011) and Lauzon-Gauthier et al. (Lauzon-Gauthier et al. 2012) it was found that there is a need to improve the visualization and interpretation of PLS models for large and complex industrial datasets. It is also important to develop such algorithm as new real-time measurements (e.g. the paste machine vision sensor) are available. This new algorithm will be useful in the future to integrate all the data related to anode quality into one single empirical model. These data can be available from the raw materials, the process operating conditions, some real-time non-destructive measurements of the paste, green anodes and baked anodes, the baking furnace operation data, etc. The algorithm was developed using a simulation dataset and the anode manufacturing data from (Lauzon-Gauthier et al. 2012). The new method is described and compared to the multi-block PLS (MB-PLS) and sequential orthogonal PLS (SO-PLS). Also the use of the machine vision data from the industrial paste is discussed. The SMB-PLS algorithm was not developed to be specific to the anode manufacturing process and could also be applied to other complex multi-block structured problems.
1.8 Thesis organization
This thesis is organized as follows. Chapter 2 and Chapter 3 provide background information on statistical and image analysis methods, respectively. Chapter 4 discusses the material properties and the experimental procedures. Chapter 5 presents a new sequential multi-block PLS algorithm used to improve the interpretation of PLS model built on industrial data using the anode manufacturing process data. Chapter 6 discusses the choice of texture features chosen for the anode paste machine vision methodology and the results obtained with laboratory pastes and anodes. Chapter 7 focuses on describing the industrial paste results obtain with the machine vision method and the use of these data in a SMB-PLS model of the paste plant. Finally, some conclusions are drawn and future work is discussed.
Chapter 2
Latent variable methods
This chapter presents the relevant statistical background information useful for the understanding of the work presented in this thesis. It is a reproduction of chapter 3 of the author’s M.Sc. thesis (Lauzon-Gauthier 2011) with modification to sections 2.4 and 2.5. The basic latent variable methods for multivariate statistical analysis are presented in this chapter. These methods were developed in the field of chemometrics, defined by Svante Wold as “How to get chemically relevant information out of measured chemical data, how to represent and display this information, and how to get such information into data” (Wold 1995). The goal of these methods is to extract the most useful information from complex and big datasets. It has been extended to chemical process analysis and monitoring as well in the early 1990’s (Wise & Gallagher 1996; MacGregor & Kourti 1995). Two of the most used methods, Principal Component Analysis (PCA) and Projection to Latent Structures (PLS), also referred to as Partial Least Squares, are presented in the following sections together with a discussion on data scaling, the selection of the number of latent variables to include in the models and various interpretation tools.
In this thesis, the following notation is used. Scalar quantities are identified using normal lower case characters (scalar). Vectors are shown using bold lowercase characters (lowercase), matrices are represented by bold capital characters (CAPITAL) and the
transpose operator is illustrated using uppercase capital T (e.g. XT or tT
).
2.1 Principal Component Analysis (PCA)
Principal Component Analysis is the basic multivariate data analysis approach. It is used to model and investigate multivariate datasets. Detailed tutorials and examples can be found in (Wold et al. 1987; Kourti 2005). Assume a data matrix X is available consisting of I rows, commonly called observations or measurements, obtained from J different
variables (columns of X) as illustrated in Figure 10. Most industrial datasets are very large,
noisy, and the variables are typically highly collinear (i.e. X is not full rank). However,
measuring hundreds to thousands of variables on a given process does not necessarily mean that a hundred independent events occurred on this process. In fact, process operation is usually driven by a much lower number of underlying independent events called lurking or latent variables (LV) involving linear combinations of the original variables (the p’s in Figure 10). These LVs cause the large number of process variables to vary
together in certain directions (i.e. in a correlated fashion). PCA is one of the basic methods for extracting these few latent variables capturing most of the variance in a dataset. The projection of the dataset onto the lower dimensional space of A dimensions spanned by the latent variables can then be used to visualise and interpret the relationships between the variables and between the observations.
Figure 10 – Schematic representation of PCA
The first principal component is the linear combination of the J columns (variables) of X,
defined by the orthonormal vector p1, explaining the greatest amount of variance in the dataset. This is mathematically formulated as an eigenvector-eigenvalue problem with the following objective function:
{
}
1 T T T 1 1 1 1 max subject to = 1 p p X Xp p p 2.1Where the term within brackets represents the variance of the first latent variable t1 defined as the projection of X in the direction of p1:
1= 1
t Xp 2.2
This latent variable explains the most variance in X and it is removed from the dataset
leaving the residual matrix E1:
- T
1= 1 1
E X t p 2.3
If the first component is not sufficient for explaining the variations in X, a second PCA
component can be added to the model. It corresponds to the linear combination of the J variables explaining the greatest amount of variance not captured by the first component,
X I J T PT Variables O b s e rv a tio n s