This is an author-deposited version published in:
http://oatao.univ-toulouse.fr/
Eprints ID: 11844
To cite this version:
Diévart, Mickaël and Charbonnaud, Philippe and Desforges, Xavier Applicative
architecture for embedded distributed technical diagnosis. (2009) In: 7th
Worshop on Advanced Control and Diagnosis (ACD'2009), 19 November 2009
- 20 November 2009 (Zielona Gora, Poland).
O
pen
A
rchive
T
oulouse
A
rchive
O
uverte (
OATAO
)
OATAO is an open access repository that collects the work of Toulouse researchers and
makes it freely available over the web where possible.
Applicative architecture for embedded distributed technical diagnosis
Mickaël DIEVART, Philippe CHARBONNAUD and Xavier DESFORGES
Université de Toulouse, INPT, Ecole Nationale d’Ingénieurs de Tarbes, Laboratoire Génie de Production,
47 avenue d’Azereix, 65016 TARBES France;
(Tel: +33 5 62 44 29 34, e-mail: {Mickael.Dievart, Philippe.Charbonnaud, Xavier.Desforges}@enit.fr).
Abstract: This article presents an applicative architecture based on a solving method for
embedded technical diagnosis of complex systems. This architecture is defined in order to provide services enabling the evaluation of the health status of complex systems. Diagnostic services provide information to the maintenance decision support system that leads to reduce the periods of unavailability and determine if their future mission can be carried out. The architecture presented in this paper implements a distributed diagnostic function using multi-agent techniques. A consistency model-based diagnosis is proposed that leads to the identification of the faulty LRUs and the failed functions of complex systems.
Keywords: Distributed diagnosis, health status, multi-agent system, complex systems, embedded
systems, solving method, system architecture, system diagnosis. 1. INTRODUCTION
For transportation systems, new regulations in terms of environment, goods and people protection, and needs of new services have consequences on the complexity of embedded systems. To face this increasing complexity, multiple functionalities of the resources are embedded and deployed into networks of functions achieved by Line Replaceable Units (LRU). Faulty LRUs are replaced when the vehicle is at its base and repaired in the maintenance workshops, while the repaired system carries on with its mission. The increasing number of functionalities of the embedded systems contributes to raise the possession and acquisition costs leading the resources customers to optimize their availability rate. Using the Condition-Based Maintenance (CBM) recommendations usually improve the equipment availability (Jardine et al., 2006 ; Scarf, 2007)). Indeed, the CBM depends on the effectiveness of the system state provided by monitoring and diagnostic functions. They are carried out in particular from on line data generally processed by an embedded centralized diagnosis function. However, in the case of system of systems also called complex system, the identification of the faulty components is difficult using centralized architectures. After the mission, the maintenance operators must collect information by interactions with the embedded diagnostic system, in order to isolate possible faulty LRUs, and to apply troubleshooting procedures. The drawbacks of such architectures are related to the numerous pieces of information to process, which might be wrong. The automated diagnostic processes combine these errors and lead to useless removals of LRUs. Those removals are costly and increase the risk of damaging the system.
Alternatively, a decentralized/distributed diagnosis can be proposed to reduce the number of useless removals of LRUs. For applications to system of systems, monitoring and diagnostic functions can be implemented closer to the LRUs thanks to agents that carry out them. In the case of a distributed approach, a collaborative mechanism between diagnostic agents have to enable the convergence of the local diagnoses towards a set of accused LRUs which should ideally correspond to the true faulty ones.
This article presents an applicative architecture for implementing a distributed diagnostic function. In section 2, the problem statement is established. In section 3, the difficulties of implementing this diagnostic function in such systems due to the various kinds of the subsystems and to the necessary knowledge and models for its achievement is discussed. In section 4, an embedded diagnosis function is proposed. In section 5, an applicative architecture and its cooperation protocol is presented. Its objective is to carry out the identification of a set of faulty LRUs from LRUs declared faulty by the local diagnoses.
2. PROBLEM STATEMENT
The technical diagnosis of transportation systems provides to the maintenance operators a list of LRUs that should be replaced. When the diagnosis is done online, the maintenance operators prepare the intervention sooner, reducing the duration and the costs of maintenance actions. The main task of a diagnostic function is to deliver an advice on a set of faulty components and to determine the severity of the fault. A difficulty in diagnosing such a complex system is due to their numerous kinds of functions integrating different technologies (electronics, data processing, mechanics, hydraulics…). Thus, the implemented diagnostic
techniques must be adapted to the knowledge available about the system. During its use, various faults may impact the resource. Those faults degrade its operating modes. Three types of faults are considered:
Cataleptic, the failure of the system is immediate. The
fault implies a cataleptic failure. The system is in total breakdown. The faults can be simple, multiple or hidden,
Permanent is a state in which one or several system
functions are in degraded mode. The faults did not involve the failure of the system but degrade its performances and make it unable to fulfill all its objectives. The degradation of performance can involve the system locally (a function for example) or the whole system,
Fugitive, the system switches between a nominal
operating mode and a degraded one. This mode implies the same problems as those quoted previously. This type of failure can be not signaled or not explained.
In figure 1, a typology is displayed showing the multiple faults and their consequences on the health status of the equipment.
Fig. 1. Considered fault typology and consequences on health status.
The diagnosis, according to the various types of faults (typology) occurring in the system, classify the failure and determine the operating mode of the system (normal mode, degradated mode, exception mode…). A FMEA (Failure Modes, Effects and Analysis) can address this problem by the construction of causal trees.
Different implementation of the monitoring and diagnosis functions associated to the LRUs, are described in figure 2. The LRU1 hosts its monitoring and diagnostic functions, the diagnostic function can also be hosted in another platform (Diagnosis2) or, the monitoring and diagnosis functions can totally be distributed in different platforms as for Diagnosis3 and Monitoring3.
Fig. 2. Structure of a networked embedded supervised system.
In the case of aircrafts, the Centralized Maintenance System (CMS), provide a list of likely faulty LRUs for the maintenance operator. This list is established according to information from the built-in test equipments that collect information from the LRUs and generate tests if needed. The CMS correlates data to provide a “pre-diagnosis” of the LRUs. The flight warning system provides to the cockpit crew information on aircraft failed functions (Ramohalli, 1992 ; Byington
et al., 2003).
Complex systems can be considered as sets of systems that depend more or less on each other. A system implements one or several functions. For safety purposes, functions can be redundant as well as the LRUs that implement them. That is why several models are necessary to classify the different operating modes of the LRUs and their health status.
3. SYSTEM OF SYSTEMS MODELING Generally, the system is analyzed from different models in order to obtain a satisfying representation for diagnosis purpose. This analysis enables to collect the available knowledge on the complex systems. Many of them are helpful to design their diagnostic functions. In the literature, these models can be functional (Abu-Hanna et al., 1991), structural and behavioral (Chittaro & Ranon, 2003 ; Keuneke, 1991), teleological (Chittaro
et al., 1993). They enable to model the behavior of
components, of functions and of their interactions according to normal or degraded modes. In other studies, models are added to evaluate the diagnosis confidence (Bonarini & Sassaroli, 1997).
A Complex System (CS) can be defined by a finite set of
m system ∑i. CS = {∑1, ∑2,.., ∑m}. A system ∑i can be
defined as a set of n function Fi,j. ∑i = {Fi,1, Fi,2,..,Fi,n}. A
function Fi,j can be defined as a set of k LRUs
implementing this function. Fi,j = {LRUi,j,1, …,LRUi,j,k}.
If a LRU contribute to the implementation of more than one function, a decision has to be taken when defining the system. A LRU should be part of one and only one function. After defining the hierarchical decomposition
of the system, a system modeling has to be formalized to ensure system diagnostic.
In this paper, the set of necessary System Knowledge to diagnose the complex system is collected in the set SK made of four types of knowledge: functional, structural, behavioral and topological. The Functional Description (FD) is the set of functions ensured by every system. FD represents links between LRUs, functions and system. The Structural Description (SD) is dedicated to the
identification of the set of LRUs and of physical connections between them. SD introduce predicate
CONNECT(X,Y) that means that X is connected to Y. S : CONNECT(LRUi,j,q, LRUp,r,s) with q and s respectively
one of the LRUs implementing Fi,j and Fp,r. The
behavioral models are used in order to identify the relevant indicators that are used to generate symptoms for the various faults that may affect the LRUs. They help to classify the faults of the LRUs from their symptoms. For diagnostic purpose, the knowledge BM provides the relationships between the symptoms, the LRUs and their faults. The Topological Dependencies (TD) determines the proximities of components that may be the origin of indirect failures or faults of a LRU due to the proximity of another failed one. TD introduce predicate TOPO(X,Y) that means that X is close to Y and that some faults of X may affect the functioning of Y.
TD: TOPO(LRUi,j,q, LRUp,r,s) with q and s respectively
one of the LRUs implementing Fi,j and Fp,r. Finally,
BM
TD
FD
SD
SK
4. EMBEDDED TECHNICAL DIAGNOSIS
In this paper, the diagnostic function consists of several activities: to condition, to detect and to identify failures and their causes. Relevant and significant indicators are generated by the function “to condition” and are based on measurements of the system. These indicators can be statistics (mean, standard deviation, …), signals values (magnitude, power, frequency, …), parameters (structural or physical parameters), state observers, residuals, errors, etc. The function “to detect symptoms” uses these indicators to generate values, called “detected symptoms”, which are provided when a fault occurs. The decision can be made thanks to a decision-making support technique. The outputs can be digital and define which fault occurred. “To identify failures” is done by two sub-functions: “To identify failed function(s)” and “To identify faulty component(s)”. The user (pilot, driver, …) cares about the failed functions of the system whereas the maintenance operator cares about the faulty components that must be replaced. In figure 3, the activity diagram of the function “To identify failure” is detailed.
Fig. 3. Activity diagram A3 of the function “To identify failure”.
Ideally, the diagnosis identifies a set ∆2 of failed function
and locates their causes, i.e. a set ∆1 of faulty LRUs from
a set of symptoms S and a set of tests T. This leads to the next relationship where Diag is the diagnostic function:
(∆1, ∆2) = Diag(SK, S, T)
The function Diag can be implemented thanks to two sub-functions as presented in figure 4. The function
Diag1 allows, starting from a set of symptoms and a set
of tests, to identify the set of faulty LRUs of the system
∆1 = Diag1(SK, S, T), where ∆1 =
{AB(LRUi,j,q),…,AB(LRUp,r,s)} and the function Diag2
enables to locate the set of failed function from tests and the set of failed LRUs: ∆2 = Diag2(SK, ∆1, T) where ∆2 =
{AB(Fi,j),…,AB(Fp,r)}. AB(.) enables to denote either a
faulty LRU or a failed function.
5. APPLICATIVE ARCHITECTURE
Distributed approaches of Information and Communication Technologies (ICT) often provide good enough solutions to face complexity. The diagnostic function was implemented in a distributed structure according to the multi-agent system concept. The agents of the structure cooperate and exchange data whatever the language used to model the information they contain is. This implementation requires data and models that have been collected and organized. In the case of the complex systems some works show the feasibility to implement an embedded diagnostic function by distributed architectures with or without cooperation between its elements (Biteus, 2005 ; Heck et al., 1998 ; Wörn et al., 1998).
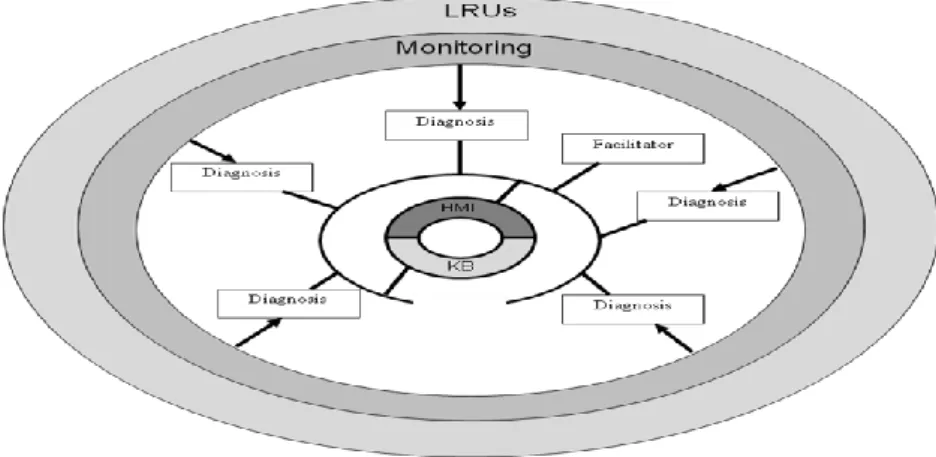
The conceptual framework of the proposed applicative architecture is depicted in figure 4, the architecture presented herein is based on a distributed implementation. The local diagnosis agents cooperate to provide the diagnosis of the system. This implies the use of multi-agent system techniques. As shown in figure 4, a facilitator agent can be introduced, to ensure the convergence toward a solution within a given time. The applicative architecture does not imply the implementation of a distributed diagnostic function. It depends on the “solving method”. The middleware solution eases the implementation of the services provided by the agents that are software entities exchanging data by abstracting the way they are hosted on different hardware entities.
The architecture consists of several LRUs that are gathered into several functions which is the LRU layer. Each LRU is observed by a monitoring function designed by the supplier. The monitoring functions are represented by the monitoring layer in figure 4. Then, the monitoring agents send their symptoms to a Diagnostic Agent (DA), which is in charge of elaborating the set of faulty LRUs. One or more databases (KB) contain the structural, the topological, the functional and the behavioral knowledge in order to provide a support for the different agents. A Human/Machine Interface (HMI) ensures the information displayed to users. The HMI displays, according to the type of operators, the failed functions of the system (for the production operators) or the LRUs that need to be replaced or fixed (for the maintenance operators). If the collaboration is correct the global diagnosis of the system in terms of faulty LRUs is a union of each local diagnosis.
The solving method of the distributed architecture is represented by the activity diagram shown in figure 5. These activities are carried out by cooperation between the DAs and the HMI. This cooperation is represented by sequence diagrams shown in figures 6 and 7. The
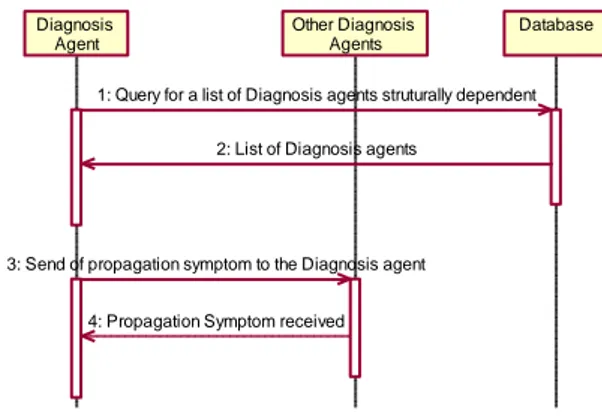
reception of a symptom by a DA launches the process. The corresponding DA begins by defining the symptom received. If the symptom is generated by the monitoring layer, it is declared as a “failure symptom” and if it is a symptom generated from the function “To propagate symptom”, it is called a “propagation symptom”. If the symptom is a failure symptom, this one is diagnosed as described by the sequence diagram in figure 6 where the DA sends a request to the database to know if the symptom is known or unknown. A known symptom is a symptom for which the cause is already identified by studies made at the system design stage (FMEA). If the symptom is known, the database returns the result and the DA declares the cause of failure of the LRU as known, otherwise, the cause of failure of the LRU is declared as unknown. Then the fault is propagated as described by the sequence diagram shown in figure 7. This activity begins by a request of the DA to the database to know if it exists structural dependencies with other LRUs. If it is the case, “propagation symptoms” are sent to advice the DA in charge of diagnosis of the involved LRUs that they may not operate correctly. Therefore, those LRUs are declared as out of order. Furthermore, the supervision of the diagnostic agents is ensured during a cooperation task and more precisely during “the fault propagation” function. If an agent did not confirm that it receives the message during the propagation task, the diagnostic process accuses and declares the agent as failed. So, the diagnosis of the DA also contains information about the DAs that did not answer the request. By this way, the diagnostic of the DAs is carried out.
Every DA of the architecture diagnoses LRUs implementing a function. Every time a DA receives a symptom the last diagnosis is copied and updated according to the new received symptom. This ensures the elaboration of an historic of the evolution of the diagnostic process. This enables a non monotone diagnostic process.
If the symptom received by the DA is a “propagation symptom”, this one is used for a “diagnosis refinement” task. To explain the activity, let us considered the example composed of 3 LRUs (
LRU
1,1,1,LRU
1,1,2andLRU
1,1,3) structurally dependant. SD contains, which the only considered knowledge about the system: CONNECT(LRU
1,1,1,LRU
1,1,2),CONNECT(
LRU
1,1,2,LRU
1,1,3). Each LRU has its own monitoring period for each of its symptom. For example, if we consider one symptom per LRU, we suppose that the symptom emitted from the monitoring ofLRU
1,1,1can be send to the DA every 5 minutes, the one ofLRU
1,1,2every minute and the one ofLRU
1,1,3every second. In such a case, we consider that onlyLRU
1,1,1failed,LRU
1,1,2and3 , 1 , 1
LRU
should be defined as out of order. But the symptoms are not received in the order they occur because of the different monitoring periods. Considering symptomst t k j i
S
, , , of theLRU
i,j,q that occurs at time t and3
2
1
t
t
t
it can be infer thatS
1t,11,1,1
S
1t,21,2,1
S
1t,31,3,1. It is important to make a difference between the time the symptom occurs and the time the symptom is send. At the first step, because of the monitoring periods, the DA receivesS
1t,31,3,1. So,LRU
1,1,3is declared has failed. Then, the DA receivesS
1t,12,2,1. Ast
2
t
3
and because of the structural dependencies,LRU
1,1,2is declared failed and3 , 1 , 1
LRU
is updated to a out of order status. Finally, the DA receivesS
1t,11,1,1. Because of the timestamp (t
1
t
2
t
3
) and the structural dependencies, LRU1,1,1 is declared failedand
LRU
1,1,2andLRU
1,1,3are declared as out of order.Fig. 5. Activity diagram of the considered solving method.
Diagnosis Agent
Database
1: Query a known fault
2: Answer the request
3: Change LRU status according to answer
Fig. 6. Sequence diagram of the function “To diagnose”.
Diagnosis Agent
Database Other Diagnosis
Agents
1: Query for a list of Diagnosis agents struturally dependent
2: List of Diagnosis agents
3: Send of propagation symptom to the Diagnosis agent
4: Propagation Symptom received
Fig. 7. Sequence diagram of the function “To propagate fault”.
In figure 8, the presented case study consists of 3 systems each implementing one function. Every function is implemented by 3 LRUs. Function 31 is independent while
Function 11 and Function 21 are functionally dependent.
Structural dependencies between LRUs are described in the set SD which is the only considered knowledge. The knowledge is recorded in XML files, which is an input of the solving method for symptom generation and diagnostic support.
Four different status describe the state of a LRU:”OK” where the LRU is not faulty at all, “UF” when the LRU is faulty but the cause is unknown (Unknown Failure), “KF” when the cause of the failure is known (Known Failure) or “OO” when the LRU does not work in nominal mode or is failed because of the failure of a LRU structurally dependent of it (Out of Order).
The symptoms received by DAs are recorded in a field linked to the corresponding LRU. The state of the LRU changes and the diagnostic timestamp of the LRU is updated with the current one. At the end of the symptom generation session, a list of faulty LRUs with its cause and a list of failed functions are available. The cause of faulty LRU is described in terms of sentences from FMEA studies or of faulty LRU in the case of “OO” state. The cause of failed function is described in terms of faulty LRUs.
For example, if LRU2,1,1 and LRU3,1,1 failed and the cause of
the failure of LRU2,1,1 is known to be a power failure and the
cause of LRU3,1,1 unknown. After symptom generation, the
diagnosis result is given by:
∆1 = LRU2,1,1(status: KF, cause: power failure, timestamp:
2009/07/05 15h26min56s) & LRU3,1,1(status: UF, cause:
unknown, timestamp: 2009/07/05 15h27min05s) & LRU1,1,2(status: HS, cause LRU2,1,1 failure, timestamp:
2009/07/05 15h26min57s) & LRU3,1,2(status: HS, cause:
LRU3,1,1 failure, timestamp: 2009/07/05 15h27min06s)
∆2 = Function11 (status: HS, cause: function12 failure,
timestamp: 2009/07/05 15h26min58s) & Function21 (status:
KF, cause: LRU2,1,1 failure, timestamp: 2009/07/05
15h26min57s) & Function31 (status: KF, cause: LRU3,1,1
failure, timestamp: 2009/07/05 15h27min06s)
In each set ∆1 and ∆2 is listed the LRUs or functions that do
not work in a nominal mode with their current state, the cause of their failure and the timestamp their state changed.
All pieces of diagnostic data and their timestamp are recorded to ensure performance evaluation at the end of the diagnostic process. Performance indicators are therefore defined. These indicators use the timestamps of the different data that are exchanged between the agents on the middleware to be evaluated like: speed of convergence, data flow, and computational load.
6. CONCLUSION
The proposed distributed diagnostic architecture provides a solution to diagnose faulty LRUs and failed functions in the case of system of systems. This architecture is based on DAs that receive symptoms from monitoring layer. The proposed
distributed implementation of the technical diagnostic function is based on a distributed resolution method and system knowledge. Future work will deal with the comparison between decentralized and centralized diagnostic functions.
Acknowledgement: The project was supported by Airbus France
References
Abu-Hanna, A., Benjamins, R., and Jansweijer, W. (1991). Device understanding and modeling for diagnosis, IEEE Intelligent Systems and Their Applications Vol. 6(2), pp. 26-32.
Biteus, J. (2005). Distributed Diagnosis and Simulation Based Residual Generators, Dept. of Electrical Engineering, LiU-TEK-LIC-2005:31, Thesis No. 1176.
Bonarini, A. and Sassaroli, P. (1997). Uncertainty and approximation in multimodel diagnosis Inf. Sci., Elsevier Science Inc., vol. 103, pp. 187-210.
Byington, C., Kalgren, P., Johns, R. and Beers, R. (2003). Embedded diagnostic/prognostic reasoning and information
continuity for improved avionics maintenance,
AUTOTESTCON. IEEE Systems Readiness Technology Conference. Proceedings, pp. 320-329.
Chittaro, L., Guida, G., Tasso, C., and Toppano, E. (1993). Functional and teleological knowledge in the multimodeling approach for reasoning about physical systems: a case study in diagnosis, Systems, Man and Cybernetics, IEEE Transactions on, Vol. 23(issue 6), pp. 1718-1751.
Chittaro, L. and Ranon, R. (2003). Hierarchical model-based diagnosis based on structural abstraction, Artif. Intell., Vol. 155(1-2), pp. 147-182.
Heck, Florentin, Thomas, Längle and Heinz, Woern (1998). A Multi-Agent Based Monitoring and Diagnosis System for Industrial Components, Proceedings of the DX '98, pp. 63-69. Jardine, A., Lin, D. and Banjevic, D. (2006) A review on machinery
diagnostics and prognostics implementing condition-based maintenance, Mechanical Systems and Signal Processing, vol 20, pp. 1483-1510.
Keuneke, A. (1991). Device representation-the significance of functional knowledge, IEEE Intelligent Systems and Their Applications Vol. 6(2), pp. 22-25.
Ramohalli, G. (1992). The honeywell on-board diagnostic and maintenance system for the boeing 777, Digital avionics systems conference, 11th IEEE/AIAADigital Avionics Systems Conference, Proceedings., IEEE/AIAA 11th, pp. 485-490. Scarf, P. (2007). A Framework for Condition Monitoring and
Condition Based Maintenance, Quality Technology & Quantitative Management, vol 4, pp. 301-312.
Wörn, H., Längle, T., and Albert, M. (1998). Multi-Agent Architecture for Monitoring and Diagnosing Complex Systems, The Fourth International Workshop on Computer Science and Information Technologies, Patras, Greece.