Value Creation and Drivers of Secondary
Buyouts in France
François Evers Student HEC Paris Ulrich Hege Professor HEC Paris June 14, 2012 AbstractThis paper studies the value creation and drivers of secondary buyouts in France in the aftermath of the financial crisis. We use two data sets: a unique, self-constructed sample of 438 French private equity sponsored buyouts between 2007 and 2011, and a sample of 139 French private equity exits for the same period. 52% of private equity investments were exited via secondary buyout in 2011, making it the preferred exit strategy for private equity firms. We argue that not all of the value creation potential is realized in first-round buyouts and that there is room left for value creation in secondary buyouts. Indeed, we show that private equity firms seem to focus in first-round buyouts on growing the sales of smaller companies and in secondary buyouts on improving operational margins of larger companies. Moreover, we find that the likelihood of an exit via secondary buyout is not only negatively related to hot IPO markets and the cost of debt financing, but also positively related to the amount of undrawn capital commitments in the private equity industry and the pressure for the selling private equity firm to exit and monetize its investment.
1 Introduction
A secondary buyout (SBO) is a leveraged buyout (LBO) of a company that has already undergone a previous LBO. For the purpose of this paper, we use the term LBO to denote first-round LBOs, the term SBO to denote financial buyouts including secondary, tertiary, quaternary and quinary LBOs, and the term buyout to denote LBOs and SBOs. We define a financial buyout as a leveraged buyout deal where both the seller and buyer are private equity (PE) firms and where at least 50% of the shares are acquired. This definition excludes a whole range of deals, such as management buyouts (MBO), management buy-ins (MBI), leveraged management buy-ins (LMBI), leveraged buy-ins (LBI), buy-in management buyouts (BIMBO), owner buyouts (OBO), venture capital deals, and all types of minority deals.
The 1980s saw the first LBO boom peaking with the LBO of RJR Nabisco by Kohlberg Kravis Roberts & Co. in 1989, remaining the largest LBO for the following 17 years. Kaplan and Stromberg (2009) show that during this first boom from 1985 to 1989 SBOs only represented 2% of the total buyout market in terms of enterprise value (EV). Ever since the number of SBOs has continuously increased. SBOs represented 49% of the total buyout market in terms of deals in 20111 and 52% in terms of PE exits2.
[Insert figures 1 and 2]
The best example for the current SBO boom is the French food producer and distributor Snacks International. In 2010, it underwent its second LBO since the beginning of the financial crisis and its fifth LBO overall, after a first LBO by 3i in 1997, a second LBO by TCR Capital, CAPE and Océan Participations in 2000, a third LBO by CIC LBO Partners, IPO and Unigrains in 2006, and a fourth LBO by the Callaivet family in 2009.
SBOs started attracting the attention of researchers only recently. So far, most of the research has focused on SBOs before the financial crisis with a geographic focus either on North America, Europe or the United Kingdom. The
1 Source: Capital Finance 2 Source: Zephyr
purpose of this paper is to analyze the value creation potential and the drivers of SBOs in France3 after the financial crisis, more precisely from 2007 to 2011. The construction of a unique hand-collected data set is one of the most valuable contributions of this paper. Indeed, this is the first paper of its kind with a geographic focus on France. In 2011, France topped the European buyout market replacing the traditional European PE leader United Kingdom, which makes it particularly worthwhile to study this geographic market4. Moreover, it will allow us to determine whether the French SBO market presents the same characteristics as the rest of Europe and whether the dynamics of SBOs have changed since the crisis. Indeed, most of the empirical research on SBOs reveals the macroeconomic market conditions such as the cheap financing costs before the financial crisis as one of the main drivers behind SBOs. However, the credit accessibility has been down and financing costs have increased since the beginning of the financial crisis in 2007, as shown in figure 3.
[Insert figure 3]
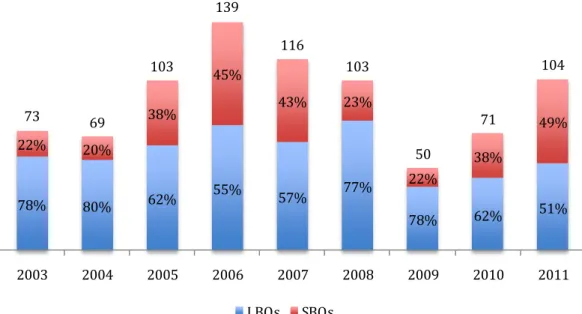
Figure 2 shows that SBOs as a proportion of total PE exits even increased during and after the financial crisis. Moreover, figure 1 shows that SBOs as a proportion of total buyouts remained important after the financial crisis and equaled the pre-crisis level in 2010 and 2011. Thus, one of the objectives of this paper is to question the financing costs as one of the main drivers behind SBOs in the aftermath of the financial crisis and to determine the role of other drivers, such as the value creation objective, the forced seller hypothesis, and the need to invest undrawn committed funds.
This paper adopts a similar approach as five recent empirical papers on SBOs. These papers can be divided into three types. The first type analyzes the drivers of SBOs comparing them to other possible PE exit routes such as initial
3 We focus on deals with target companies that have their headquarters in France.
4 France had a deal volume of €14.0bn, the United Kingdom €13.9bn, Sweden €6.8bn, and
Germany €6.7bn.
Source: CMBOR (Centre for Management Buy-Out Research), Ernst & Young, Equistone Partners Europe
public offerings (IPO) or trade sales: Sousa (2010) and Achleitner et al. (2012). The second type analyzes the differences in performance and value creation between SBOs and LBOs: Achleitner and Figge (2011). The third type is a mix of the two first types: Bonini (2010) and Wang (2010). This paper follows the approach of the mixed type.
Bonini (2010) analyzes the value creation potential and the drivers of SBOs relying on an empirical study compromising 3,811 buyout deals from 1998 to 2008 across Europe. While PE firms are able to generate statistically significant improvement in operational performance in LBOs, they are not in SBOs. Moreover, he finds that SBOs generate a significant increase in leverage and cash squeeze-out. As drivers of the new SBO trend, he identifies increasing multiples and more favorable financing conditions. Thus, he is able to confirm the flipping hypothesis, according to which favorable market conditions allow fast investment turnover resulting in a higher return on invested capital. He concludes with the existence of residual risk shifting to lenders, who are not able to price correctly their risk exposure.
Wang (2010) analyzes SBOs in terms of pricing and performance on the one hand and on the other hand from an exit perspective. He exclusively focuses on the LBO market in the United Kingdom working with 908 deals between 1997 and 2008. He finds that SBOs are priced at an unexplainable premium versus LBOs. In terms of operational efficiency improvement, his findings are mixed: while profits of SBO target companies seem to increase, profitability seems to decrease. The main drivers for SBOs appear to be market conditions, such as favorable equity capital markets, favorable debt markets as well as the need for the seller to raise new funds. However, there is no evidence for the collusion argument, which stipulates that PE firms manipulate their returns by trading companies between them.
Sousa (2010) adopts the same exit perspective as Wang (2010). His data sample includes 1,627 PE exits across Europe from 2000 to 2007. His study comprises a descriptive analysis and an empirical study of four hypotheses. The structure hypothesis states that PE firms try to avoid long holding periods due to the limited life of their funds. He finds that returns are higher for funds that are closer to maturity. The ‘Windows of opportunities’ hypothesis states that
favorable capital market conditions fuel the SBO market. Sousa finds a positive impact of the net debt to earnings before interest, taxes, depreciation and amortization (EBITDA) on the deal value, a positive correlation between hot IPO markets and stock markets and a positive effect of higher profitability on tax shield savings and financial leverage. The specialization hypothesis states that some PE firms are able to extract incremental operational performance in SBOs due to their specialization (i.e. industry specific expertise, early or late-stage investments). Sousa undermines this hypothesis. He only finds evidence that the selling PE firm is on average older and has more deal experience. This may suggest that PE firms who have more experience and a larger network are able to generate more easily profitable first-round deals, whereas younger funds tend to focus on secondary deals. Finally, he is able to reject the monitoring hypothesis stating that more profitable companies need less control and tend to be IPOed by showing that companies exited by SBO instead of trade sale or IPO tend to be more profitable in the year before the exit.
Achleitner and Figge (2011) focus on value creation in SBOs relatively to LBOs. They rely on a data set of 910 buyout deals all over the world from 1985 to 2006. They analyze value creation in SBOs under three different aspects: operational performance improvement, leverage, and pricing. They find no evidence that SBOs generate lower equity returns or lower operational value creation than LBOs. However, SBOs seem to operate with more leverage, which they explain by the lower informational asymmetry. Finally, SBOs are more expensive than LBOs. Possible explanations are the higher skill set of the seller, but also the increased use of leverage.
Achleitner et al. (2012) study the exit strategy of PE firms from two points of view: the company and the selling PE firm. Their data set comprises 1,112 LBO exits in North America and Europe between 1995 and 2008. The paper suggests that SBOs are equally attractive as LBOs in terms of return for the selling PE firms and that the likelihood of an exit by SBO depends on the target company’s lending capacity, the liquidity of debt markets and the overall amount of undrawn capital commitments in the PE industry.
The remainder of this paper is organized as follows. Section 2 reviews the theory and literature on LBOs and SBOs and discusses the value creation
objective and other possible motives behind SBOs. Section 3 presents the data and describes the summary statistics. Section 4 examines the value creation levers and the drivers behind SBOs in an empirical study. Section 5 concludes.
2 Literature review and theory analysis
In general, there are four driving forces behind buyout deals: value creation, market conditions, incentives of PE firms, and the target company’s characteristics.
2.1 Value creation
The main reason why PE firms do buyouts is to create value for their limited partners (LP) and general partners (GP). There is a lot of research on value creation in buyout deals. Previous research generally focuses on the three following value creation levers: pricing, operational performance, and leverage.
A first way to create value is the buy-low-sell-high strategy. PE firms claim to possess a certain skill set, which allows them to sell their portfolio companies at a higher multiple than the acquisition multiple. Such a skill set could include negotiation skills, but also market timing skills. Through market timing PE firms can identify the opportune moment to buy a company at a relatively low multiple and exit the investment at a higher multiple later on5. This leads us to our first hypothesis:
Hypothesis H1: Skilled seller hypothesis: SBOs are more expensive than LBOs.
If this hypothesis is accurate, it decreases the value creation potential for SBOs, since it will be more difficult for the buying PE firm to sell the portfolio company at a higher multiple, if it has already been acquired at a high multiple in the first place. Wang (2010) and Achleitner and Figge (2011) find that SBOs are on average more expensive than LBOs. Achleitner and Figge (2011) explain this premium for SBOs by the higher skill set of the seller and the increased use of leverage in SBOs.
5 Guo et al. (2009) find that on average 12% of the value creation in buyouts is due to changes in
The second lever to create value in a leveraged buyout deal is to increase the operational performance of the portfolio company during the holding period. Indeed, PE firms often claim that their specific expertise allows them to increase the operational efficiency of portfolio companies by applying, for instance, industry best practices. Kaplan and Stromberg (2009) call this ‘operational engineering’, which includes cost-cutting plans, change in management, strategic repositioning and expansion strategies. Another vector to make companies more efficient is to optimize the corporate governance. Jensen (1989) and Jensen (1993) show that management equity-based compensation aligns incentives between managers and shareholders and that active ownership by investors increases monitoring of management decisions and strategies. Operational performance can be analyzed by the means of several proxies, such as the EBITDA margin, earnings before interest and taxes (EBIT) margin, profit margin, working capital requirement, and other financial ratios. Smith (1990) and Phan and Hill (1995) find evidence for an increase in operating performance in LBOs. Acharya et al. (2009) analyze the abnormal increase in EBITDA margins controlling for industry peers and conclude that the influence of PE professionals and the change in corporate governance can improve operational efficiency. In a more recent study, Bonini (2010) also provides evidence that PE firms significantly improve the operational performance of their portfolio companies in LBOs. Yet, there are also studies showing the contrary. Guo et al. (2009) do not find statistically significant results for an improvement in operational efficiency in U.S. companies under LBO. However, if research generally accepts the potential for operational performance improvement in LBOs, it is much more divided on SBOs. The question is: If PE firms have already improved the operational efficiency of portfolio companies in the first round, is there room left for additional improvement? And if so, can this improvement in secondary rounds be as important as in the first round? Hence, we propose:
Hypothesis H2: The potential for operational efficiency gains is lower in SBOs than
Empirical results are quite mixed on operational efficiency gains in SBOs. While Bonini (2010) finds that SBOs do not significantly improve the operational performance of target companies, Wang (2010) shows that secondary buyers may not manage to increase profitability, but manage to increase profits. Achleitner and Figge (2011) cannot find evidence that SBOs generate lower equity returns or lower operational value creation than LBOs.
Finally, leverage in a buyout deal can create value through three channels: boosting equity returns, reducing agency costs between managers and shareholders, and providing a tax shield for shareholders. Modigliani and Miller (1958) show that by increasing the debt level in a capital structure it is possible to increase the financial risk and to boost the return on equity. Jensen (1989) and Jensen (1993) show that higher leverage has a disciplining effect on managers and prevents them from investing in value-destroying projects, reducing thus the agency costs between them and shareholders. Kaplan (1989) finds that the tax shield resulting from the deductibility of interest payments represents an important part of the value creation in buyouts. In SBOs, informational asymmetry between the borrowers and lenders is lower than in LBOs. Indeed, the lending banks know the portfolio company and its management better after a first-round buyout and are keener to provide funds a second time after the company was able to pay down its debt a first time. Hence, we propose:
Hypothesis H3: PE firms use more leverage in SBOs than in LBOs.
Brinkhuis and De Maeseneire (2009), Bonini (2010), and Achleitner and Figge (2011)6 find evidence that PE firms operate with more leverage in SBOs than in LBOs. Moreover, leverage seems to increase with the size of the target company. Brinkhuis and De Maeseneire (2009) provide two other reasons than the lower informational asymmetry argument in order to explain the increased use of leverage in SBOs. Firstly, PE firms must maximize the level of leverage in SBOs in order to achieve returns, since most of the operational efficiency gains
6 Achleitner and Figge (2011) find that the debt to equity ratio is on average 74% higher and the
are realized in first-round buyouts. Secondly, companies that have already successfully managed an LBO are financially stronger in terms of operational efficiency and can assume a higher level of debt in SBOs.
2.2 Market conditions
Another important driver of the SBO market is the macroeconomic condition of equity and debt markets. Most of the research agrees that favorable equity and debt markets have a strong impact on the type of exit chosen by the selling PE firms.
A higher cost of financing reduces the liquidity of the debt markets and should induce PE firms to use less leverage, to do less leveraged buyout deals, and to prefer other exits than SBOs:
Hypothesis H4: The likelihood of an exit by SBO is positively related to the liquidity
of debt markets, respectively negatively related to the cost of debt financing.
Bonini (2010), Wang (2010), Sousa (2010), and Achleitner et al. (2012) all come to the same conclusion that the SBO market is essentially driven by cheap financing conditions. According to Achleitner et al. (2012), PE firms try to take advantage of an arbitrage between equity and debt markets, and the likelihood of an exit via SBO is positively related to the liquidity of the debt markets.
Another driver of SBOs are cold equity markets. Indeed, a hot IPO market should increase the attractiveness of an exit strategy via IPO and decrease the attractiveness of an exit strategy via SBO:
Hypothesis H5: Window of opportunities hypothesis: The likelihood of an exit by
SBO is negatively related to a hot IPO market.
While Bonini (2010) finds that the SBO market is partly driven by increasing multiples, Wang (2010) and Sousa (2010) favor the explanation that the SBO market is rather driven by cold equity markets. Indeed, Sousa (2010)
detects a positive correlation between equity market returns and hot IPO markets, which negatively relate to the likelihood of an exit by SBO.
2.3 Incentives of PE firms
Next to the value creation and market condition drivers, there is a whole range of other incentives that drive PE firms to exit via SBO or to do SBOs rather than LBOs, such as the fee structure, the need to monetize investments, the need to invest committed funds, the asymmetric information in buyout deals, the specialization and reputation of PE firms, and the collusion between PE players.
The fee structure7 in PE deals highly incentivizes PE firms to do deals as Wang (2010) shows. Since the GPs do not earn management fees on undrawn committed funds, they have a strong incentive to invest the committed funds, even if investment opportunities are limited. Moreover, a PE firm that does not invest its committed funds may raise doubts about its ability to find profitable investment opportunities, which sends a negative signal to the market and has a negative impact on its future fund raising. Hence, we propose:
Hypothesis H6: The likelihood of an exit by SBO is positively related to the amount
of undrawn capital commitments in the PE industry.
Achleitner et al. (2012) show a positive relation between the overall amounts of undrawn capital commitments in the PE industry and the likelihood of an exit via SBO rather than IPO or trade sale.
On the other hand, the selling PE firms are also subject to pressure. Since the lifetime of PE funds is limited, they have to exit and monetize their investments at some point in order to pay back their LPs. Thus, the closer a PE fund comes to its maturity, the higher becomes the pressure to exit and monetize the investment.
Hypothesis H7: Forced seller hypothesis: The likelihood of an exit by SBO is
positively related to the pressure for the selling PE firm to monetize its investment.
7 The classic fee structure in the PE industry is the ‘2-20’ structure: GPs earn management fees of
Masulis and Nahata (2007) show that this liquidity pressure leads PE firms to accept lower prices. Sousa (2010) finds evidence for higher returns for buyers when the PE fund of the selling firm is close to its maturity.
Another driver for SBOs is the lower asymmetric information between the PE firm and the target company. Indeed, a company and its management that have already managed an LBO and successfully paid down its debt are more likely to successfully manage an SBO.
PE firms often claim that they are specialized and have expertise in a specific domain. Specialization vectors may include industry (healthcare, consumer goods, etc.), life cycle (early-stage, development-stage, late-stage), size (large-cap, mid-cap, small-cap), strategy (international expansion, turnaround, etc.), and other types of specialization. Thus, a potential driver for SBOs could be, for instance, the fact that PE firms specialized in early-stage investments tend to sell the portfolio company to PE firms specialized in development or late-stage investments once the company becomes more mature. Sousa (2010) analyzes the characteristics of PE firms involved in SBOs and compares the selling and buying firms. He shows that the selling PE firm is on average 2.3 years older and has set up on average one fund more than the buying firm. Moreover, the selling firm raises $10m on average more than the buying firm. This specialization is not in line with what PE firms claim. Rather, better known PE firms seem to be able to find good deals to invest the committed funds in more easily and therefore seem to do more first-round deals, whereas less well known PE firms seem to privilege secondary deals. Hence, we propose that the reputation of the selling PE firm is a driving force behind SBOs:
Hypothesis H8: The likelihood of an exit by SBO is positively related to the
reputation of the selling PE firm.
Bonini (2010) shows that the reputation of the selling PE firm positively impacts the likelihood of an exit by SBO. He concludes that if the selling PE firms are more reputable, the buying PE firms can sell the deal to banks more easily, even if the value creation potential is smaller than in LBOs.
According to the collusion argument, PE firms buy and sell portfolio companies between them in order to manipulate and artificially increase their returns. Wang (2010) does a cross participation analysis, but finds no evidence for this argument.
2.4 Target company characteristics
The target company’s characteristics are a last category of drivers behind SBOs. The maturity and profitability of the portfolio company should, for instance, have an impact on the exit strategy. More mature and profitable companies with more stable cash flows are generally better suited for a buyout, since it will be easier to pay down the acquisition debt. Bienz and Leite (2008) develop a model to prove that companies that are operationally more efficient need less control and can be exited by an IPO or SBO, where management remains more independent.
Hypothesis H9: Monitoring hypothesis: The likelihood of an exit by SBO is
positively related to the target company’s operational efficiency and capacity to generate large and strong flows.
Sousa (2010) shows that portfolio companies are on average older and more profitable in SBOs than in LBOs. Moreover, companies with a higher sales growth and lower capital expenditures increase the probability of an exit via SBO versus trade sale or IPO. Achleitner et al. (2012) find that a portfolio company’s capacity of lending increases the likelihood to be sold to a financial investor. Sudarsanam (2005) finds that larger firms with better operational performances are more likely to be exited via SBO than trade sale or IPO.
Moreover, the industry a portfolio company is operating in can have an impact on the exit strategy chosen by the selling PE firm. According to Sudarsanam (2005), public investors may have a stronger preference for certain industries during bubbles, as it was the case for Internet and high-tech companies during the ‘dot.com’ bubble in the late 1990s. If the selling PE firm wants to capitalize on such trends and achieve higher returns, it is more likely to choose an IPO as exit. Furthermore, companies operating in industries that are
highly fragmented and that allow for important economies of scale are more likely to be exited by trade sale to strategic buyers looking for industry consolidation.
Finally, companies that have already undergone previous buyouts should be on average older and larger than first-round buyout targets. This directly relates to hypothesis H2, according to which the potential for operational performance gains is higher in LBOs than in SBOs. Indeed, we expect PE firms, for instance, to be better in boosting sales in LBOs than in SBOs, partly because the target companies in LBOs are younger and smaller than in SBOs. Thus, our last hypothesis is:
Hypothesis H10: SBO deals are larger than LBO deals.
3 Data and sample statistics
This section presents the data and describes the summary statistics. Two distinct data sets are used, one to measure the difference in value creation between LBOs and SBOs and one to measure the drivers of SBOs as opposed to other PE exits routes such as IPOs or trade sales.
3.1 Sample selection
For the purpose of studying the difference in pricing, operational performance improvement, leverage, and deal size between LBOs and SBOs, our primary source for the buyout deals is the Capital Finance database, which belongs to the French group Les Echos8. For the period of 2007 to 2011, we find a total of 877 buyout deals. We analyze deal by deal and identify 438 suitable buyouts9. This hand selection is one of the most valuable contributions of this paper. For each deal, Capital Finance provides a link to an article concerning the deal, which may include valuable information, such as the deal value, the equity and debt portion of the deal value, acquisition multiples, and the buying and selling PE firms.
8 Les Echos also owns the homonymous financial newspaper.
9 For the period of 2003 to 2006, we find a total of 600 buyout deals, whereof 384 deals are
We use the database Diane, which is part of the Bureau van Dijk databases, in order to gather the annual filings (balance sheet, cash flow statement and income statement) of the target companies. The nine first digits of the French company register number10 of the Capital Finance database represent the SIREN number11, which we use in order to find the corresponding companies in Diane. These annual filings allow us to compute the difference in operational performance of the portfolio companies by analyzing financial ratios, such as the sales growth, EBITDA margin, EBIT margin, and working capital.
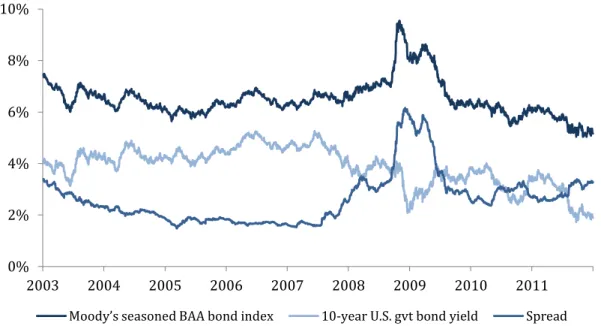
Similar to Achleitner and Figge (2011), we use the yield spread of corporate bonds on the risk-free rate as proxy for the LBO spread at entry. As proxy for corporate bond yields, we use Moody’s seasoned BAA bond index12, and for the risk-free rate 10-year U.S. government bond yields13. We calculate the LBO spread at a given time as the average of the difference between these two variables over the last quarter.
The deals issued from the Capital Finance database are divided into 15 industries and 55 sub-industries. By the means of the industry index of Yahoo Finance14, we gather the 15 industries together into 8 industry dummy variables (Consumer Goods, Industrial Goods, Basic Materials, Services, Utilities, Healthcare, Financial, Technology). When studying the pricing of the deals, we analyze the sales growth and multiples of our data set for each industry and split the 8 industries into two sub-groups: high-multiple industries (Consumer Goods, Industrial Goods, Healthcare, Financial, Technology) and low-multiple industries (Basic Materials, Services, Utilities). Indeed, industries with higher sales growth are expected to have higher multiples. Thus, we introduce a dummy variable high-multiple industry, which equals 1 for high-multiple industries and 0 for low-multiple industries.
10 Numéro RCS (Registre du commerce et des sociétés)
11 Numéro Siren (Système d’Identification du Répertoire des Entreprises)
12 We collect Moody’s seasoned BAA bond index from the Federal Reserve Bank of St. Louis
(http://research.stlouisfed.org/).
13 We collect the 10-year U.S. government bond yields from the U.S. Department of the Treasury
(http://www.treasury.gov/).
As proxy for the French stock market return, we use the SBF 120 index15, collected from Yahoo Finance. It includes the 120 most actively traded French stocks. We define the return as the natural logarithm of the relative change in the SBF 120 between 15 and 3 months before the completion date of a deal.
In order to analyze the likelihood of an exit by SBO versus IPO or trade sale, we rely on the database Zephyr, which also belongs to the Bureau van Dijk. For the period of 2007 to 2011, we are able to identify a total of 139 exit deals, whereof 52 are SBOs, 16 IPOs and 71 trade sales. We also extract the enterprise value, the EBITDA and EBIT margins for the corresponding target companies from Zephyr. If Capital Finance is more extensive in terms of buyout deals in France, Zephyr provides us with more PE exits by IPO and trade sale.
3.2 Summary statistics
This section presents the summary statistics of the 438 buyouts in France between 2007 and 2011. Out of the 438 deals, 275 are first-round LBOs, 112 are secondary buyouts, 37 are tertiary buyouts, 13 are quaternary buyouts and 1 is a quinary buyout. Figure 1 shows the cyclicality of the buyout industry, reaching a peak in 2006 before the outburst of the financial crisis with 139 buyouts, whereof 45% are SBOs. Since its low in 2009, the buyout market has started to recover and the portion of SBOs has reached its pre-crisis level.
[Insert figure 4]
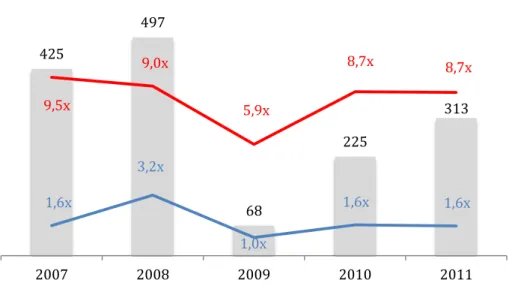
Figure 4 shows that not only the number of deals drastically decreased during the financial crisis with a low in 2009, but that the same trend is true for the deal size and the multiples paid in buyout deals.
[Insert table 1]
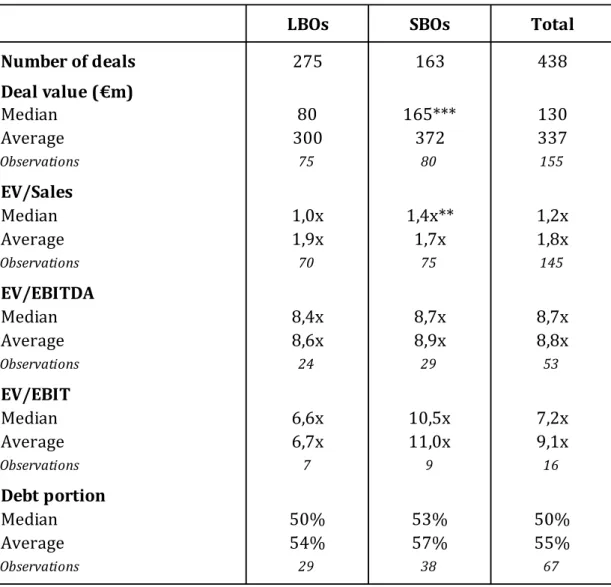
Table 1 shows the summary statistics for the 438 selected buyouts in France between 2007 and 2011 and the differences between LBOs and SBOs.
15 We collect the data of the SBF 120 (Société des bourses françaises) from Yahoo Finance
These figures confirm our expectations that SBOs are on average more expensive than LBOs16 (hypothesis H1), that they use on average more leverage (hypothesis H3), and that the deal size is substantially larger for SBOs than for LBOs (hypothesis H10). However, only the difference in the median of the deal value and the EV/Sales multiples is statistically significant.
[Insert tables 2 and 3]
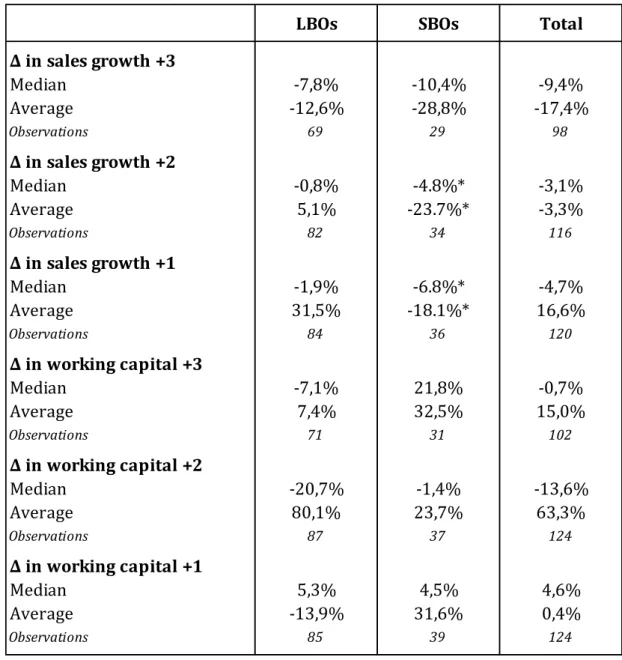
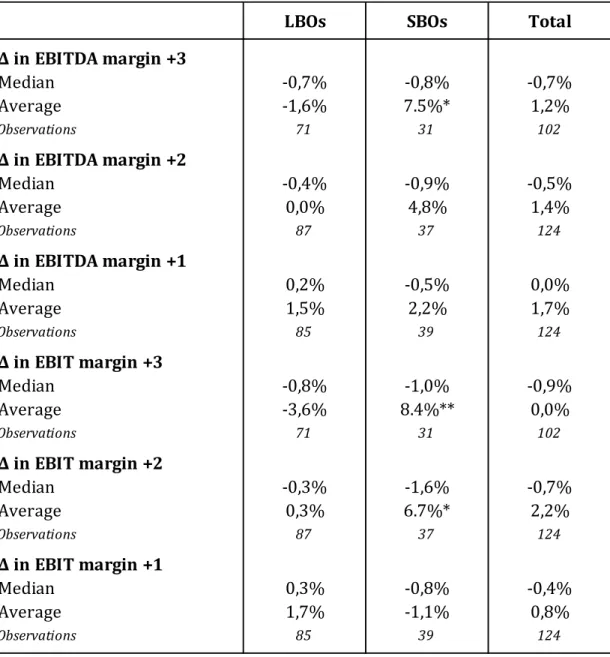
Table 2 and 3 show the change in operational efficiency one, two and three years after the buyout. The change three years after the deal should better reflect the impact of the buyout on the portfolio company since it accounts for longer run impact. However, the downside of this variable is that the number of observations is slightly lower. We do not analyze the change in the net profit margin since it may be underestimated because of interest payments made at the holding level. Another concern is that most of the changes in operational efficiency are negative. This may be due to the bad economic environment during and in the aftermath of the financial crisis. Yet, this is not a big problem, since we are only interested in the difference between LBOs and SBOs. As expected, the evolution of the sales growth is more favorable in LBOs than in SBOs (hypothesis H2). Moreover, PE firms seem to be able to reduce the working capital of their portfolio companies better in LBOs than in SBOs (hypothesis H2). However, there is no confirmation for the hypothesis that EBITDA and EBIT margins improve more in LBOs than in SBOs (hypothesis H2). Indeed, on average, three years after the buyout EBITDA and EBIT margins have a more favorable evolution in SBOs than in LBOs.
[Insert table 4]
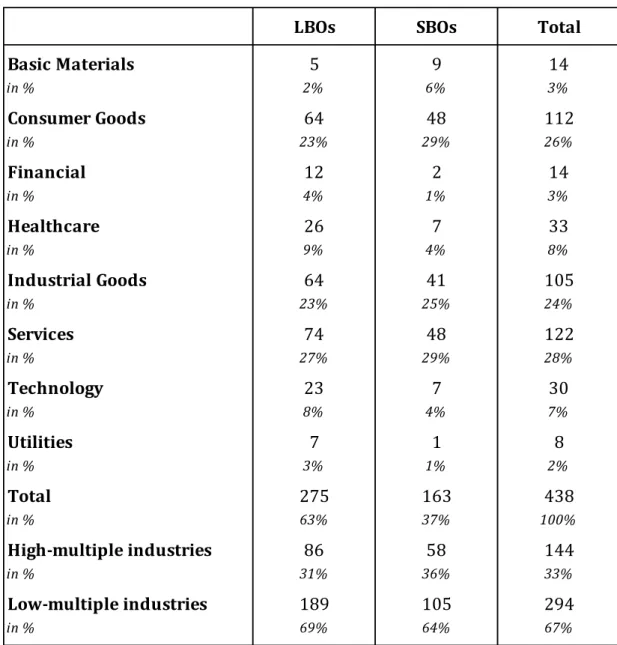
Table 4 shows the distribution of the 438 buyouts by industry. Even though the difference between LBOs and SBOs is important for some industries, it is relatively small for the industries with a high number of observations. The
16 An exception is the EV/Sales multiple: although the median for SBOs is higher (1.4x versus
portion of SBOs is 5% higher in the high-multiple industries than the one of LBOs. This could be one of the explanations why SBOs are on average more expensive. The high-multiple variable is therefore an important control variable in the pricing regression.
[Insert figure 2]
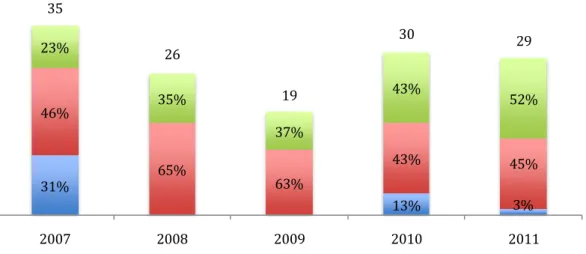
Figure 2 shows the different exit strategies for PE firms in France from 2007 to 2011. We notice that the number of exits follows the same cyclical trend as the number of buyout deals. Moreover, PE firms seem to have almost completely given up exits by IPO since the start of the financial crisis in 2007 and instead seem to favor exits by SBO. Indeed, the percentage of SBOs as exit strategy increased from 23% in 2007 to 52% in 2011, whereas the percentage of IPOs decreased from 31% to 3% over the same period.
[Insert figure 5]
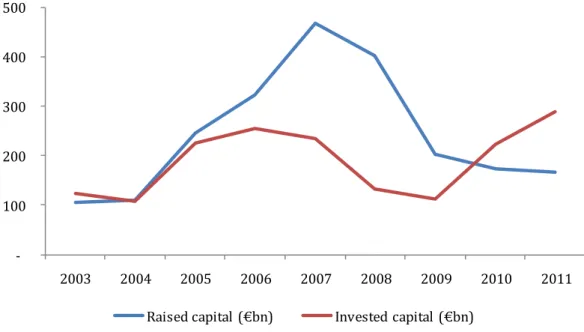
Figure 5 shows the difference between the amount of capital raised and invested by global PE firms. Before the financial crisis (2003-2006), the two amounts were quite balanced. However, from 2007 to 2009, PE firms invested a smaller portion of the raised capital creating dry powder, which they seemed to start making use of in 2010 and 2011.
3.3 Representativeness of the data set
Out of the 438 buyouts we identify in order to analyze the difference in value creation between LBOs and SBOs and the 139 PE exit deals, we are able to find the corresponding deal information (deal value, debt portion, etc.) and company-related information (sales, EBITDA, EBIT, working capital, etc.) for only a small proportion of the deals. We are able to collect, for instance, the precise deal value for only 155 out of the 438 buyouts. This implies a potential bias towards larger deals and larger portfolio companies, since information is generally more easily available for large-scale deals and companies. However,
this bias is present in most of the studies of this type and difficult to avoid. Sousa (2010), for instance, excludes all transactions with a deal value below $50m.
3.4 Other concerns
When analyzing the leverage of portfolio companies or the debt portion used in a buyout, the most reliable way to proceed is to identify all parent companies and holding companies of the portfolio company, and use the consolidated accounts. Indeed, LBOs are often structured in a way such that a part of the debt is placed on the holding level in order to take advantage of the tax shield and other favorable tax treatments. Thus, when analyzing the unconsolidated accounts of portfolio companies, there is a risk of underestimating the leverage of the company and of overestimating the net income since part of the interest payments are made at the holding level. Unfortunately, the database Diane provides the consolidated accounts for only a few French companies. As a consequence, we rely on the debt portion in the deal value provided by the articles of Capital Finance in order to analyze the leverage of the buyout deals and on the change in the EBITDA and EBIT margins rather than on the change in the profit margin in order to analyze the operational performance improvement of the portfolio companies.
Moreover, when analyzing the change in operational efficiency, we can only rely on deals from 2007 to 2009, since we are interested in the operational performance improvement one, two and three years after a buyout. For deals in 2009, we can only analyze the change one and two years after the buyout, because Zephyr publishes the company filings one year after registration.
Finally, the proxies we use to analyze the operational efficiency of the portfolio companies may not reliably reflect the reality because of mergers and acquisitions by the holding PE firm. Indeed, PE firms often merge acquired companies with other portfolio companies or sell parts of the portfolio companies. In this case, we exclude the operational performance variables from the data set. However, these operations are often difficult to identify and some of them may not have been accounted for.
4 Empirical results
This section examines the value creation levers (pricing, operational performance, leverage) and other drivers behind SBOs (market conditions, PE firm incentives, target company characteristics).
4.1 Pricing
In order to analyze the pricing of SBOs and to compare it to LBOs, we run ordinary least squares (OLS) regressions. We use two different dependent variables: the natural logarithm of the EV/Sales and EV/EBITDA multiples. Each time we specify 6 different models with different control variables. In total, we use 5 independent variables. The explanatory variable is the financial dummy taking the value of 1 in the case of an SBO and 0 in the case of an LBO. The control variables are the size, the high-multiple industry dummy variable, the LBO spread, and the French stock market return. The variable size represents the natural logarithm of the total deal value including the debt. The three other control variables are defined under section 3.1. Each regression is clustered by year and by industry.
[Insert table 5]
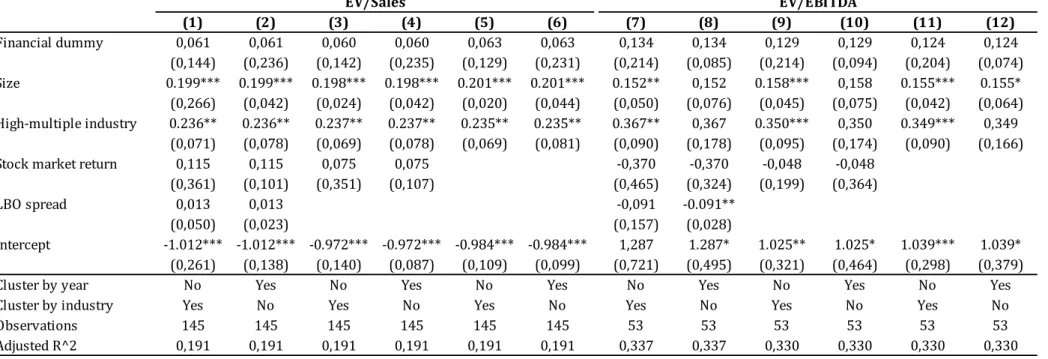
First of all, it is to be noticed that the regression of the EV/Sales multiple (specification models 1-6) and the regression of the EV/EBITDA multiple (specification models 7-12) more or less lead to the same results. As expected, the financial dummy has a positive impact on the pricing without being statistically significant though. Thus, the regressions do not confirm hypothesis H1 and we cannot conclude that SBOs are significantly more expensive than LBOs. Moreover, table 5 shows that the acquisition price is significantly related to the deal size and the high-multiple industry dummy variable. Indeed, larger companies trade most of the time at a premium due to diverse reasons17 and the high-multiple industry dummy variable should per definition be positively related to the pricing of buyouts. Finally, the LBO spread and the French stock
17 Reasons include the fact of being included in a stock market index, dominant market positions,
market return do not seem to have a significant impact on the multiples paid in buyout deals.
4.2 Operational performance
In order to analyze the operational performance improvement of companies under buyout, four different proxies are used: change in sales growth, change in EBITDA margin, change in EBIT margin, and change in working capital. While the change in sales growth and operating margins has already been studied in previous papers, the analysis of the working capital is a first and therefore an important contribution of this paper. OLS regressions are run for each of the four proxies for the change in operational performance improvement three, two and one year after the buyout. Each regression is clustered by year and industry. Most attention should be paid to the change in operational efficiency three years after the buyout since it best represents the long-term impact of PE firms in buyout deals. The explanatory variable is the financial dummy equaling 1 in the case of an SBO and 0 in the case of an LBO. The control variables are the proxy at entry (sales growth, EBITDA margin, EBIT margin, and the natural logarithm of the modified working capital18 respectively) and the natural logarithm of the sales at entry. The former is supposed to control for incremental operational performance improvement potential and the latter for the size of the operations.
[Insert tables 6, 7, 8 and 9]
Tables 6, 7, 8 and 9 show the empirical results of the OLS regressions of the change in sales growth, EBITDA margin, EBIT margin, and working capital respectively. As expected, the financial dummy has a statistically significant negative impact on the change in sales growth (table 6). However, this is not true for the EBITDA and EBIT margins (tables 7 and 8). If the financial dummy has as expected a negative impact one year after the buyout, the impact becomes
18 In order to obtain the modified working capital at entry, we add €193m to the working capital
of each observation one year before the buyout to avoid negative values and to be able to apply the natural logarithm.
positive two years after the buyout. It is only statistically significant for year-clustered regressions three years after the buyout, where it remains positive. These results do not confirm hypothesis H2 that the potential for operational efficiency gains is higher in LBOs than in SBOs. However, when considering only the changes in operational performance three years after a buyout, we are able to conclude that PE firms are better in boosting sales in LBOs than in SBOs, but that their impact on operating margins is higher in SBOs than in LBOs. These findings contradict the study of Wang (2010), who shows that SBOs may not increase profitability, but increase profits. Concerning the proxy at entry, it has a statistically significant negative impact on the change in operational performance for the sales growth, the EBITDA margin, the EBIT margin and the working capital. An explanation is that a lower sales growth, lower operating margins, respectively a higher working capital at the beginning leave more room for improvement. The natural logarithm of sales is not a statistically significant explanatory variable, but seems to have a rather positive than negative impact. The analysis of the change in working capital (table 9) does not allow us to draw any conclusion regarding the difference between LBOs and SBOs. The summary statistics above have already shown that there is no statistically significant difference between SBOs and LBOs in terms of working capital improvement. Contrary to the change in sales growth, EBITDA and EBIT margins, a negative change in working capital means an operational performance improvement. Three years after a buyout, the financial dummy has no significant impact on the change in working capital.
4.3 Leverage
In order to analyze the leverage used in buyout deals, we run OLS regressions under 6 different specifications. Bonini (2010) uses capital structure ratios calculated from the annual filings, i.e. Financial Debt/Economic Assets or Financial Debt/EBITDA, in order to analyze the leverage in buyouts. Since we do not have the consolidated accounts for all portfolio companies, we use as dependent variable the debt portion in the deal value provided by Capital Finance, since capital structure ratios from unconsolidated accounts may underestimate the leverage. The independent variables are the financial dummy
equaling 1 in the case of an SBO and 0 in the case of an LBO, the natural logarithm of the total deal size, the high-multiple industry dummy variable and the LBO spread, which are specified under section 3.1. Each regression is clustered by year and by industry.
[Insert table 10]
Table 10 shows the results from the 6 specifications of the OLS regressions. As expected, the financial dummy has a positive impact on the portion of leverage used in buyout deals, without being statistically significant though. Thus, the regression does not confirm hypothesis H4 stating that PE firms use more leverage in SBOs than in LBOs. However, it is to be reminded that our database is not particularly well suited to analyze the deal structure of leveraged buyouts. Indeed, this type of buyouts makes use of highly complex financing and holding structures, which we do not take into account when building our data set. The deal size is the only independent variable to be statistically significant at a significance level of 10% in the industry-clustered specifications.
4.4 Market conditions
Similar to Wang (2010) and Achleitner et al. (2012), we run a probit regression in order to determine the impact of market conditions on the exit strategy for PE firms. The dependent variable equals 1 if the exit is an SBO and 0 if the exit is an IPO or a trade sale. We define 10 different specifications of the probit model with a total of 8 explanatory variables. Each regression is clustered by year. The variable LBO spread is defined under section 3.1. The variable French IPO market represents the total number of IPOs in France for a given year19. In order to find a proxy for the reputation of PE firms, we rely on a similar approach as Wang (2010). We use the PEI300 index published by the Private Equity International Magazine in 201220. This reputation variable is a dummy
19 The number of IPOs in France is collected from Zephyr.
20 The PEI300 index ranks the 300 largest PE firms in the world by the total amount of
variable that takes the value of 1 if the selling PE firm is included in the index. In order to measure the pressure for the selling PE firm to exit and monetize its investment, we introduce a new variable ‘Pressure-to-exit’, which is a proxy for the remaining portfolio companies to be exited in France and which is defined as follows: 3 4 1 2 1 Pr t t t t t Buyouts Buyouts Exits Exis exit to
essure 21. This new variable is
one of the key contributions of this paper. In order to measure the pressure to invest committed funds from LPs, we introduce a dry powder variable similar to Achleitner et al. (2012), which we define as follows:
4 1 5 4 1 5 1 t t t capial Raised capial Invested powderDry 22. For the EBITDA margin, EBIT margin
and enterprise value variables, we take the natural logarithm of the data collected from Zephyr. We run 5 different specifications with each the pressure-to-exit variable and the dry powder variable, since these two variables should be interdependent.
[Insert table 11]
As expected, the LBO spread and the hotness of the French IPO market have a statistically significant negative impact on the likelihood of an exit via SBO, confirming hypotheses H4 and H5. Moreover, the reputation of the selling PE firm has a positive impact, without being statistically significant, which does not allow us to confirm hypothesis H8. The pressure to exit for the selling PE firm and the dry powder of the buying PE firm both have a positive impact on the likelihood of an exit by SBO, except if we control for the enterprise value in specifications (5) and (10), which are not statistically significant though. Thus, the specifications (1), (2), (7) and (9) confirm hypotheses H6 and H7. Finally, our findings do not confirm hypothesis H9, according to which the likelihood of an exit by SBO is positively related to the target company’s profitability and
21 Exits comprise IPOs, SBOs and trade sales of PE investments and buyouts comprise LBOs and
SBOs. The data is collected from Zephyr.
capacity to generate important and stable cash flows. While the EBITDA margin seems to have a positive impact, the EBIT margin has a negative impact without being statistically significant. Enterprise value has a statistically significant positive impact on the likelihood of an exit via SBO. A possible explanation is that PE firms generally prefer mature companies that generate important cash flows and have a dominant market position, whereas strategic buyers may prefer to increase their market share or break into new market niches by buying smaller companies in more fragmented industries that allow for industry consolidation and important economies of scale.
4.5 Deal Size
As for the previous analyses, OLS regressions are run to study the determinants of the deal size in buyout deals. The dependent variable is the natural logarithm of the total deal value. 6 models are specified and each regression is clustered by year and industry. The explanatory variable is the financial dummy equaling 1 in the case of an SBO and 0 in the case of an LBO. The control variables are the LBO spread, the high-multiple industry dummy variable and the French stock market return, which are all defined under section 3.1.
[Insert table 12]
Table 12 confirms hypothesis H10 that the total deal value is higher in SBOs than in LBOs. Indeed, the financial dummy has a positive impact on the total deal size and is statistically significant at a confidence level of 1% for year-clustered regressions and 5% for industry-year-clustered regressions. An explanation is that companies that have already undergone previous buyouts should be on average older and larger than first-round buyout targets. These findings are in line with our conclusions on the operational performance improvements. Indeed, PE firms seem to focus on boosting sales of smaller companies in LBOs and on improving operating margins of larger companies in SBOs. Moreover, the results show that the cost of financing has a statistically significant negative impact on the deal value, since cheaper financing allows taking on more debt and doing larger deals. The high-multiple industry dummy variable has a statistically
significant positive impact on the deal size since the deal value should be higher for companies with high multiples, ceteris paribus. The French stock market return has no statistically significant impact.
5 Conclusion
The SBO trend started in the 2000s and has attracted more and more the attention of researchers, which resulted in a certain conventional wisdom over the years. This conventional wisdom generally accepts three levers of value creation in LBOs: pricing, operational performance and leverage. However, it doubts the value creation potential in SBOs. SBOs are more expensive because of the skilled seller hypothesis and most of the operational performance improvement has already been realized in previous LBOs. Hence, it is often argued that the only true value creation lever in SBOs is the increased use of leverage. Moreover, conventional wisdom argues that there are other drivers behind SBOs than the traditional value creation objective of LBOs. Market conditions such as the cheap financing before the outburst of the financial crisis are often named as one of the most important drivers. However, the SBO trend has continued since the outburst of the financial crisis in 2007 in spite of the rising financing costs. This paper provides one of the first studies of the driving forces behind SBOs in the aftermath of the financial crisis. The question is whether the dynamics of the SBO market have changed since then. Moreover, it is the first paper to exclusively focus on the French SBO market.
In our study, we show that the financial dummy representing SBOs has no significant impact on the pricing of buyouts. Rather, the fact that SBOs are on average larger and more likely to occur in high-multiple industries seems to positively influence the difference in pricing between SBOs and LBOs. Moreover, PE firms are better in boosting sales in LBOs than in SBOs, but their impact on operating margins is higher in SBOs than in LBOs. A possible explanation is the natural selection phenomenon. Companies that are selected for an SBO have already successfully managed at least one LBO before, and management and employees may be better suited to achieve operational efficiency gains. When combining the findings on the operational performance improvement and deal size, we can conclude that PE firms focus on growing the sales of smaller and
younger companies in LBOs and on improving operating margins of larger and more mature companies in SBOs. Thus, PE firms seem to focus on the low hanging fruits in LBO deals and on the higher hanging fruits in SBO deals, i.e. the finishing or the fine-tuning of the operations. Finally, PE firms do not seem to use significantly more leverage in SBOs than in LBOs. All in all, we conclude that there is room left for value creation in SBOs and that the value creation objective remains a valid driver behind SBOs in France.
Moreover, we confirm the existence of other drivers behind the recent SBO trend. We find that the likelihood of an exit by SBO is not only negatively related to hot IPO markets and the cost of debt financing, but also positively related to the amount of undrawn capital commitments in the PE industry and the pressure for the selling PE firm to exit and monetize its investment.
Finally, we find no evidence that the reputation of the selling PE firm or the profitability of the portfolio company have a significant positive impact on the likelihood of an exit by SBO.
Thus, the main contribution of this paper is the finding that SBOs are not only driven by the macroeconomic conditions of the IPO, equity and debt markets, but also by the microeconomic profit maximization, i.e. the value creation objective, and the structural conditions of the PE industry, i.e. the pressure to monetize investments and to invest undrawn committed funds.
As avenues for further research, it would be interesting to analyze SBOs not only from the point of view of the buying and selling PE firms, but also from the point of view of the lending banks, the investing LPs and the target company’s management. Several questions arise: Is there a difference between the return on the debt provided to LBO and SBO deals for the lending banks? Are PE firms that invest rather in LBOs than in SBOs more successful in raising new funds? Do they achieve higher returns for their LPs? Is the relation between the target company’s management and the PE firm different in SBOs than in LBOs?
SBOs will provide a lot of interesting research opportunities over the next years, especially because the dynamics of the SBO market constantly change with the market environment as they have done since the financial crisis.
References
Acharya V., Hahn M., Kehoe C. (2009), "Corporate Governance and Value Creation: Evidence from Private Equity" Working Paper
Achleitner A-K., Bauer O., Figge C., Lutz E. (2012), "Exit of last resort? Empirical evidence on the returns and drivers of secondary buyouts as private equity exit channel" Working Paper
Achleitner A-K., Figge C. (2011), "Private Equity Lemons? Evidence on Value Creation in Secondary Buyouts" Working Paper
Bienz C., Leite T. (2008), "A Pecking Order of Venture Capital Exits." Working
Paper
Bonini S. (2010), "Secondary Buy-Outs." Working Paper
Brinkhuis S., De Maeseneire W. (2009), "What Drives Leverage in Leveraged Buyouts? An Analysis of European LBOs' Capital Structure" Working Paper
Guo S., Hotchkiss E., Song W. (2009), "Do Buyouts (Still) Create Value?" Journal of
Finance, Forthcoming
Jensen M. (1989), "Eclipse of the public corporation", Harvard Business Review,
67(5), 61-74
Jensen M. (1993), "The modern industrial revolution: exit and the failure of internal control systems", Journal of Finance, 48(3), 831-880
Kaplan, S., (1989), “Management Buyouts: Evidence on Taxes as A Source of Value.” Journal of Finance, 44(3), 611–632
Kaplan S., Stromberg P. (2009), "Leveraged buyouts and private equity", Journal
of Economic Perspectives, 23(1), 121-126
Modigliani F., Miller M. (1958), "The Cost of Capital, Corporation Finance and the Theory of Investment." American Economic Review, 48(3), 261-97
Masulis R. W., Nahata, R. (2007), “Venture Capital Conflicts of Interest: Evidence from Acquisitions of Venture Backed Firms”, Working paper
Phan P., Hill C. (1995), "Organizational Restructuring and Economic Performance in Leveraged Buyouts: An Ex Post Study" The Academy of Management Journal,
38(3), 704- 739
Smith A. (1990), "Corporate ownership structure and performance: The case of management buyouts" Journal of Financial Economics, 27(1), 143–164
Sousa M. (2010), "Why do Private Equity firms sell to each other?" Working
Paper
Sudarsanam P. (2005), "Exit Strategy for UK Leveraged Buyouts: Empirical Evidence on Determinants" Working Paper
Wang Y. (2010), "Secondary Buyouts: Why Buy and at What Price?" Working
Appendix
Figure 1: Buyouts in France (2003-2011)
Figure 1 shows the number of buyouts and the split between LBOs and SBOs in France from 2003 to 2011, collected from the database Capital Finance. These figures only include leveraged buyouts and do not include other types of buyouts, such as MBOs, MBIs, LMBIs, LBIs, BIMBOs or OBOs.
78% 80% 62% 55% 57% 77% 78% 62% 51% 22% 20% 38% 45% 43% 23% 22% 38% 49% 73 69 103 139 116 103 50 71 104 2003 2004 2005 2006 2007 2008 2009 2010 2011 LBOs SBOs
Figure 2: Exit strategies for PE firms (2007-2011)
Figure 2 shows the number of exits by PE firms in France from 2007 to 2011 and the distribution between the three exit strategies: IPO, trade sale and SBO. The 139 exit deals are collected from the database Zephyr.
31% 13% 3% 46% 65% 63% 43% 45% 23% 35% 37% 43% 52% 35 26 19 30 29 2007 2008 2009 2010 2011
Figure 3: Spread of corporate bonds on the risk-free rate (2003-2011) Figure 3 shows the spread of corporate bonds on the risk-free rate. As proxy for corporate bond yields we use Moody’s seasoned BAA bond index23, and for the risk-free rate 10-year U.S. government bond yields24.
23 We collect Moody’s seasoned BAA bond index from the Federal Reserve Bank of St. Louis
(http://research.stlouisfed.org/).
24 We collect the 10-year U.S. government bond yields from the U.S. Department of the Treasury
(http://www.treasury.gov/). 0% 2% 4% 6% 8% 10% 2003 2004 2005 2006 2007 2008 2009 2010 2011
Figure 4: Average deal value and multiples in France (2007-2011)
Figure 4 shows the average deal value in million Euros and the average EV/Sales and EV/EBITDA multiples from 2007 to 2011, based on the 438 buyouts collected from Capital Finance.
425 497 68 225 313 1,6x 3,2x 1,0x 1,6x 1,6x 9,5x 9,0x 5,9x 8,7x 8,7x 2007 2008 2009 2010 2011
Figure 5: Capital raised and invested by PE firms (2003-2011)
Figure 5 shows the amount of capital raised and invested in billion Euros by global PE firms from 2003 to 2011. The data is collected from Thomson One Banker. -100 200 300 400 500 2003 2004 2005 2006 2007 2008 2009 2010 2011
Table 1: Summary statistics - Pricing and leverage
Table 1 shows the summary statistics for the pricing and leverage for the 438 buyouts in France from 2007 to 2011 collected from Capital Finance and the differences between LBOs and SBOs. Statistical significance is calculated through a standard t-test for the average and a non-parametric Wilcoxon rank-sum test for the median. *, **, and *** denote statistical significance at the 10%, 5%, and 1% levels, respectively.
LBOs SBOs Total
Number of deals 275 163 438 Deal value (€m) Median 80 165*** 130 Average 300 372 337 Observations 75 80 155 EV/Sales Median 1,0x 1,4x** 1,2x Average 1,9x 1,7x 1,8x Observations 70 75 145 EV/EBITDA Median 8,4x 8,7x 8,7x Average 8,6x 8,9x 8,8x Observations 24 29 53 EV/EBIT Median 6,6x 10,5x 7,2x Average 6,7x 11,0x 9,1x Observations 7 9 16 Debt portion Median 50% 53% 50% Average 54% 57% 55% Observations 29 38 67
Table 2: Summary statistics - Sales growth and working capital
Table 2 is based on the 438 buyouts in France from 2007 to 2011 from Capital Finance and company data from Diane, and shows the summary statistics for the change in sales growth and working capital for three, two and one year after the transaction. A larger change in sales growth and a smaller change in working capital represent a higher improvement in operational efficiency. Statistical significance is calculated through a standard t-test for the average and a non-parametric Wilcoxon rank-sum test for the median. *, **, and *** denote statistical significance at the 10%, 5%, and 1% levels, respectively.
LBOs SBOs Total
∆ in sales growth +3 Median -7,8% -10,4% -9,4% Average -12,6% -28,8% -17,4% Observations 69 29 98 ∆ in sales growth +2 Median -0,8% -4.8%* -3,1% Average 5,1% -23.7%* -3,3% Observations 82 34 116 ∆ in sales growth +1 Median -1,9% -6.8%* -4,7% Average 31,5% -18.1%* 16,6% Observations 84 36 120 ∆ in working capital +3 Median -7,1% 21,8% -0,7% Average 7,4% 32,5% 15,0% Observations 71 31 102 ∆ in working capital +2 Median -20,7% -1,4% -13,6% Average 80,1% 23,7% 63,3% Observations 87 37 124 ∆ in working capital +1 Median 5,3% 4,5% 4,6% Average -13,9% 31,6% 0,4% Observations 85 39 124
Table 3: Summary statistics - EBITDA and EBIT margins
Table 3 is based on the 438 buyouts in France from 2007 to 2011 from Capital Finance and company data from Diane, and shows the summary statistics for the change in the EBITDA and EBIT margins for three, two and one year after the transaction. A larger change represents a higher improvement in operational efficiency. Statistical significance is calculated through a standard t-test for the average and a non-parametric Wilcoxon rank-sum test for the median. *, **, and *** denote statistical significance at the 10%, 5%, and 1% levels, respectively.
LBOs SBOs Total
∆ in EBITDA margin +3 Median -0,7% -0,8% -0,7% Average -1,6% 7.5%* 1,2% Observations 71 31 102 ∆ in EBITDA margin +2 Median -0,4% -0,9% -0,5% Average 0,0% 4,8% 1,4% Observations 87 37 124 ∆ in EBITDA margin +1 Median 0,2% -0,5% 0,0% Average 1,5% 2,2% 1,7% Observations 85 39 124 ∆ in EBIT margin +3 Median -0,8% -1,0% -0,9% Average -3,6% 8.4%** 0,0% Observations 71 31 102 ∆ in EBIT margin +2 Median -0,3% -1,6% -0,7% Average 0,3% 6.7%* 2,2% Observations 87 37 124 ∆ in EBIT margin +1 Median 0,3% -0,8% -0,4% Average 1,7% -1,1% 0,8% Observations 85 39 124
Table 4: Buyouts by industry (2007-2011)
Table 4 is based on the 438 buyouts in France from 2007 to 2011 from Capital Finance and shows the split of LBOs and SBOs by industry. High-multiple industries include consumer goods, industrial goods, healthcare, financial, technology, whereas low-multiple industries include basic materials, services, and utilities.
LBOs SBOs Total
Basic Materials 5 9 14 in % 2% 6% 3% Consumer Goods 64 48 112 in % 23% 29% 26% Financial 12 2 14 in % 4% 1% 3% Healthcare 26 7 33 in % 9% 4% 8% Industrial Goods 64 41 105 in % 23% 25% 24% Services 74 48 122 in % 27% 29% 28% Technology 23 7 30 in % 8% 4% 7% Utilities 7 1 8 in % 3% 1% 2% Total 275 163 438 in % 63% 37% 100% High-multiple industries 86 58 144 in % 31% 36% 33% Low-multiple industries 189 105 294 in % 69% 64% 67%
Table 5: Determinants of pricing in buyout deals
Table 5 shows the results from OLS regressions where the dependent variable is the acquisition price based on the EV/Sales and EV/EBITDA multiples. The data is collected from Capital Finance. The table shows 6 different specifications for each multiple. All regressions are clustered by year and industry. Standard errors are reported in parentheses. *, **, and *** denote statistical significance at the 10%, 5%, and 1% levels, respectively.
(1) (2) (3) (4) (5) (6) (7) (8) (9) (10) (11) (12) Financial dummy 0,061 0,061 0,060 0,060 0,063 0,063 0,134 0,134 0,129 0,129 0,124 0,124 (0,144) (0,236) (0,142) (0,235) (0,129) (0,231) (0,214) (0,085) (0,214) (0,094) (0,204) (0,074) Size 0.199*** 0.199*** 0.198*** 0.198*** 0.201*** 0.201*** 0.152** 0,152 0.158*** 0,158 0.155*** 0.155* (0,266) (0,042) (0,024) (0,042) (0,020) (0,044) (0,050) (0,076) (0,045) (0,075) (0,042) (0,064) High-multiple industry 0.236** 0.236** 0.237** 0.237** 0.235** 0.235** 0.367** 0,367 0.350*** 0,350 0.349*** 0,349 (0,071) (0,078) (0,069) (0,078) (0,069) (0,081) (0,090) (0,178) (0,095) (0,174) (0,090) (0,166)
Stock market return 0,115 0,115 0,075 0,075 -0,370 -0,370 -0,048 -0,048
(0,361) (0,101) (0,351) (0,107) (0,465) (0,324) (0,199) (0,364)
LBO spread 0,013 0,013 -0,091 -0.091**
(0,050) (0,023) (0,157) (0,028)
Intercept -1.012*** -1.012*** -0.972*** -0.972*** -0.984*** -0.984*** 1,287 1.287* 1.025** 1.025* 1.039*** 1.039* (0,261) (0,138) (0,140) (0,087) (0,109) (0,099) (0,721) (0,495) (0,321) (0,464) (0,298) (0,379)
Cluster by year No Yes No Yes No Yes No Yes No Yes No Yes
Cluster by industry Yes No Yes No Yes No Yes No Yes No Yes No
Observations 145 145 145 145 145 145 53 53 53 53 53 53
Adjusted R^2 0,191 0,191 0,191 0,191 0,191 0,191 0,337 0,337 0,330 0,330 0,330 0,330
Table 6: Change in operational efficiency - Sales growth
Table 6 shows the results from OLS regressions where the dependent variable is the change in sales growth three years (+3), two years (+2), and one year (+1) after the buyout deal. The data is collected from Capital Finance and Diane. The table shows 4 different specifications for each time period. All regressions are clustered by year and industry. Standard errors are reported in parentheses. *, **, and *** denote statistical significance at the 10%, 5%, and 1% levels, respectively.
(1) (2) (3) (4) (5) (6) (7) (8) (9) (10) (11) (12)
Financial dummy -0.124** -0,124 -0.108** -0,108 -0,112 -0.112* -0,117 -0.117* -0,215 -0,215 -0.340* -0,340 (0,049) (0,144) (0,036) (0,108) (0,081) (0,032) (0,069) (0,028) (0,130) (0,221) (0,176) (0,165) Sales growth at entry -0.887*** -0.887*** -0.894** -0.894** -1.077*** -1.077*** -1.077*** -1.077*** -1.036*** -1.036** -1.047*** -1.047***
(0,036) (0,026) (0,041) (0,043) (0,028) (0,024) (0,027) (0,026) (0,118) (0,127) (0,160) (0,060)
Sales at entry 0,033 0,033 -0,008 -0,008 -0.167** -0,167
(0,023) (0,056) (0,021) (0,004) (0,066) (0,130)
Intercept -0,457 -0,457 0,096 0,096 0,330 0.330** 0.200*** 0.200** 3.209** 3,209 0.460** 0.460** (0,310) (0,884) (0,078) (0,039) (0,310) (0,038) (0,038) (0,039) (1,184) (2,124) (0,137) (0,073)
Cluster by year No Yes No Yes No Yes No Yes No Yes No Yes
Cluster by industry Yes No Yes No Yes No Yes No Yes No Yes No
Observations 98 98 98 98 116 116 116 116 120 120 120 120
Adjusted R^2 0,654 0,654 0,651 0,651 0,775 0,775 0,775 0,775 0,271 0,271 0,242 0,242