Controlling the quality of grape juice adulterated by apple juice using ESI(-)FT-ICR mass spectrometry
Bruno G. Oliveira, Flavia Tosato, Gabriely S. Folli, Júlia A. de Leite, José A. Ventura, Denise C. Endringer, Paulo R. Filgueiras, Wanderson Romão
PII: S0026-265X(19)30982-8
DOI: https://doi.org/10.1016/j.microc.2019.104033
Article Number: 104033
Reference: MICROC 104033
To appear in: Microchemical Journal
Received date: 27 April 2019
Revised date: 22 June 2019
Accepted date: 22 June 2019
Please cite this article as: B.G. Oliveira, F. Tosato, G.S. Folli, et al., Controlling the quality of grape juice adulterated by apple juice using ESI(-)FT-ICR mass spectrometry, Microchemical Journal,https://doi.org/10.1016/j.microc.2019.104033
This is a PDF file of an unedited manuscript that has been accepted for publication. As a service to our customers we are providing this early version of the manuscript. The manuscript will undergo copyediting, typesetting, and review of the resulting proof before it is published in its final form. Please note that during the production process errors may be discovered which could affect the content, and all legal disclaimers that apply to the journal pertain.
ACCEPTED MANUSCRIPT
1
Controlling the Quality of Grape Juice adulterated by Apple
Juice using ESI(-)FT-ICR Mass Spectrometry
Bruno G. Oliveira,1,2 Flavia Tosato,1,2 Gabriely S. Folli,1,2 Júlia de A. Leite,1 José A. Ventura,3 Denise C. Endringer,4 Paulo R. Filgueiras,1,2 Wanderson Romão1,2,5*
1
Laboratório de Petroleômica e Forense, Universidade Federal do Espírito Santo (UFES), Avenida Fernando Ferrari, 514, Goiabeiras, Vitória, ES, CEP: 29075-910, Brazil.
2
Instituto Nacional de Ciência e Tecnologia Forense (INCT Forense), Brazil. 3
Instituto Capixaba de Pesquisa, Assistência Técnica e Extensão Rural (INCAPER), R. Afonso Sarlo, 160 - Bento Ferreira, Vitoria - ES, 29052-010.
4
Universidade Vila Velha-UVV, Rua Comissário José Dantas de Melo, 21, Boa Vista 29102-770, Espírito Santo, Brazil
5
Instituto Federal do Espírito Santo (IFES), Av. Ministro Salgado Filho, Soteco, Vila Velha,29106-010, Espírito Santo, Brazil.
*
ACCEPTED MANUSCRIPT
2
Graphical Abstract
Abstract
Food quality control is undoubtedly a process of great importance. The technological development of the last years has increased the food production and consumption, thus generating, an enormous demand for the food quality control. Grape juice is a very tasty and high quality nutraceutical drink, being widely consumed worldwide. This product has a high commercial value, making it source of several types of fraud, such as other juices’ addition, like apple juice. Through negative-ion mode electrospray ionization Fourier transform ion cyclotron resonance mass spectrometry, it was possible to detect and quantify apple juice in integral grape juice. In this study, we used the univariate linear regression model using mixtures of integral grape juice with various concentrations of integral apple juice (0, 1, 3, 5, 10, 15, 20, 25, 30, 35, 40, 45, 50, 55, 60, 65, 70, 75 and 100 wt%). The model showed good accuracy. In addition, eleven commercial samples of grape juice were tested, and in two of them, apple juice was detected at ≈ 25 wt%.
ACCEPTED MANUSCRIPT
3
1. Introduction
Integral grape juice presents excellent nutraceutical qualities and it has a great variety of health beneficial substances, like flavonoids and tannins.[1] Brazilian legislation determines that grape juice is an unfermented and undiluted beverage obtained from the edible part of the grape (Vitisssp.) through an appropriate technological process.[2] So, it is not allowed to add any substance to the juice, such as water, sugars or other fruit juices.
As grape juice is a high commercial value product, it is susceptible to many ways of adulteration such as: water’, sugars’ or fruits juices of less commercial value’ addition. In the latter, a good example is the apple juice addition into integral grape juice.[3-5]
Apple is a fruit of pleasant flavor and rich in pectin, a gelling agent and natural thickener that prevents juice phases’ separation.[6,7] Thus, apple juice’s addition is of difficult detection and can mask water or other additives’ addition to the grape juice.
Grape juice adulteration control methodologies through apple juice addition are rare. Nowadays, one of the most used methods for fraud detection in juices is based in isotope ratio mass spectrometry.[4,8,9] However, this method is the most used to detect adulterants like corn or cane’ sugars (via C4 of fixation of CO2), and it is not very effective in the differentiation of sugars originating from grape and apple natural juices, in which, they have a closer percentage of carbon-13.[4] In this case, they showed a similar CO2 fixation mechanism (via C3).[4,8,9] The detection of two markers of apple juice (phlorizin e sorbitol) was used for the apple juice identification and quantification into the integral grape juice,[3] but, due to the sample complexity, which may undergo diverse influences such as maturation stage, cultivar type and climatic variations; a greater number of markers (n > 2) is ever necessary to detect and quantify the
ACCEPTED MANUSCRIPT
4
adulteration in a more reliable way. Therefore, the development of analytical methodologies to detect and quantify adulterations in grape juice is a challenge.
Mass spectrometry (MS) techniques such Fourier transform ion cyclotron resonance mass spectrometry (FT-ICR MS) allows the identification of chemical constituents in complex organic mixtures.[10-13]More aligned with the propositions of this paper, the electrospray ionization (ESI) is a soft ionization technique whose main purpose is "picking up" ions directly from sample solution to the gas phase environment of mass spectrometers.[14] The coupling of ESI source with ultra-high resolution mass spectrometer, such as FT-ICR MS, provides the highest available mass, mass resolving power and mass accuracy (lowest mass error) when compared to other types of mass instruments.[15] It enables the analysis on a molecular level without prior extraction or separation steps.[15,16] ESI-FT-ICR MS has been applied in metabolomics studies, and it has proved to be an excellent approach to control the quality of fruits. High-resolution MS enables the separation and detection of thousands of ions produced by specific compounds. This technique provides accurate important information such as the elemental formula (CcHhNnOo), double bound equivalent (DBE), isotopologue profile, and chemical connectivity (from collision induced dissociation (CID) experiments).[10-13]. However, there are some limitations regarding unambiguous identification of isomers what in some cases can be overcome by performing ESI-MS/MS. Generally, the main advantage of ESI(±)FT-ICR MS technique, in relation to gas chromatography mass spectrometry, for instance, is related to fact of to provide information on molecular level of the molecules with wider molecular weight range (Mw from 200 to 3000 Da) without the need of pre-separation step (the analysis is done via direct infusion of ESI source), being therefore, able to identify thousands of compounds. Besides, the analysis time is fast (t ~ 30 s). On the other hand, the GC-MS provides
ACCEPTED MANUSCRIPT
5
information of low molecular weight molecules (< 500 Da), where the molecules need to have thermal stability.[17]
In this work, a methodology to detect and quantify apple juice into grape juice commercial samples using direct injection by negative-ion mode electrospray ionization Fourier transform ion cyclotron resonance mass spectrometry (ESI(-)FT-ICR MS) combined to an univariate calibration method and Principal Component Analysis (PCA). Posteriorly, the developed method was tested in the analysis of 11 grape juice commercial samples.
2. Materials and Methods
2.1 Samples
Mixtures of integral grape juice and integral apple juice were prepared, in triplicate, in the following concentrations of apple juice: 0, 1, 3, 5, 10, 15, 20, 25, 30, 35, 40, 45, 50, 55, 60, 65, 70, 75, and 100 wt%. Moreover, eleven brands of integral grape juice bought in local supermarket were analyzed in triplicate: Casa da Uva®, Serra da Uva®, Aurora®, Sunny Day®, Salton®, Natural One®, Campo Largo®, Garibaldi®, UvaSó®, Mito®and Campo Largo Uva Leve®.The juices were randomly named as Grape Juice 1, 2, 3, 4, 5, 6, 7, 8, 9, 10 and 11.
2.2 ESI(-)FT-ICR MS analysis
For analysis in the ESI(-)FT-ICR MS (model 9.4 T Solarix, Bruker Daltonics, Bremen, Germany), 2.5 µL of juice and 23 µg of deuterated glucose D-Glucose-1,2,3,4,5,6,6-d7 (SIGMA) were added to 975 µL of methanol. The extracts were injected in triplicate directly into the ESI(-) source using a syringe with 2.0 µL h-1 flow. The mass spectra were obtained into a mass range m/z 150-1500. The ESI source
ACCEPTED MANUSCRIPT
6
conditions were: nebulizer gas pressure of 2 bar, capillary voltage of 3.8 kV and capillary transfer temperature of 200°C. The ions accumulation time was of 0.01 s. Each spectrum was acquired through the accumulation of 16 scans. The mass spectra were obtained with high resolution (16 M) providing unequivocal molecular formulas for the single charged molecular ions (CcHhNnOoSs species). The mass spectra were acquired and processed using the Compass Data Analysis software (Bruker Daltonics®, Bremen, Germany). The compounds’ structural formulas were obtained through ChemSpider database software (www.chemspider.com).
For MS/MS experiments, the quadrupole window was closed in a range of 1 Da. The collision energy was of 7 V and the collision gas used was argon. In order to increase the amount of ions in the ICR cell (FTMS analyzer), the ions accumulation time in the hexapole was of 0.02 s. Each spectrum was acquired through the accumulation of 16 scans with a time domain of 16M (mega-point).
2.3 Univariate Calibration
For the construction of the univariate calibration curve, the values of the sum of ratio of the signals intensities of five markers present in apple juice (m/z 439, 475, 483, 491 and 521) were used versus the intensity of the internal standard signals, the dopant D-Glucose-1,2,3,4,5,6,6-d7 (m/z 366), added at the concentration of 23.53 µg mL-1.[11]
A total of fourteen points were used to construct the calibration curve (0, 1, 3, 5, 15, 20, 30, 35, 45, 50, 60, 65, 75 and 100 wt% of apple juice), where five of them were used to evaluate the method accuracy (10, 25, 40, 55 and 70 wt% of apple juice).The detection (LOD) and quantification (LOQ) limits were calculated using the equations 1 and
2:[18]
𝐿𝑂𝐷 = 2𝑡1−𝛼, 𝛿0 4
ACCEPTED MANUSCRIPT
7
𝐿𝑂𝑄 = 10. 𝛿0 (2)
Where t is the student t, is the degree of freedom, 𝛿0 is the standard deviation of the calibration samples, and α is the confidence level.
The five points (10, 25, 40, 55 and 70 wt% of apple juice) were used to calculate the method accuracy from relative error calculation through equation 3: [19]
% 𝑅𝑒𝑙𝑎𝑡𝑖𝑣𝑒 𝐸𝑟𝑟𝑜𝑟 =𝑋𝑙𝑎𝑏−𝑋𝑣
𝑋𝑣 100 (3)
where 𝑋𝑙𝑎𝑏 is the concentration of apple juice experimentally found and 𝑋𝑣 is the true value.
2.4 Chemometric analyses
The Principal Component Analysis (PCA) was applied to a data matrix constructed from the triplicate of 19 different concentrations of apple juice into grape juice (0, 1, 3, 5, 10, 15, 20, 25, 30, 35, 40, 45, 50, 55, 60, 65, 70, 75, 100 wt%), totalizing 57 samples. The chosen variables were the intensity ratios of each marker (m/z 439, 475, 483, 491 and 521) by the intensity of the internal standard D-Glucose-1,2,3,4,5,6,6-d7 (m/z 366), in concentration of 23.53 µg/mL, obtaining a total of five variables per sample. The matrix rows were filled with the samples and the columns with the variables. MATLAB 9.0 (R2013a) was used to perform the data preprocessing (centering the values in the mean) and the models’ construction. Moreover, another matrix constructed from 11 grape juice commercial samples, also in triplicate, totaling 33 rows, with the same variables and five columns was applied to assimilate the real percentage (wt %) of apple juice in the commercial samples.
ACCEPTED MANUSCRIPT
8
3. Results and Discussion
3.1 ESI(-)FT–ICR MS analysis
ESI(-)FT-ICR mass spectra of all the mixtures containing integral apple and grape juices were acquired, in triplicate, in concentrations varying from 0 to 100 wt% of apple juice doped with glucose-1,2,3,4,5,6,6-d7 at 23.53 µg mL-1. For the calibration model construction, five markers of apple juice, as well as the internal standard signal were used, where their respective molecular formulas (M), DBE values, mass error (in ppm), m/z of their fragments and proposed structure are shown in Table 1. The compound 1, [C12H16D7O12]– ion of m/z 366, is identified as adduct composed of a glucose molecule and of the glucose-1,2,3,4,5,6,6-d7. The CID experiment confirms the compound connectivity through the formation of the fragments of m/z 186 and 179 that correspond to the glucose and glucose-1,2,3,4,5,6,6-d7 losses, respectively (Fig. 1Sa,
supplementary material). The compound 2, [C19H20O12 - H]– ion of m/z 439, is identified as Maclurin 3-C-glucoside and its fragmentation profile shows fragment of m/z 259 due to the hexoside ring loss (Fig. 1Sb). The compound 3, ion [C16H28O16 - H]– of m/z 475, is identified as a trisaccharide and its fragmentation profile generates the ion of m/z 295 due to the loss of a hexoside ring (Fig. 1Sc). The compound 4, [C15H28O15+ Cl]– ion of m/z 483, is identified as an apple juice marker, however, it is not possible to attribute a chemical structure to this signal from its ESI(-)MS/MS spectrum. The compound 5, [C16H28O17 - H]– ion of m/z 491, is identified as an adduct of disaccharide/dihydroxybutanedioic acid, where its fragmentation gave rise the ion of m/z 311, related to hexoside ring loss (Fig. 1Sd). Lastly, the compound 6, [C18H34O17- H]–ion of m/z 521, is identified as an adduct of disaccharide and monosaccharide and its fragmentation profile created the ion of m/z 341, produced from the neutral elimination of a 180 Da monosaccharide (Fig. 1Se).
ACCEPTED MANUSCRIPT
9
Table 1. Chemical species proposed from ESI(-)FT-ICR MS.
m/z Molecular Formula [M - H] -DBE Error (ppm) MS/MS ChemicalIdentification 1 366.16357 C12H16D7O12 1 -0.36 186; 179
Adduct of glucose and deuterated glucose 2 439.08612 C19H19O12 10 4.74 259 Maclurin 3-C-glucoside 3 475.13074 C16H27O16 3 -0.60 295 Trisaccharide 4 483.11235 C15H28ClO15 1 -0.27 324; 295 - 5 491.12571 C16H27O17 3 -0.69 311 Adduct of disaccharide/ dihydroxybutanedioic acid 6 521.17270 C18H33O17 2 -0.73 341 Adduct of disaccharide and monosaccharide
It is possible to observe in the ESI(-)FT-ICR mass spectra that the signals intensities of the deuterated glucose (values highlighted in red) decrease while the intensities of the signals corresponding to the natural markers (values highlighted in blue) increase in function of the apple juice concentration (Figure 1).
The juices glycidic profile is an important parameter to evaluate possible adulterations of other fruits that can be added as juices and that possess inferior commercial value. Although various factors as maturation stage and harvest season, which affect the fruits sugars contents, in general, there is constancy in the relation between the contents of the different sugars of each fruit.[20] Previous works have
shown that grape fruit presents high content of the glucose’ and
fructose’monosaccharides in relation to the low content of the disaccharide sucrose, whereas, apple fruitshows the disaccharides/monosaccharides ratio higher than the grape fruit.[20,21] Analyzing the ESI(-) mass spectra, it was possible to notice that with the increase of the apple juice content, there was an increase of the signals intensities in
ACCEPTED MANUSCRIPT
10
the region of m/z 400-600 in which predominates the presence of the disaccharides (Figure 1).
Figure 1. ESI(-)FT-ICR mass spectra of grape/apple juices mixtures at 100/0, 75/25, 50/50, 25/75 and 0/100 wt%.
3.2 Univariate Calibration
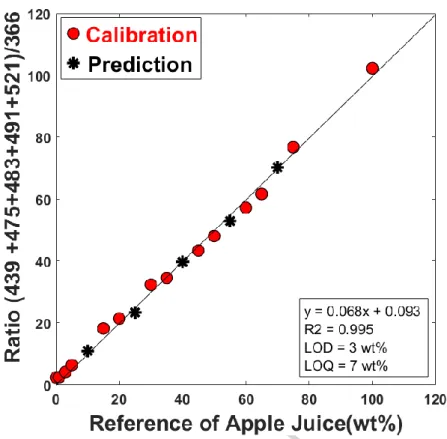
A calibration curve was obtained using the grape:apple juices mixtures in concentrations from 0 to 100 wt% of apple juice. Fourteen points were used to construct the calibration model, where five of them (10, 25, 40, 55 and 70 wt% of apple juice) were used to check the method accuracy. The analytical curve shows linearity with R2 = 0.995 (Figure 2). The LOD and LOQ values were of 3 wt% and 7 wt%, respectively. The method accuracy was measured using the five points chosen for test. The test samples with concentration 10, 25, 40, 55 and 70 wt% of apple juice presents mean relative errors of -1.7, -9.7, -1.8, -3.8 and 0.9%, respectively. For example, the mixture containing 10 wt% of apple juice can vary up to ± 1.7% of its true value. The best
ACCEPTED MANUSCRIPT
11
accuracy was obtained for samples whose concentrations were of 10, 40, 70 wt%, in which, the measured samples varied less than the true value while the samples of 25 and 55 wt% concentrations had higher variations in their predictions. Nevertheless, all variations were lower than 10 wt% in relation to the actual content, which means a good accuracy of model.
Eleven commercial grape juices samples were applied to linear regression and the result is expressed in Table 2. Nine samples did not show apple juice content or presented values below the LOD (< 3 wt%) while two samples remaining (Grape juice 9 and Grape juice 11) show apple juice contents of 24 ± 1 wt%.
The univariate model showed linear, having R2 of 0.9950, and with relative error of 4.8%. For low apple juice concentrations (< 10 wt%), the model presented lower LOD (3 wt%) and LOQ (7 wt%) values, producing RMSEp = 0.7. The advantage of the univariate model lies in the fact that the calculations employed are less complex, already consolidated in the field of analytical chemistry and available in many statistical software packages.
ACCEPTED MANUSCRIPT
12
Figure 2. Calibration curve constructed from a univariate model for quantification of apple juice in grape juice.
Table 2. Content of apple juice in commercial grape juices.
Grape Juice % Apple Juice
Linear Regression 1 NQ 2 NQ 3 NQ 4 NQ 5 NQ 6 NQ 7 NQ 8 NQ 9 24 ± 1 10 NQ 11 24 ± 1
ACCEPTED MANUSCRIPT
13
3.3 Chemometric analysis
A PCA model was constructed from ESI(-)FT-ICR MS data of 19 grape and apple juice mixtures whereupon the two principal components, PC1 and PC2, explain together 98.92 % of the total variance (Figure 3). The purpose is to select regions related to the apple juice addition in grape juice. It was possible to verify an apple juice concentration increase tendency from the positive quadrant to the negative quadrant of PC1, in other words, the further to the left of the negative quadrant of PC1, the greater the adulteration by apple juice. It is important to verify that even with addition of small quantities of adulterant; there was an evident separation between the samples (from 0 to 10wt% of apple juice) from PCA model constructed.
The mass spectra for eleven commercial grape juice samples were applied to the PCA model. Of all of them, only the samples Grape juice 9 and Grape juice 11 appear shifted on the negative direction of PC1. These samples appear in a region close to the calibration samples with a content of ≈ 25 wt% of apple juice. These results are consistent with the values obtained in the univariate model constructed.
Figure 3. PCA analysis containing scores plots for the grape juice samples adulterated with different contents of apple juice. The size of the marker is proportional to the content of adulterant in the samples.
ACCEPTED MANUSCRIPT
14
The variables more related to apple juice adulteration in grape juice can be observed from the loadings graph (Figure 4), in which the abscissas axis represents the variables (m/z) and the ordinates axis correspond to the loadings of each variable. The abundance of loading values indicates the importance of each variable in the model. For PC1 loadings graph (Figure 4a), all the five variables has inverse influence in the model, that is, at PC1<0 region. The m/z 475.13 variable (loading = -0.7027) is the most important while the m/z 491.13 (loading = -0.1231) was the least significant. The PC2 loadings graph (Figure 4b) show that the m/z 475.13 (loading = -0.1041) and 483.11 (loading = -0.4776) variables inversely influence the model, PC2<0 region, whereas m/z439.09 (loading = +0.2342), 491.13 (loading = +0.5921) and 521.17 (loading = +0.5963) has influenced in PC2>0 region. The most significant variables at PC2 were of m/z 491.13 and 521.17. Analyzing PC1 and PC2 loadings graphs in concomitance (Figure 4), it is observed that the most important variables are m/z 475.1, 491.13 and
521.17, that correspond to disaccharides molecules that possess higher intensities in the ESI(-)FT-ICR mass spectra, as illustrated in Figure 1.
Figure 4. PCA analysis containing loadings plots to PC1 (a) and PC2 (b) for the grape juice samples adulterated with different contents of apple juice.
ACCEPTED MANUSCRIPT
15
4. Conclusions
The FT-ICR MS technique associated to univariate calibration model showed to be a reliable procedure for the identification and quantification of apple juice into integral grape juice. The PCA, made from the intensities ratio of the five natural markers found in the fruit (m/z 439, 475, 483, 491 and 521) by the internal standard intensity (m/z 366) provided good separation between the 19 different apple juice contents (wt%) in integral grape juice. Among the studied commercial samples, two (Grape juice 9 and 11) exhibited similar contents of apple juice, about 25 wt%.
5. Acknowledgements
The authors thank CAPES (23038.007083/2014-40), FAPES (76459934/16), and CNPq (445987/2014-6, and 465450/2014-8) for financial support. The authors would also like to thank the Núcleo de Competências em Química do Petróleo for using their installations.
Funding: This study was funded by Conselho Nacional de Desenvolvimento Científico
e Tecnológico – CNPQ (310680/2016-6; 445987/2014-6, and 465450/2014-8); Coordenação de Aperfeiçoamento de Pessoal de Nível Superior - CAPES (23038.007083/2014-40), and Fundação de Amparo à Pesquisa do Espírito - FAPES (76459934/16).
Conflict of Interest: Author A declares that he has no conflict of interest. Author B
declares that she has no conflict of interest. Author C declares that he has no conflict of interest. Author D declares that she has no conflict of interest. Author E declares that she has no conflict of interest. Author F declares that he has no conflict of interest.
ACCEPTED MANUSCRIPT
16
Author G declares that she has no conflict of interest.Author H declares that he has no conflict of interest.
Author contributions: Author Acontributed with the acquisition, analysis,
interpretation of data for the work and drafting the work and revising it critically for important intellectual content; Author B, author C and Author D contributed with the acquisition of the data. Author C contributed with interpretation of data for the work and drafting the work and revising it critically for important intellectual content, Authors E and F contributed with interpretation of data for the work and revising it critically for important intellectual content. Author G and Author H contributed with designing the work and drafting the work and revising it critically for important intellectual content. The entire author approved the version to be published.
Institutional Review Board (IRB): Review by the IRB was not required for this study
because human subjects were not involved, as per US Department of Health and Human Services guidelines.
Ethical approval: This article does not contain any studies neither with animals nor
with humans performed by any of the authors.
Informed consent: not applied.
6. References
[1] Frankel EN, Bosanek CA, Meyer AS, SillimanK, Kirk LL. Commercial Grape Juices Inhibit the in Vitro Oxidation of Human Low-Density Lipoproteins. J Agric Food Chem 1998; 46(3): 834-838.
ACCEPTED MANUSCRIPT
17
[2] Brasil. Leis, Decretos, etc. Instrução Normativa nº 1, de 7 jan. 2000, do Ministério da Agricultura. Diário Oficial da União, Brasília, n. 6, 10 jan. 2000. Seção I, p. 54-58. Aprova os Regulamentos Técnicos para fixação dos padrões de identidade e qualidade para polpas e sucos de frutas.
[3] Spinelli FR, Dutra SV, Carnieli G, Leonardelli S, Drehmer AP. Vanderlinde R. Phlorizin and sorbitol in Vitislabrusca grape juices. Food Control 2016;69:1-4.
[4] Silva BM, Seabra RM, Andrade PB, Oliveira MB, Ferreira MA. Adulteração por adição de açúcares a sumos de frutos: uma revisão adulteration of fruit juice by addition of sugars: a review adulteración por adición de azúcares a zumos de frutas: una revisión. CYTA-Journalof Food 1999;2(4):184-191.
[5] Thavarajah P, Low NH. Adulteration of Apple with Pear Juice: Emphasis on Major Carbohydrates, Proline, and Arbutin. J Agric Food Chem 2006; 54:4861-4867.
[6] Pancerz M, Ptaszek A, Sofińska K, Barbasz J, Szlachcic P, Kucharek M, Łukasiewicz M. Colligative and hydrodynamic properties of aqueous solutions of pectin from cornelian cherry and commercial apple pectin. Food Hydrocoll 2018, doi.org/10.1016/j.foodhyd.2018.10.060.
[7] Qiu NX, Tian YX, Qiao ST, Hong DENG. Apple Pectin Behavior Separated by Ultrafiltration. Agric Sci China 2009;8(10):1193-1202.
[8] Figueira R, Nogueira AMP, Ducatti C, Mischan, MM. Boletim Centro de Pesquisa de Processamento de Alimentos 2010;233-246.
[9] Anon, AOAC Official Methods of Analysis, 1990a;981(9):926.
[10] Costa HB, Souza LM, Soprani LC, Oliveira BG, Ogawa EM, Korres AMN, Ventura JA, Romão W. Monitoring the physicochemical degradation of coconut water using ESI-FT-ICR MS. Food Chem 2014;174:139-146.
[11] Ogawa EM, Costa HB, Ventura JA, Caetano LCS, Pinto FE, Oliveira BG, Barroso MES, Scherer R, Endringer DC, Romão W. Chemical profile of pineapple cv. Vitória in different maturation stages using electrospray ionization mass spectrometry. J Sci Food Agric2018;98:105-1116.
[12] Oliveira BG, Costa HB, Ventura JA, Kondratyuk TP, Barroso MES, Correia RM, Pimentel EF, Pinto FE, Endringer DC, Romão W. Chemical Profile of Mango (Mangiferaindica L.) using Electrospray Ionisation Mass Spectrometry (ESI-MS). FoodChem 2016;204:37-45.
ACCEPTED MANUSCRIPT
18
[13] Correia RM, Loureiro LB, Rodrigues RRT, Costa HB, Oliveira BG, Filgueiras PR, Thompson CJ, Jr VL, Romão W. Chemical Profile of Robusta and Arabica Coffee by ESI(-)FT-ICR MS and ATR-FTIR: a Quantitative Approach. Anal Methods 2016;8:7678-7688.
[14] Fenn JB. Electrospray ionization mass spectrometry: How it all began. J Biomol Tech 2002;13:101–118.
[15] Kill JB, Oliveira IF, Tose LV, Costa HB, Kuster RM, Machado LF, Correia RM, Rodrigues RRT, Vasconcello GA, Vaz BG, Romão W. Chemical Characterization of Synthetic Cannabinoids by Electrospray Ionization FT-ICR Mass Spectrometry. Foren. Sci. Int. 2016;266:474–487.
[16] Nascimento IR, Costa HB, Souza LM, Soprani LC, Merlo BB, Romão W. Chemical identification of cannabinoids in street marijuana samples using electrospray ionization FT-ICR mass spectrometry. Anal. Methods 2015;7:1415–1424.
[17] Borille BT, Ortiz RS, Mariotti KC, Vanini G, Tose LV, Filgueiras PR, Marcelo MCA, Ferrão MF, Anzanello MJ, Limberger RP, Romão W. Chemical profiling and classification of cannabis through electrospray ionization coupled to Fourier transform ion cyclotron resonance mass spectrometry and chemometrics. Analytical Methods 2017; 9:4070-4081.
[18] Currie LA. (1999). Nomenclature in evaluation of analytical methods including detection and quantification capabilities: (IUPAC Recommendations 1995). Analytica Chimica Acta, 391(2), 105-126.
[19] Instituto Nacional de Metrologia, Normalização e Qualidade Industrial (INMETRO); Orientações sobre Validação de Métodos de Ensaios Químicos, DOQ-CGCRE-008, 2007.
[20] Wrolstad RE, Shallenberger RS. Free sugars and sorbitol in fruits--a complication from the literature. JAssoc Off Anal Chem 1981;64:91-103.
[21] Hammond DA. Authenticity of fruit juices, jams and preserves. Food Authentication, London, eds. Ashurst, P. R. e Dennis, M. J., Blackie Academic & Professional, 1996.
ACCEPTED MANUSCRIPT
19
Highlight
Grape juice is a very tasty and high quality nutraceutical drink, being widely consumed worldwide;
This product has a high commercial value, making it source of several types of fraud;
ESI-FT-ICR MS coupled to regression models showed good accuracy to quantify apple juice in integral grape juice;
Eleven commercial samples of grape juice were tested, and in two of them, apple juice was detected;