Université de Montréal
Improving photofermentative hydrogen production
through metabolic engineering and DOE
(Design of Experiments)
Par Yuan Liu
Département de microbiologie, infectiologie et immunologie Faculté de Médecine
Thèse présentée à la Faculté des Études Supérieures et Postdoctorales en vue de l’obtention du grade de Ph.D.
en Microbiologie et Immunologie
Mars, 2016
Université de Montréal Faculté des Études Supérieures
Cette thèse intitulée:
Improving photofermentative hydrogen production through metabolic
engineering and DOE (Design of Experiments)
Présentée par:
Yuan Liu
A été évaluée par un jury composé des personnes suivantes:
Dr. George Szatmari, Président-rapporteur
Dr. Patrick C. Hallenbeck, Directeur de recherché
Dr. Luke Masson, Membre du jury
RÉSUMÉ
A l’heure actuelle, les biocarburants renouvelables et qui ne nuit pas à l'environnement sont à l'étude intensive en raison de l'augmentation des problèmes de santé et de la diminution des combustibles fossiles. H2 est l'un des candidats les plus prometteurs en raison de ses
caractéristiques uniques, telles que la densité d'énergie élevée et la génération faible ou inexistante de polluants. Une façon attrayante pour produire la H2 est par les bactéries
photosynthétiques qui peuvent capter l'énergie lumineuse pour actionner la production H2
avec leur système de nitrogénase. L'objectif principal de cette étude était d'améliorer le rendement de H2 des bactéries photosynthétiques pourpres non sulfureuses utilisant une
combinaison de génie métabolique et le plan des expériences.
Une hypothèse est que le rendement en H2 pourrait être améliorée par la redirection de flux
de cycle du Calvin-Benson-Bassham envers du système de nitrogénase qui catalyse la réduction des protons en H2. Ainsi, un PRK, phosphoribulose kinase, mutant « knock-out » de
Rhodobacter capsulatus JP91 a été créé. L’analyse de la croissance sur des différentes sources de carbone a montré que ce mutant ne peut croître qu’avec l’acétate, sans toutefois produire d' H2. Un mutant spontané, YL1, a été récupéré qui a retenu l'cbbP (codant pour PRK) mutation
d'origine, mais qui avait acquis la capacité de se développer sur le glucose et produire H2. Une
étude de la production H2 sous différents niveaux d'éclairage a montré que le rendement
d’YL1 était de 20-40% supérieure à la souche type sauvage JP91. Cependant, il n'y avait pas d'amélioration notable du taux de production de H2. Une étude cinétique a montré que la
croissance et la production d'hydrogène sont fortement liées avec des électrons à partir du glucose principalement dirigés vers la production de H2 et la formation de la biomasse. Sous
importante, ce qui suggère une nouvelle amélioration additionnel du rendement H2 pourrait
être possible grâce à l'optimisation des processus.
Dans une série d'expériences associées, un autre mutant spontané, YL2, qui a un phénotype similaire à YL1, a été testé pour la croissance dans un milieu contenant de l'ammonium. Les résultats ont montré que YL2 ne peut croître que avec de l'acétate comme source de carbone, encore une fois, sans produire de H2. Une incubation prolongée dans les milieux qui ne
supportent pas la croissance de YL2 a permis l'isolement de deux mutants spontanés secondaires intéressants, YL3 et YL4. L'analyse par empreint du pied Western a montré que les deux souches ont, dans une gamme de concentrations d'ammonium, l'expression constitutive de la nitrogénase. Les génomes d’YL2, YL3 et YL4 ont été séquencés afin de trouver les mutations responsables de ce phénomène. Fait intéressant, les mutations de nifA1 et nifA2 ont été trouvés dans les deux YL3 et YL4. Il est probable qu'un changement conformationnel de NifA modifie l'interaction protéine-protéine entre NifA et PII protéines (telles que GlnB ou GlnK), lui permettant d'échapper à la régulation par l'ammonium, et donc d'être capable d'activer la transcription de la nitrogénase en présence d'ammonium. On ignore comment le nitrogénase synthétisé est capable de maintenir son activité parce qu’en théorie, il devrait également être soumis à une régulation post-traductionnelle par ammonium. Une autre preuve pourrait être obtenue par l'étude du transcriptome d’YL3 et YL4. Une première étude sur la production d’ H2 par YL3 et YL4 ont montré qu'ils sont capables d’une beaucoup plus
grande production d'hydrogène que JP91 en milieu d'ammonium, qui ouvre la porte pour les études futures avec ces souches en utilisant des déchets contenant de l'ammonium en tant que substrats.
Enfin, le reformage biologique de l'éthanol à H2 avec la bactérie photosynthétique,
Rhodopseudomonas palustris CGA009 a été examiné. La production d'éthanol avec fermentation utilisant des ressources renouvelables microbiennes a été traitée comme une technique mature. Cependant, la plupart des études du reformage de l'éthanol à H2 se sont
concentrés sur le reformage chimique à la vapeur, ce qui nécessite généralement une haute charge énergetique et résultats dans les émissions de gaz toxiques. Ainsi le reformage biologique de l'éthanol à H2 avec des bactéries photosynthétiques, qui peuvent capturer la
lumière pour répondre aux besoins énergétiques de cette réaction, semble d’être plus prometteuse. Une étude précédente a démontré la production d'hydrogène à partir d'éthanol, toutefois, le rendement ou la durée de cette réaction n'a pas été examiné. Une analyse RSM (méthode de surface de réponse) a été réalisée dans laquelle les concentrations de trois facteurs principaux, l'intensité lumineuse, de l'éthanol et du glutamate ont été variés. Nos résultats ont montré que près de 2 moles de H2 peuvent être obtenus à partir d'une mole
d'éthanol, 33% de ce qui est théoriquement possible.
Mots clés: bactéries photosynthétique pourpre non sulfureuse; cycle de Calvin-Benson-Bassham; génie métabolique; mutant PRK; YL1, YL2, YL3 et YL4; étude cinétique; rendement H2 et le taux de production volumétrique; l'analyse de la répartition des électrons;
transcription du nitrogénase; séquençage du génome; NifA1 et NifA2; Reformage biologique; la méthode de surface de réponse.
ABSTRACT
Currently, renewable and environmentally friendly biofuels are under intensive study due to increasing health concerns and diminishing fossil fuels. H2 is one of the most promising
candidates due to its unique characteristics, such as a high energy density and low to non-existent generation of pollutants. One attractive way to produce H2 is through photosynthetic
bacteria which can capture light energy to drive H2 production with their nitrogenase system.
The major aim of this study was to improve H2 yield of the purple non-sulfur photosynthetic
bacteria using a combination of metabolic engineering and design of experiments.
One hypothesis was that H2 yield could be improved by redirection of
Calvin-Benson-Bassham cycle flux to the nitrogenase system which catalyzes the reduction of protons to H2.
Thus, a PRK, phosphoribulose kinase, knock out mutant of Rhodobacter capsulatus JP91 was created. Analysis of growth with different carbon sources showed that this mutant could only grow in acetate medium without, however, producing any H2. A spontaneous mutant, YL1,
was recovered which retained the original cbbP (encoding PRK) mutation, but which had gained the ability to grow on glucose and produce H2. A study of H2 production under
different illumination levels showed that the yield of YL1 was 20-40% greater than the wild type JP91 strain. However, there was no appreciable improvement of the H2 production rate.
A kinetic study showed that growth and hydrogen production are strongly linked with electrons from glucose being mostly directed to H2 production and biomass formation. Under
low to intermediate light intensities, the production of organic acids was significant, suggesting further improvement of H2 yield is possible by process optimization.
In a related series of experiments, another spontaneous mutant, YL2, which has a similar phenotype to YL1, was tested for growth in ammonium-containing media. The results showed
that YL2 could only grow with acetate as carbon source, again, without producing any H2.
Prolonged incubation in media not supporting growth of YL2 enabled the isolation of two interesting secondary spontaneous mutants, YL3 and YL4. Western blot analysis showed that both strains had constitutive nitrogenase expression under a range of ammonium concentrations. The genomes of YL2, YL3 and YL4 were sequenced in order to find the mutations responsible for this phenomenon. Interestingly, mutations of nifA1 and nifA2 were found in both YL3 and YL4. It is likely that a conformational change of NifA alters the protein-protein interaction between NifA and PII proteins (such as GlnB or GlnK), enabling it to escape regulation by ammonium and thus to be capable of activating nitrogenase transcription in the presence of ammonium. It is not clear how the synthesized nitrogenase is able to maintain its activity since in theory it should also be subject to posttranslational regulation by ammonium. Further evidence could be obtained by studying the transcriptome of YL3 and YL4. An initial study of H2 production by YL3 and YL4 showed that they are
capable of much greater hydrogen production than JP91 in ammonium medium, which opens the door for future studies with these strains using ammonium-containing wastes as substrates.
Finally, the biological reformation of ethanol to H2 with the photosynthetic bacterium,
Rhodopseudomonas palustris CGA009 was examined. Ethanol production with microbial fermentation using renewable resources has been treated as a mature technique. However, most studies of the reformation of ethanol to H2 have focused on chemical steam reforming,
which usually requires a high energy input and results in toxic gas emission. Thus biological reformation of ethanol to H2 with photosynthetic bacteria, which can capture light to meet the
energy requirement of this reaction, seems to be more promising. A previous study had demonstrated hydrogen production from ethanol, however, the yield or the duration of this
reaction were not examined. A RSM (response surface methodology) analysis was carried out in which three key factors, light intensity, ethanol and glutamate concentrations were varied. Our results showed that nearly 2 moles of H2 could be obtained from one mole of ethanol, 33%
of what is theoretically possible.
Key words: Purple non-sulfur photosynthetic bacterium; Calvin-Benson-Bassham cycle; metabolic engineering; PRK mutant; YL1, YL2, YL3 and YL4; kinetics study; H2 yield and
volumetric production rate; electron allocation analysis; nitrogenase transcription; genome sequencing; NifA1 and NifA2; biological reformation; response surface methodology.
TABLE OF CONTENTS
RÉSUMÉ……….………...…….i
ABSTRACT………...….iv
TABLE OF CONTENTS………...……….vii
LIST OF FIGURES ………....ix
ABBREVIATIONS………..….x
FOOTNOTES………..xii
ACKNOWLEDGEMENTS……….……..xiii
LITERATURE REVIEW……….………1
CHAPTER 1: Research background………...2
1. Production of H2 and some other biofuels……….…..2
1.1 Bioethanol, general characteristics, producers and current production status……...…. 2
1.2 Biobutanol, general characteristics, producers and current production status………...4
1.3 Biodiesel, general characteristics, producers and current production status………4
1.4 H2, general characteristics, producers, metabolic pathways………...….6
1.4.1 Dark fermentation……….6
1.4.1.1 E. coli type dark fermentation 1.4.1.2 Clostridium type dark fermentation 1.4.2 Photofermentation………...11
1.4.2.1 A brief history of photofermentative H2 production 1.4.2.2 Nitrogenase composition and catalytic characteristics 1.4.2.3 Energy sources for nitrogenase activity 1.4.2.4 Natural electron donors to nitrogenase 1.4.2.5 Calvin-Benson-Bassham cycle 1.4.3 Biophotolysis-H2 production by algae and cyanobacteria………...18
1.4.4 Improving H2 production through design of experiments………..20
1.4.4.1 General procedures for performing DOE 1.4.4.2 Common softwares for DOE methodology
1.4.2.3 Literature example for application of DOE for improved H2 production
2. Regulation of nitrogenase activity and nitrogen fixation genes by ammounium…………..24
2.1 Nitrogenase switch-off phenomenon induced by ammonium shock……….24
2.2 Transcriptional regulation of nitrogen fixation genes by ammonium………....27
CHAPTER 2: Recent advances of hydrogen production by photosynthetic bacteria………...…..29
OBJECTIVES OF THE PRESENT STUDY………56
RESULTS………...…..58
CHAPTER 3: A Kinetic study of H2 production by a Calvin-Benson-Bassham cycle mutant, PRK (phosphoribulose kinase), of the photosynthetic bacterium Rhodobacter capsulatus………...………..59
CHAPTER 4:Characterization of mutants of Rhodobacter capsulatus having constitutive nitrogenase expression in the presence of ammonium………....90
CHAPTER 5: Biological reformation of ethanol to H2 by Rhodopseudomonas palustris CGA009………...……...112
DISCUSSION……….……….…...138
CONCLUSIONS AND PERSPECTIVES………..……….151
BIBLIOGRAPHY……….………...….157
LISTS OF FIGURES
Figure 1. H2 Metabolic pathways of E. coli and Clostridium………..………..7
Figure 2. Gene organization of Rhodobacter capsulatus cbbI and cbbII operons ……...…….16
Figure 3. Reactions and enzymes of Calvin-Benson-Bassham cycle in autotrophic
bacteria………...…...17 Figure 4. Biophotolysis H2 production by Algae and Cyanobacteria ………..……...….20
Figure 5. A general procedure for application of DOE approach ………...………...…..22 Figure 6. A model for the regulation of nitrogenase activity in Rhodopseudomonas palustris strains.……….………...26 Figure 7. Comparison of nitrogen fixation regulatory models for Rhodobacter capsulatus and that for Klebsiellla pneumonia ………...…...…28
ABBREVIATIONS
CBB: Calvin-Benson-Bassham cycle
PRK: phosphoribulose kinase
Rubisco: ribulose-1,5-bisphosphate carboxylase/oxygenase
NifA: master transcriptional activator for nitrogenase genes
DraT: dinitrogenase reductase ADP-ribosyltransferase
DraG: dinitrogenase-reductase-activating glycohydrolase
AmtB: ammonium transporter
GlnK: signal transduction protein, belongs to PII group
GlnB: signal transduction protein, belongs to PII group
GlnJ: signal transduction protein, belongs to PII group
GlnD: uridylyltransferase/uridylyl removing enzyme
NtrB: sensor kinase
NtrC: nitrogen regulatory protein C
NifA: Transcriptional activator of nif genes
GlnA: glutamine synthetase
PHB: polyhydroxybutyrate
SMP: soluble microbial products
Bchl: bacteriochlorophyll
DOE: design of experiments
Uptake hydrogenase: hydrogenase which is more active in catalyzing H2 oxidation
ANOVA: analysis of variance
N2ase: nitrogenase
R. capsulatus: Rhodobacter capsulatus
Rho. rubrum: Rhodospirillum rubrum
Rps. palustris: Rhodopseudomonas palustris
FOOTNOTES
Note on the text of chapter 1 and chapter 2
For chapter 1, all figures from other people’s work were used with permission. For chapter 2, all contents were adapted from a joint review publication with permission from coauthor (Patrick C. Hallenbeck and Yuan Liu, 2016. Recent advances in hydrogen production by photosynthetic bacteria. Int J Hydrogen Energy, 41:4446-4454). It should be noted that this article was published by Elsevier, and it allows authors to use published material, in whole or part, without written permission or formal copyright transfer.
Note on the text of results and discussion
For chapter 3, all contents were adapted from a joint publication with permission (Yuan Liu and Patrick C. Hallenbeck, 2016. A Kinetic study of H2 production by a
Calvin-Benson-Bassham cycle mutant, PRK (phosphoribulose kinase), of the photosynthetic bacterium Rhodobacter capsulatus. Int J Hydrogen Energy, 2016; 41, 11081-11089). For chapter 5, all contents were adapted from a joint publication with permission (Yuan Liu, Dipankar Ghosh, Patrick C. Hallenbeck. Biological reformation of ethanol to hydrogen by Rhodopseudomonas palustris CGA009. Bioresour. Technol. 2015; 176:189-95). It should be noted that this article was published by Elsevier, and it allows authors to use published material, in whole or part, without written permission or formal copyright transfer.
ACKNOWLEDGEMENTS
I thank my supervisor Prof. Patrick Hallenbeck for helping me develop all required skills and knowledge for a PhD student, to be an independent, serious researcher. I also thank all my family members for their long term spiritual support and my government for their scholarship.
Prof. George Szatmari and Prof. France Daigle are thanked for their advice, patience, and encouragement during my first struggling two years of PhD.
I thank all my lab members, A. E. M. Abdelaziz, K. Paranjape, H. Meltzer, D. Ghosh, G. Leite, M. Abo-hashesh, Z. Choolaei, N. Boukharouba, undergraduate students and new comers for their accompany, helpful discussions and technical supports.
My thesis jury members, Dr. Luke Masson, Dr. George Szatmari and Dr. Richard Villemur are all thanked for spending their precious time to evaluate my thesis and make revisions.
I thank UdeM employees for providing me easily reachable library and gym resources and all kinds of direct and indirect help.
Chapter 1: Research background
Increasing environmental concerns and diminishing fossil fuels are the major driving forces for the development of renewable bio-based fuels. At present, a number of biofuels have drawn a great deal of attention and are under intensive investigation, such as ethanol, butanol, biodiesel, and H2. Here, four major biofuels will be discussed in terms of their
general characteristics, microorganism producers, and current production status. An emphasis will be placed on various H2 production methods.
1. Production of H2 and some other biofuels
1.1 Bioethanol
Bioethanol is an attractive bio-fuel for many reasons. Firstly, from a practical point of view, it is compatible with conventional automobile engines when added to gasoline as a 10 to 22% supplement. For flexible fuel vehicles, ethanol can be used at a much higher proportion, for example, E85 is currently used in the United States and anhydrous or 95% ethanol in Brazil [1]. Secondly, ethanol combustion can be treated as free of net CO2 emissions, since the
substrates used to feed a ethanol producer, eg., yeast, are the result of plant photosynthesis which fixes CO2 [2]. Thirdly, ethanol, as a volatile product, is relatively easy to separate from
the fermentation broth (distillation point, STP, 78.15 ºC), thus the downstream processing cost could be less. Lastly, a variety of substrates for ethanol production, including corn, sugarcane, and lignocellulosic biomass, are readily available. Despite its many advantages, there are a few shortcomings that need to be mentioned. For example, it absorbs water, promoting corrosion in the infrastructure used to hadle it, it has a lower energy content than gasoline, and
its presence could encourage microbial growth in fuel (http://www.frost.co.uk/protect-your-vehicle-against-ethanol).
The most well-known ethanol producer is yeast, in particular Saccharomyces cerevisiae which has a long history of being used in the wine industry. It can produce ethanol at high yield, as high as 90 percent of theoretical yield has been reported [3]. It is relatively insensitive to changes in pH, temperature and osmotic conditions. However, very high concentrations of ethanol can be toxic [3]. One major issue with this species is that it lacks enzyme systems for the degradation of pentose sugars, thus it cannot use the hemicellulose fraction of lignocellulose biomass as substrate. Another important yeast species is Pichia stipitis, which is superior to S. cerevisiae in that it can ferment nearly all of the major sugars, including xylose, found in wood [4]. This is an important characteristic since xylose exists in such a high abundance, making up to 15 to 25% of all hard woods and agricultural residues [5]. Genetic approaches are expected to play a future role in integrating all good features from different microorganisms into a super microorganism that can produce biofuel from lignocellulosic substrates [6].
Currently, bioethanol has already been commercialized and produced in large quantity. However, greater production is expected by both the government and the market. According to RFA (the Renewable Fuel Association), the number of ethanol plants increased from 50 to 198 from 2000 to 2011, a remarkable 4-fold increase [2].
1.2 Biobutanol
Compared to ethanol, butanol is a superior fuel in a number of ways. It has a lower volatility and hydrophilicity, higher miscibility with other hydrocarbons, and higher energy content per mass unit, 36 MJ/kg versus 23.4-26.8 MJ/kg for ethanol. There are a few negative aspects for butanol, for example, it stinks. As well, it could be oxidized to the more toxic and odorous butyraldehyde and butyric acid during transportation (http://cen.acs.org/articles/84/i46/Biobutanol-Stinks.html).
Clostridia are the most widely used microorganisms for butanol (1-butanol or n-butanol) production, which catalyze a traditional ABE (acetone, butanol and ethanol) process. An interesting fact is that bio-butanol was commercialized as early as 1918, and successfully served the market for nearly 40 years before it eventually was replaced by a more cost-competitive petrochemical method [7]. Currently, final concentrations of butanol produced by ABE fermentations are low, ranging from a few grams per liter to about 20 grams per liter [7]. It is expected that bio-butanol can be blended into gasoline and act as bio-fuel in the near future (http://www.grandviewresearch.com/industry-analysis/bio-butanol-industry).
1.3 Biodiesel
Biodiesel has a few characteristics of special interest, in particular it has a much better lubricating and higher cetane rating than today’s lower sulfur diesel fuels. Its calorific value is about 37.27 MJ/L which is 9% lower than regular petrodiesel
(www.berkeleybiodiesel.org/useful-guide-understand.html). However, in many cases,
impurities and water during washing and refining processes, and biodiesel can gel in colder weather (http://greenthefuture.com/BIODIESEL_PROSCONS.html). It is generally produced in a transesterification process in which oil or fat are reacted with methanol under acidic conditions. There are a variety of sources for oil or fat including extracts from plants, animals, or algae. Technologies for producing biodiesel from vegetable oils are well developed. However, vegetable oil is not the best option as culturing plants takes a long time. In addition, since their cultivation largely requires arable land, the large scale production of oil-bearing plants might threaten food security given the already large, and still increasing, global population. Hence, lipid production by microalgae may be a better solution as these organisms have faster growth rates (doubling time about 24 hours) and their nutrient requirements can be met with wastewater only [8]. In order to estimate the potential of microalgae-based biodiesel production in the most accurate way, a model has been developed which takes into account nutrient uptake, respiration, temperature and other effects to predict growth and lipid production parameters [9]. This model suggests that maximum annual average lipid yields could reach 24 to 27 m3 ha-1.y-1 in some countries close to the equator, such as Australia,
Brazil, and India, with, obviously, sometimes appreciably lower yields in other countries with different geographical locations [9]. Other estimates were based mainly on laboratory scale data which probably have overestimated the potential use of microalgae for fuel production [10-12].
Currently, biodiesel has already been brought to the market. For example, in the US, the production of biodiesel was 116 million gallons in May 2015 (www. eia.gov/biofuels/biodiesel/production/).
1.4 Biohydrogen
H2 has many advantages as an energy carrier, including its high gravimetric energy density,
clean combustion waste (H2O), and high conversion efficiency in fuel cell systems. It
also have a few disadvantages, for example, it is hard to transport in a reasonable fashion and it is highly flammable (
http://www.conserve-energy-future.com/Advantages_Disadvantages_HydrogenEnergy.php). There are three major types of
biological H2 production and each of them will be discussed below. I will put special
emphasis on photofermentative H2 production since this is one of the subjects of this thesis.
Currently, hydrogen produced biologically is in preliminary research stage.
1.4.1 Dark fermentation.
There are two well-known H2 producers for dark fermentation, Escherchia coli and
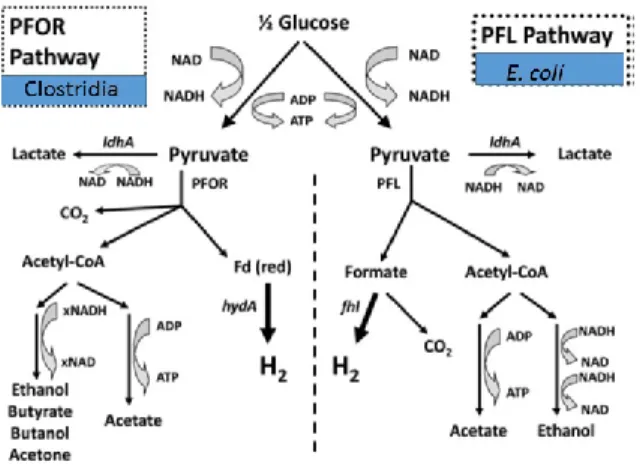
Clostridium. Both use glycolysis to break down glucose to pyruvate and ATP with the concomitant reduction of NAD to NADH. The oxidization of NADH will lead to several other products depending on the pH conditions and the organism. These final byproducts can include butanol, butyrate, ethanol and acetone. One of the distinguishing factors between the two metabolic types is the breakdown of pyruvate leading eventually to the production of hydrogen. Facultative anaerobes (E. coli) will metabolize pyruvate to acetyl-CoA and formate by pyruvate formate lyase. Formate can then be used to produce hydrogen by a [NiFe] hydrogenase activity. Strict anaerobes (Clostridium) use pyruvate: ferredoxin oxidoreductase to break down pyruvate into acetyl-CoA, CO2, and reduced ferredoxin. Hydrogen is then
the theoretical maximum H2 yield through this metabolic pathway (pyruvate to H2) is 2 mol
H2/mol glucose. However, many strict anaerobes have additional enzyme systems capable of
generating hydrogen directly from NADH, such as the newly described bifurcating hydrogenases [13]. Metabolic pathways for H2 production are shown in Fig. 1 (Clostridia-left,
E. coli-right).
Figure 1. H2 Metabolic pathways of E. coli (right) and Clostridium (left). PFOR: pyruvate ferredoxin oxidoreductase. PFL: pyruvate formate lyase (adapted from Hallenbeck and Ghosh, 2012, with permission [13]).
1.4.1.1 E. coli type dark fermentation
E. coli catalyzes mixed acid fermentation under anaerobic conditions, thus the H2 yield is
usually low. Naturally, H2 is produced by the activity of formate hydrogenlyase (FHL).
Several attempts have been made in order to increase the yield of hydrogen in E. coli. One modification that has been done is to inactivate hyd1 and hyd2 encoding hydrogenases which are more active in catalyzing H2 oxidation. This double mutation resulted in a 37% increase in
net H2 production [14]. Another potential mutation site is ldhA which encodes lactate
dehydrogenase, since it could cause an undesirable drain in the pyruvate pool. Inactivation of this gene led to an increase of 20-40% in net H2 production [14-17]. However, these effects
will be manifested only under acidic conditions when ldhA is expressed at high levels. Fumarate reductase (frdBC) also could give a similar effect as lactate dehydrogenase. With the inactivation of this gene, the hydrogen yield was moderately increased by 10-15% [18-20]. H2
production from a synthetic pathway has also been proposed and demonstrated [21, 22]. In theory, 2 additional moles H2 per mole of glucose could be obtained from the oxidation of
NADH generated from the glyceraldehyde-3-phosphate node of glycolysis. In practice, three proteins, NAD(P)H:ferredoxin oxidoreductase, ferredoxin, and hydrogenase were expressed in a wild type strain E. coli BL21 (DE3) which doesn’t produce H2 at detectable levels, and
interestingly, small amounts of H2 were produced with a yield of 5.2 mmol H2/mol glucose. In
a similar study where the Ralstonia eutropha SH hydrogenase (NAD-reducing [NiFe] hydrogenase), which can use NADH as direct substrate, was introduced into E. coli FTD147, the hydrogen yield reached 2.11 mol H2/mol glucose, exceeding the theoretical maximum by
glucose, were observed when an additional endogenous gene, ydbK (encoding pyruvate-ferredoxin oxidoreductase), was co-expressed with hydrogenase and pyruvate-ferredoxin genes [24].
1.4.1.2 Clostridium type dark fermentation
The Clostridia are strict anaerobes and can effectively metabolize a variety of substrates, including, cellulose, organic wastes, glycerol and many others [25]. They are fast growers and produce hydrogen in a growth-linked manner, thus their hydrogen productivity is high. However, like E. coli, one major problem with Clostridum type hydrogen production is that the H2 yield is usually low due to the production of several other metabolites. Metabolic
pathways and approaches toward high level H2 production are discussed in the following
sections.
1.4.1.2.1 Pathways involved in H2 production
In Clostridia, as in many other organisms, sugars are degraded using the classical glycolytic pathway, in which two net NADH are produced through glucose degradation to pyruvate. Under low H2 partial pressures, oxidation of these two NADH could be coupled to
proton reduction to make two H2. So far the exact mechanism of this process is not completely
understood [26, 27]. Pyruvate is then converted to Acetyl-CoA by pyruvate:ferredoxin oxidoreductase with the production of a reduced ferredoxin (Fd (red)). The reduced form of ferredoxin then donates electrons to a [FeFe] hydrogenase to make another two H2 (see Fig. 1).
Thus, in theory, four mol of H2 can be produced from 1 mol of glucose using the existing
theoretical maximum (12 mol H2/mol glucose). Thus, it would be desirable to introduce new
metabolic pathways with the aid of synthetic biology to obtain stoichiometric conversion.
1.4.1.2.2 Metabolic engineering strategies for improving H2 production
Klein et al., attempted to overexpress two different types of hydrogenases in Clostridium acetobutylicum DSM 792 for improving H2 production [28]; however, the hydrogen yields
and volumetric productivities of the recombinant strains were similar to the wild type. This suggests that overexpression of an enzyme would only have an effect when it catalyzes a rate limiting step. Another study, which used the same approach with a different strain, C. tyrobutyricum JM1, resulted in a significant improvement, 1.5-fold [29]. This indicates that, depending on the organisms and their unique metabolic pathways, overexpression of a key enzyme might bring fruitful results. Even so, thus far neither the yield nor the volumetric productivity are anywhere near the levels required for a practical system.
1.4.2.2.3 Elimination of competing pathways
As shown in Fig. 1, several products such as ethanol, lactate and butyrate are co-produced with H2. Thus, inactivation of those pathways which lead to production of undesirable
products could in theory improve H2 production. Some examples of such a practice have
already been published. In one study, the aad gene (encoding aldehyde-alcohol dehydrogenase) of C. butyricum was disrupted, however, the results showed that the hydrogen production of the mutated strain was equivalent to that of the wild type [30]. There are at least two explanations for this result. For example, ethanol was not a major metabolite under the
culture conditions used, or other existing pathways were more favorable. In another study, the ldhA gene (encoding lactate dehydrogenase) of C. perfringens W11 was disrupted, which resulted in a 44% improvement in hydrogen yield [31]. A third report, which studied the effects of the inactivation of the atoB (encoding acetyl-CoA acetyltranferase, the first enzyme in the butyrate formation pathway) on H2 production showed decreased hydrogen yields with
a corresponding increase in ethanol production [32]. Thus, it seems that inactivation of supposedly competing pathways does not always work in the expected way.
1.4.2 Photofermentation
1.4.2.1 A brief history of photofermentative hydrogen production
In 1949, Gest and Kamen observed vigorous hydrogen production when they grew Rhodospirillum rubrum (Rho. rubrum) photosynthetically with certain oxidized substrates as carbon source and glutamate or aspartate as a nitrogen source [33, 34]. Through careful comparison of conditions that repressed H2 production to those that derepressed H2 production,
they were able to find evidence for the existence of a functioning nitrogenase system in Rho. rubrum [35]. However, the technique for purification of the nitrogenase complex wasn’t developed until 1966 when Bulen and LeComte successfully purified nitrogenase from Azotobacter [36]. In 1978, the isolation and purification of nitrogenase from the photosynthetic bacterium Rho. rubrum in an active form was separately done by two groups [37, 38], after which it became possible to study the general characteristics of nitrogenase in vitro.
1.4.2.2 Nitrogenase composition and catalytic characteristics
Nitrogenase consists of two proteins, MoFe protein (also called dinitrogenase), a molybdenum and iron-containing protein, and Fe protein (also called dinitrogenase reductase), an iron-containing protein. Neither of these two proteins show nitrogenase activity separately. Both proteins function as a system in such a way that at the first step, the Fe protein receives electrons from a low redox potential electron donor, such as ferredoxin or flavodoxin, then electrons are passed to the MoFe protein where electrons are used to reduce N2. When N2 is
not available, nitrogenase can reduce protons to produce H2. This is why photofermentative
hydrogen production has been performed under argon or helium atmospheres. The main physiological reaction catalyzed by nitrogenase can be represented by equation 1:
Besides N2 and H+, a number of other substances serve as substrates of nitrogenase, such as
HCN, N2O and C2H2 [39]. The reduction of acetylene to ethylene, discovered by Dilworth in
1966, forms the basis of a highly sensitive assay for nitrogenase [40]. The reaction catalyzed by nitrogenase is ATP dependent, thus it is irreversible. It was found that nitrogenase keeps catalyzing H2 production even under 100% H2 [34]. More surprisingly, nitrogenase can still
produce H2 at barometric pressures of up to 50 atm [41]. However, nitrogenase is slow with a
turnover number (also called Kcat) of 6.4 s-1 [42]. A typical TCA cycle enzyme, such as
fumarase, has a turnover number of 800-900 s-1. Thus the catalytic efficiency of nitrogenase is
about a hundred-fold lower [43]. In order to couple with other biological processes, it is not uncommon to observe cells synthesizing large quantities of nitrogenase. Both components of
nitrogenase are highly O2 labile, especially the Fe-protein, with a half-life about 30 seconds
when exposed to atmospheric O2 [44].
1.4.2.3 Energy sources for nitrogenase activity
In photosynthetic bacteria, ATP can be generated in at least three ways, photophosphorylation, substrate level phosphorylation and oxidative phosphorylation. Of these, photophosphorylation is the most efficient, as it was reported that the rate of photophosphorylation at 5000 lux illumination was about 10-fold higher than oxidative phosphorylation with H2 as substrate [45] Under microaerobic conditions, for example, O2
represents 0.5% percent of the gas phase, trace amounts of O2 were found to support
nitrogenase activity by providing energy [46]. It should be noted that the O2 percentages of
permissive microaerobic conditions are species-dependent. It has been demonstrated by Madigan et al. that Rhodobacter capsulatus can grow and fix N2 under dark anaerobic
conditions with fructose as a fermentable substrate. Thus it can be inferred that the ATP supply for nitrogenase can be met by substrate level phosphorylation [47].
1.4.2.4 Natural electron donors to nitrogenase
Although it is generally accepted that organic substrates serve as the ultimate electron donor to nitrogenase for the photoheterotrophically grown purple non-sulfur photosynthetic bacteria, the entire electron transport pathway from organic substrates to nitrogenase has not been completely explored. One of the biggest difficulties is that the reduction of low redox potential ferredoxin by illuminated chromatophores (analogous to plant chloroplasts) of
non-sulfur purple bacteria has never been achieved, whereas ferredoxin can be reduced by the illuminated chloroplasts of plants. This raises the question of how the direct electron donor to nitrogenase is reduced. One hypothesis proposed many years ago is that generation of reductant by Rho. rubrum (one of the best known purple non-sulfur phtotosynthetic bacteria) during photosynthesis may occur by reverse electron flow powered by ATP hydrolysis to NAD rather than to ferredoxin [48], then the NAD/NADH pool would form an equilibrium with the ferredoxin (red)/ferredoxin (oxd) pool to supply electrons to nitrogenase. Until now, this theory still serves as the basis for an understanding of photofermentative H2 production
by the nitrogenase system. Despite the ambiguity of the entire electron transport chain towards nitrogenase, ferredoxin in its reduced form, a small molecular weight protein, has been assumed to be the direct electron donor to nitrogenase. The reaction center can be 4Fe-4S, 2Fe-2S or other combinations, depending on the types of ferredoxin [49]. In R. capsulatus, Ferredoxin I (FdI) encoded by fdxN is believed to be the natural electron donor to nitrogenase [50]. This is primarily based on the following discoveries: (I) the fdxN gene is located upstream of nif gene clusters and its synthesis is under the control of the nif regulatory gene nifR1 [51], (II) In vitro nitrogenase assays showed that FdI is an efficient electron donor to nitrogenase [52]. In Rho. rubrum it was once believed that FdI (encoded by fdxN) was the primary electron donor to nitrogenase, since (I) during diazotrophic growth condtions, the fdxN gene was found to be up regulated two-fold; (II) In vitro nitrogenase assays showed FdI is about three times more efficient than FdII [53]. However, a recent study suggests FdN, instead of FdI, is the primary electron donor to nitrogenase [54].
Another electron donor of the intermediate electron transport chain that has been identified so far is the Rnf complex, a putative membrane bound complex. Physiological growth studies
have shown that the Rnf complex was necessary for nitrogenase activity under photoheterotrophic conditions since insertion and deletion mutants lost the ability to grow diazotrophically [55]. Another piece of evidence is from a study of the effect of overexpression of rnf on nitrogenase activity. The results of this study showed that in vivo nitrogenase activity was significantly improved. [56].
1.4.2.5 Calvin-Benson-Bassham cycle- A major competitor of nitrogenase
Under photofermentative conditions, the excess reductants generated from the central metabolism are consumed by Calvin-Benson-Bassham cycle (Calvin cycle), PHB synthesis, and nitrogenase system in order to maintain redox balance. Several studies have shown that the Calvin cycle is the preferred pathway to serve this purpose [57, 58]. Thus, elimination of Calvin cycle flux should result in improved H2 production catalyzed by nitrogenase. In R.
capsulatus, genes encoding Calvin cycle enzymes are located in two operons [59], namely cbbI and cbbII, shown in Figure 2.
Figure 2. Gene organization of Rhodobacter capsulatus cbbI and cbbII operons. The cbbI
operon contains cbbL and cbbS, encoding the large and small subunits, respectively of form I RubisCO. It is not established if cbbQ and cbbO are definitely part of the same operon and their functions are unknown. cbbRI is located upstream and is transcribed from the oposite
direction to cbbLS. The cbbII operon contains cbbM, which encodes form II RubisCO
(encoded by cbbM), and other cbb structural genes. The cbbRII is located upstream and
divergently transcribed from cbbII operon. Arrows indicate the direction of transcription. Gene
designations are as follows: cbbF, fructose-1,6-bisphosphate/sedoheptulose-1,7-bisphosphatase (FBP); cbbP, phosphoribulokinase (PRK); cbbT, transketolase (TKL); cbbG, glyceraldehye-3-phosphate dehydrogenase (GAP); cbbA, fructose-1,6-bisphosphate/sedoheptulose 1,7-bisphosphate aldolase (FBA);cbbE, ribulose-5-phosphate-3-epimerase (EPI); cbbZ, phosphoglycolate phosphatase; cbbY, ORF1, ORF2 and ORF3 encode genes of unknown function (adapted from Vichivanives et al., with permission [59]) .
The complete Calvin-Benson-Bassham cycle pathways are shown in Figure 3. The metabolites and enzymes are annotated in the figure legend [60]. It should be noted here that this figure is generalized from many autotrophic bacteria, thus it also fits Rhodobacter capsulatus.
Figure 3. Reactions and enzymes of Calvin-Benson-Bassham cycle in autotrophic bacteria. Abbreviations for metabolites: 3-PGA, 3-phosphoglycerate; BPG, 1,3-bisphosphoglycerate; GA-3-P, glyceraldehyde-3-phosphate; DHAP, dihydroxy-acetone-phosphate; F-1,6-BP, fructose-1,6-bisdihydroxy-acetone-phosphate; F-6-P, fructose-6-dihydroxy-acetone-phosphate; E-4-P, erythrose-4-phosphate; Su-1,7-BP, sedoheptulose-1,7-bisphosphate; Su-7-P, sedoheptulose-7-phosphate; R-5-P, ribose-5-sedoheptulose-7-phosphate; Xu-5-P, xylulose-5-sedoheptulose-7-phosphate; Ru-5-P, ribulose-5-phosphate; Ru-1,5-BP, ribulose-1,5-bisphosphate. Abbreviations for enzymes: FBA, frucose-1,6-bisphosphate aldolase, FBP, frutose-frucose-1,6-bisphosphate, GAP, glyceraldehyde-3-phosphate dehydrogenase, PGK, 3-phosphoglycerate kinase, PGP, phosphglycolate phosphatase, PPE, pentose-5-phosphate 3-epimerase, PPI, pentose-5-phosphate isomerase, PRK, phosphoribulokinase, RubisCO, ribulose-1,5-bisphosphate carboxylase/oxygenase, SBP, sedoheptulose-1,7-bisphosphatase, TKT, transketolase, TPI, triosephosphate isomerase (adapted from Kusian and Bowien, with permission [60] ).
Metabolic engineering approaches as well as other means for improved photofermentative H2 production will be discussed in more detail in Chapter 2.
1.4.3 Biophotolysis-hydrogen production by algae and cyanobacteria
Biophotolysis is the photosynthetically driven splitting of water to produce hydrogen and oxygen. Hydrogen production by biophotolysis with algae or cyanobacteria is inherently appealing since the major nutrient requirement for these two species are water and solar energy, which exist in abundance. However, earlier studies (before 2000) of this process showed that H2 can’t be produced in a sustained manner and that the small amounts of H2
produced were soon consumed by the activity of uptake hydrogenase. Thus, H2 can only be
monitored by fast techniques such as that provided by membrane-inlet mass spectrometers. The main reason for the short-lived H2 production is that the hydrogenase of algae and
cyanobacteria which catalyzes proton reduction, is sensitive to O2, an obligate product of the
activity of photosystem II (PSII) [61, 62]. Some O2 absorbers have been used in attempts to
overcome this problem, but obviously such a method won’t be economically feasible in a practical large scale H2 production process [62].
In order to solve this problem, two stage systems have been developed. One such system that has been extensively researched is the use of sulfur deprivation to achieve sustained H2
production. In this approach, the first stage is a biomass accumulation process, and for the second stage the culture is transferred to a S-depleted medium. Without sulfur, protein can’t be synthesized and cells go into a resting stage. Continued photosynthesis without the possibility for repair causes depletion of the D1 protein, which is essential for photosystem II
activity, thus the residual photosynthetic activity becomes very low, dropping below the respiratory oxygen uptake compensation point. Consequently, the intracellular environment becomes anaerobic, allowing for sustained H2 production. In this way, H2 production can be
sustained for several days. However, the H2 production rate is very low, about 2 ml/g cell/h, a
value about 5-10% of what has been achieved by photosynthetic bacteria [63]. As mentioned above, hydrogenase is very sensitive to O2, thus protein engineering to make hydrogenase
insensitive to O2 could be a fundamental solution for bio-photolysis based H2 production.
Indeed, some efforts have already been put towards this goal [64-66]. In one study, a mutant strain which can tolerate 8-fold higher amounts of O2 has been constructed by mutation of
amino acids that form a gas channel [64]. Although O2 tolerance of the mutant is still low, the
results are nevertheless encouraging since further modification could in theory lead to even higher levels of oxygen tolerance. The H2 production pathway of algae and cyanobacteria is
Figure 4. Biophotolysis H2 production by Algae and Cyanobacteria. The sunlight is captured by the photosynthetic apparatus, then the recovered energy is used to couple water splitting to generate a low potential reductant (ferredoxin), which can be used to reduce a hydrogenase enzyme (adapted from Hallenbeck and Benemann, 2002, with permission [42] ).
1.4.4 Improving biofuel production through experimental design
Design of experiments (DOE) methodology includes many subtopics and has been effectively applied to many subjects including life sciences. Examples can be readily found in many reports [67]. In the biological sciences, factorial design coupled with response surface methodology appears to be the most commonly used strategy. The principle of DOE can be found in many textbooks,thus it will not be discussed here.
1.4.4.1 General procedures for performing DOE
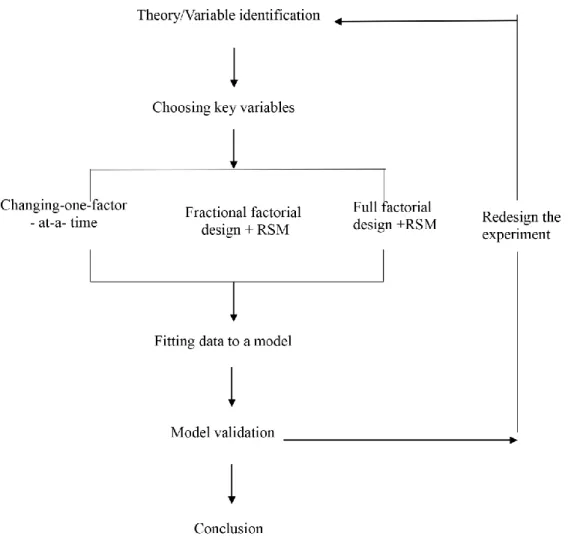
Here, a general procedure for applying DOE methodology for H2 production is given based
on my own experience as well as what can been found in the literature (see Fig. 6). The first step of this process is to define the experimental variables and desired responses. Next, a particular design should be selected. Factorial designs are ideal as they are orthogonal and balanced. For a first order design, e.g., 5 variables with each having 2 levels, fractional factorial design is a good choice since it has the advantage of requiring fewer experiments. For a second order design, Box-Behnken design and center composite design are the most commonly used. For 3 variables with 3 levels, Box-Behnken design contains fewer experiments than a center composite design, but for more variables the latter one is preferable. It should be noted that experimental runs should be performed in a randomized manner no matter what type of design is being used. After completion of the experiments, data is fit to a quadratic model with the following formula:
𝑦 = ∑ 𝑎𝑖𝑋𝑖 𝑁 𝑖=1 + ∑ 𝑏𝑖𝑋𝑖2+ ∑ 𝑐𝑖𝑗𝑋𝑖𝑋𝑗 𝑁 𝑖<𝑗 𝑁 𝑖=1
(y: response; xi, xj: variables; ai, bi, cij: coefficients)
Regression analysis and analysis of variance are the general statistical tools used for validation of the design. In some cases, the validation yields a conclusion that the design variables have no significant effects on the response. In this case, one should consider redesigning the experiment through approaches like changing the step size in the design variables, as shown in Fig. 5.
Figure 5. A general procedure for application of DOE approach.
1.4.4.2 Common software for DOE methodology
Typically, general purpose statistical software like Minitab®, or purpose designed and
few steps are required to choose the design and generate a corresponding experimental run table. Online tutorials are available:
(
http://www.minitab.com/uploadedFiles/Documents/gettingstarted/Minitab17_GettingStarted-en.pdf).
When experiments are completed, the data (response values) are input and a regression analysis function or ANOVAR is used to do statistical analysis for a validation of the model.
1.4.4.3 An example of the use of DOE methodology for improved H2 production
The application of DOE methodology for H2 production has been recently reviewed [67],
thus only two important examples are given here for illustrating purposes. In one study, the Box-Behnken design was used to optimize three variables, glycerol concentration, glutamate concentration and light intensity. The result of this study showed near stoichiometric conversion of glycerol to hydrogen had been achieved - 96% of the theoretical maximum. This corresponds to a 20% percent improvement compared to a previous batch study which only achieved 75% of theoretical maximum [68, 69]. Another study which applied the same strategy achieved a H2 yield of 1.69 mol/mol glucose with genetically engineered Escherichia
coli [70]. This suggests that a DOE approach is effective for optimization purposes, and certainly deserves consideration.
Other means for improving photofermentative H2 production are further discussed in
2. Regulation of nitrogenase
2.1 Nitrogenase switch-off phenomenon and mechanism induced by ammonium shock
Nitrogenase switch-off is a phenomenon that has been observed when some diazotrophs, grown under nitrogen fixation conditions, are suddenly exposed to environmental stimuli, such as darkness, O2, or a fixed nitrogen source (ammonia, glutamine, etc.). These stimuli
cause nitrogenase activity to cease after a few minutes (or longer), with recovery of nitrogenase activity once the environmental stimulus is removed or metabolized [71]. The study of switch-off effects caused by ammonia is of interest to many research groups.
Rho. rubrum is the best understood phototroph in terms of ammonia switch-off effects and the molecular mechanism behind it has been explored in substantial depth. It was found that the Fe-protein subunit of nitrogenase was covalently modified by an ADP-ribose moiety at arginine-101 when nitrogen starved cells were suddenly exposed to ammonia [72-76]. The enzyme which catalyzes this covalent modification was purified, characterized and named dinitrogenase reductase ADP-ribosyltransferase (DraT) [77]. The modified Fe-protein can no longer transfer electrons to MoFe-protein, thus nitrogenase activity was switched off [78, 79]. However, once the added ammonia was metabolized, the inactivated Fe-protein can be converted back to its active form by the activity of dinitrogenase reductase activating glycohydrolase (DraG) [80]. Sequencing data has shown draT/G genes are contiguous on the Rho. rubrum chromosome and highly linked to nifHDK genes (structural genes of nitrogenase) [81]. Studies have also shown that draT and draG are cotranscripted in Rho. rubrum since a polar mutation in draT resulted in undetectable in vivo activity of DraG [82].
DraT and DraG are also subject to regulation, a process believed to be linked to PII proteins, which act as sensors of cellular nitrogen, carbon and energy levels and control the activities of a wide range of target proteins by protein-protein interactions. It was found that mutants of Rho. rubrum which lack AmtB1 are defective in response to ammonia shock, most probably due to membrane sequestration of DraG in a process dependent upon the involvement of GlnJ and AmtB1 [83, 84]. Another pivotal player in this regulatory process is GlnD, which is a bifunctional uridylyltransferase/uridylyl-removing enzyme. It is thought to be the primary sensor of nitrogen status in the cell and reversibly modifies PII proteins (such as GlnK and GlnB), which in turn regulate a variety of other proteins [85].
R. capsulatus is also one of the most intensively studied diazotrophs for ammonium induced nitrogenase switch-off. AmtB was also found to be necessary for the ammonia induced nitrogenase switch-off and ADP-ribosylation of the Fe-protein [86]. However, there are at least two distinct differences between Rho. rubrum and R. capsulatus in terms of the molecular mechanism of ammonium induced switch-off effects: (1) a mutant of R. capsulatus which has a mutated glnB homologue was found to be capable of Fe protein modification, indicating that GlnB is not absolutely required for the ammonia induced covalent modification [87]; (2) a draT/draG double mutant, W107I, showed ammonia induced switch-off effects, suggesting a second alternative mechanism exists in R. capsulatus [88, 89].
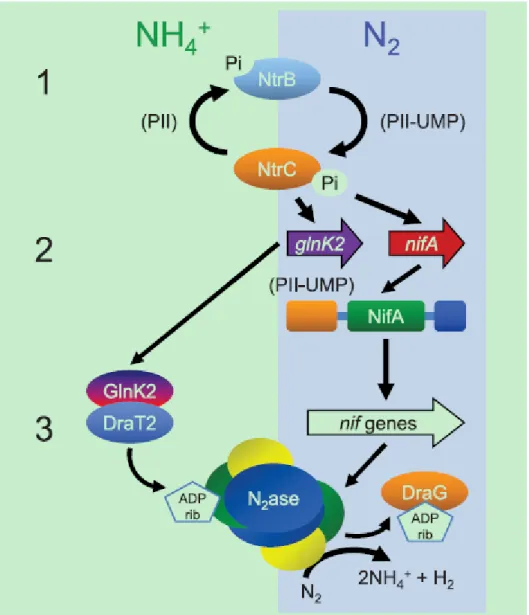
Another well studied diazotroph for nitrogenase switch-off is Rhodopseudomonas palustris. Here is an example to illustrate a general signal transduction pathway from ammonium shock [90], Fig. 6. Although many pivotal players involved in ammounim induced switch-off effects have been identified and interactions between some of them partially characterized, the thorough understanding of the phenomenon is far from complete.
Figure 6. A model for the regulation of nitrogenase activity in Rhodopseudomonas palustris strains. When cells are exposed to ammonium, NtrB in combination with a bound nonuridylylated PII protein stimulates dephosphorylation of NtrC, as a result, glnK2 expresses at low levels and DraT2 restores its ability to ADP-ribosylate nitrogenase reductase. The modified nitrogenase loses its activity. NifA: master transcriptional activator for nitrogenase genes; NtrB: sensor kinase; NtrC: nitrogen regulatory protein C; GlnK2 belongs to PII group; DraT: dinitrogenase reductase ADP-ribosyltransferase; DraG: dinitrogenase-reductase-activating glycohydrolase (adapted from Heinger et al., 2011, with permission [90] ).
2.2 Transcriptional regulation of nitrogen fixation genes by ammonium
In Rhodobacter capsulatus, nitrogen fixation related genes are found dispersed in several groups on the chromosome encoding two nitrogenase systems, which are composed of at least 53 structural and regulatory genes [91, 92]. A number of environmental factors were found to influence nitrogen fixation gene expression, including O2, availability of fixed nitrogen source
and light intensity [93, 94]. Thus, it can be seen that the regulation of nitrogen fixation is extraordinarily complicated. Therefore, in this section, only regulation of nitrogen fixation genes by ammonium will be discussed. The papers reviewed here are those studies in which standard RCV medium was used to ensure that only nif nitrogenase will be expressed.
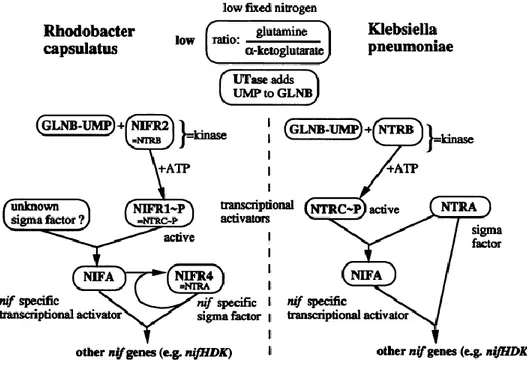
The available data for deducing the nitrogen fixation regulatory cascade include DNA sequence of those genes, their promoters and in vitro protein-protein interactions [95-102]. Transcriptional regulation happens at two levels. At the first level, under nitrogen limited conditions, NifR2 phosphorylates NifR1, then NifR1-P works with RpoN to activate NifA. The NifA activity is in turn regulated by GlnB and GlnK. At the second level, NifA works with NifR4 to activate nif structural genes-nifHDK expression [103-105]. The regulatory cascade is shown in Fig. 7.
Figure 7. Comparison of nitrogen fixation regulatory models for Rhodobacter capsulatus and that for Klebsiellla pneumonia. UTase: uridyltransferase (adapted from Hubner et al., 1991, with permission [105] ).
Chapter 2: Recent Advances in Hydrogen Production by Photosynthetic Bacteria Patrick C. Hallenbeck1,2 and Yuan Liu2
1 Life Sciences Research Center, Department of Biology
United States Air Force Academy
2355 Faculty Drive, USAF Academy, Colorado 80840
2Department of Microbiology, Infectious Diseases and Immunology
University of Montreal,
CP 6128 Succursale Centre-ville, Montreal, Quebec, Canada H3C 3J7
Author contribution: PCH wrote the outline. YL expanded it. PCH revised and finalized it. PCH and YL made the figures and tables.
Abstract
The photosynthetic bacteria have a very versatile metabolic repertoire and have been known for decades to produce hydrogen during photofermentative growth. Here, recent advances in hydrogen production by these organisms are reviewed and future directions highlighted. Often used as a second stage in two stage hydrogen production processes; first stage fermentative sugar to hydrogen and organic acids; second stage, organic acids to hydrogen, recent studies have highlighted their ability to directly convert sugars to hydrogen. Several studies have attempted to optimize a single stage batch process and these, and a study with continuous cultures have shown that yields approaching 9 mol H2 / mol glucose can be obtained. One of
the drawbacks of this system is the dependency on light, necessitating the use of photobioreactors, thus potentially greatly adding to the cost of such a system. In another approach which avoids the use of light energy, microaerobic fermentation of organic acids to hydrogen, driven by limited oxidative phosphorylation has been demonstrated in principle. Further advances will probably require the use of metabolic engineering and more sophisticated process controls in order to achieve higher stoichiometries, approaches that might be applied to other, light dependent, hydrogen production process by these organisms.
Keywords: Biological hydrogen production, photosynthetic bacteria, photofermentation, energy from wastes, improving rates and yields
1. Introduction
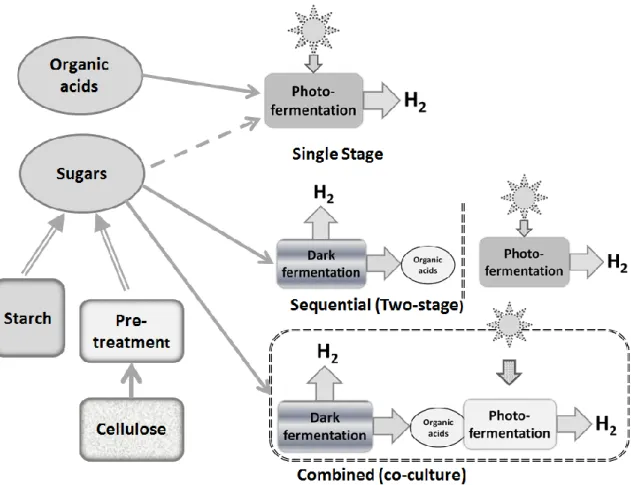
Photosynthetic bacteria have long been studied for their capacity to produce hydrogen from organic acids in a light dependent reaction that is called photofermentation, generating hydrogen from substrates for which this is normally difficult from a thermodynamic point of view [1]. This is possible due to the input of extra energy through bacterial photosynthesis (Figure 1). Although organic acids, available as wastestreams, have traditionally been used as substrate, potentially also allowing for waste treatment credits, a number of novel substrates have recently been shown to be effective, extending the range of these organisms [2]. As discussed below, the nature of this process allows almost stoichiometric conversion of various substrates to hydrogen. Many studies, now numbering in the hundreds, have examined various aspects of hydrogen production by these organisms. However, a number of significant challenges remain, including; low light conversion efficiencies, the high energy demand and low turnover number of nitrogenase, and the potential requirement for expensive hydrogen impermeable photobioreactors. Here the basic mechanisms involved are discussed and some of the recent advances in this field towards higher hydrogen yields are reviewed. These involve integrated approaches, where sugars are degraded using two-stage systems, or attempts to carry out this type of conversion in a single stage. Finally, other approaches for system improvement, including novel physiological approaches or metabolic engineering, are presented.
2. Basic Mechanisms
Hydrogen is evolved by the enzyme nitrogenase which, normally active in N2 reduction,
will reduce protons to hydrogen in its absence [3]. This reaction is ATP dependent and therefore energetically demanding. Normally, this requirement can be met through the action of bacterial photosynthesis, producing ATP through the light driven creation of a proton gradient (Figure 1). This proton gradient is also used to generate, through a process of reverse electron flow, the low potential electrons required for proton reduction. The synthesis of this enzyme is repressed under N-replete conditions [3], so normally substrates must be N-poor, unless special permissive mutants are used [4].
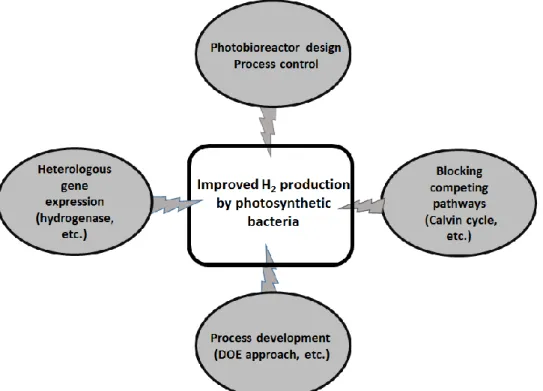
Knowledge of the metabolic pathways involved can be used in attempts, through metabolic engineering, to increase hydrogen yields [5], as discussed further in section 3.4. Basically, it would appear that blocking pathways that divert NADH, CO2 fixation and PHB
(polyhydroxybutyrate) synthesis, should render more reductant available for nitrogenase and its reduction of protons to hydrogen.
3. Different approaches toward improving H2 production by photosynthetic bacteria 3.1 Photofermentations
As already eluded to, the majority of studies on H2 production by photosynthetic bacteria
have involved the use of organic acids, lactate, acetate, and succinate, as substrates [6-9]. As noted, except with special mutant strains, these reactions take place only in the absence of ammonium. While the metabolic advantage to the cell is not immediately apparent, and in fact might even seem paradoxical given the energetically demanding fixation of carbon
dioxide in the presence of an easily assimilated fixed carbon source, a variety of evidence suggests that proton reduction to hydrogen under these conditions is necessary to maintain the cellular redox poise [10]. Recent results suggest that an additional factor restricting yields is the formation of SMPs (soluble microbial products), and that this can be overcome through the addition of a small amount of ethanol, an effect that is not fully understood at present [11]. Reduction in SMP production would most likely aid in increasing hydrogen production, as this study showed, but metabolic intervention to bring this about is not obvious since SMPs produced by various types of fermentation appear to be a complex mixture of proteins, amino acids, nucleic acids, organic acids, products of energy metabolism, and cellular structural components [12].
3.2 Single and Two-stage Systems
A variety of systems have been investigated where photosynthetic bacteria are used in conjunction with fermentative bacteria in attempts to drive the nearly complete conversion of sugars to hydrogen. In principle, 12 moles of H2 can be derived from one mole of glucose
(equation (1)).
(1) C6H12O6 + 6H2O → 6CO2 + 12H2
However, dark fermentation alone can produce at most only 4 moles of H2, a yield of only
33%, while at the same time producing, as side products, organic acids such as acetate and lactate. Of course, many of these substrates are in fact the products of other microbial fermentations, suggesting that photofermentative hydrogen production could be used to produce additional hydrogen after, or alongside, a dark hydrogen fermentation [1, 2, 13].
Photosynthetic bacteria can be used to convert these organic acids to additional hydrogen, either in a single combined process, or in a two stage process (figure 2). Although elegant in principle, in practice these systems are difficult to operate and optimize. In combined systems, the very different culture requirements of the two different organisms are problematic, and in two stage systems, the effluent from the dark fermentation stage in fact requires substantial treatment and handling, both costly in inefficient processes, to bring it to a state where it is in fact a suitable, non-inhibitory substrate for the photosynthetic bacteria.
Initially, dark fermentation and photofermentation were coupled as a two sequential stages towards the complete extraction of available electrons for H2 production, which should
theoretically give 12 moles of H2 per mole of glucose (equation (1)). For example, in one
study, a hyperthermophile, Caldicellulosiruptor saccharolyticus, was used to ferment molasses in a dark stage, followed by the use of several different photosynthetic bacteria for hydrogen production in a light driven process using organic acids generated from the previous stage [14] (Table 1). This approach essentially is of low efficiency considering the high energy input and possible complex design of a bioreactor which is suitable for the two very different processes. Essentially similar results were seen with the use of integrated systems to convert potato starch to hydrogen where combined yields near 5.6 mol H2 per mol of glucose
were noted [15, 16], or with a system consisting of Clostridium butyricum and Rhodopseudomonas palustris converting sucrose to hydrogen [17]. Finally, a two stage system has been proposed for the conversion of glycerol, available as a biodiesel production waste, to hydrogen, but molar yields were quite low (Table 1) [18]. In fact, it would appear that a simple one-stage process can be quite effective, giving essentially stoichiometric conversion of glycerol to hydrogen (see below and Table 1). Recently, significant