Rosetta Multi-Instrument Study
E. Gr¨
un,
1,2?J. Agarwal,
3N. Altobelli,
4K. Altwegg,
5M. S. Bentley,
6N. Biver,
7V.
Della Corte,
8N. Edberg,
9P. D. Feldman,
10M. Galand,
21B. Geiger,
4C. G¨
otz,
36B. Grieger,
4C. G¨
uttler,
3P. Henri,
11M. Hofstadter,
12M. Horanyi,
2E. Jehin,
13H.
Kr¨
uger,
3S. Lee,
12T. Mannel,
6E. Morales,
46O. Mousis,
32M. M¨
uller,
14C. Opitom,
13A. Rotundi,
8,15R. Schmied,
6,16F. Schmidt,
17H. Sierks,
3C. Snodgrass,
18R. H.
Soja,
17M. Sommer,
17R. Srama,
17C.-Y. Tzou,
5J.-B. Vincent,
3P.
Yanamandra-Fisher,
19M. F. A’Hearn,
22A. I. Erikson,
9C. Barbieri,
23M. A. Barucci,
7J.-L.
Bertaux,
24I. Bertini,
25J. Burch,
47L. Colangeli,
20G. Cremonese,
26V. Da Deppo,
27B. Davidsson,
28S. Debei,
29M. De Cecco,
30J. Deller,
3L. M. Feaga,
22M. Ferrari,
8S. Fornasier,
7M. Fulle,
30A. Gicquel,
3M. Gillon,
13S. F. Green,
18O. Groussin,
32P.
J. Guti´
errez,
33M. Hofmann,
3S. F. Hviid,
34W.-H. Ip,
35S. Ivanovski,
8L. Jorda,
32H. U. Keller,
36M. M. Knight,
22J. Knollenberg,
34D. Koschny,
20J.-R. Kramm,
3E.
K¨
uhrt,
34M. K¨
uppers,
4P. L. Lamy,
48L. M. Lara,
33M. Lazzarin,
23J. J. L`
opez-Moreno,
37J. Manfroid,
13E. Mazzotta Epifani,
45F. Marzari,
23G. Naletto,
25,38N. Oklay,
3P. Palumbo,
8,15J. Wm. Parker,
39H. Rickman,
28,40R. Rodrigo,
4,41J.
Rodr`ıguez,
37E. Schindhelm,
39X. Shi,
3R. Sordini,
8A. J. Steffl,
39S. A. Stern,
39N.
Thomas,
5C. Tubiana,
3H. A. Weaver,
42P. Weissman,
43V. V. Zakharov,
7,44and
M. G. G. T. Taylor
201Max-Planck Institut f¨ur Kernphysik, Saupfercheckweg 1, 69127 Heidelberg, Germany;2Laboratory for Atmospheric and Space Physics,
University of Colorado, 1234 Innovation Dr, Boulder, CO, 80303, USA; 3Max-Planck Institut f¨ur Sonnensystemforschung,
Justus-von-Liebig-Weg, 3 37077 Goettingen, Germany;4European Space Agency (ESA), Camino Bajo del Castillo, s/n, 28692 Villanueva
de la Canada, Madrid, Spain;5Physikalisches Institut, University of Bern, Sidlerstr. 5, CH-3012 Bern, Switzerland;6Space Research
Institute, Austrian Academy of Sciences, Schmiedlstraße 6, 8042 Graz, Austria;7LESIA-Observatoire de Paris, CNRS, UPMC,
Uni-versit´e Paris-Diderot, 5 place Jules Janssen, 92195 Meudon, France;8IAPS/INAF, Via del Fosso del Cavaliere, Roma, 00133, Italy;
9Swedish Institute of Space Physics, ˚Angstr¨om Laboratory, L¨agerhyddsv¨agen 1, Uppsala, Sweden;10Johns Hopkins University,
Depart-ment of Physics and Astronomy, Baltimore, MD, USA;11LPC2E, CNRS, Orl´eans, France;12Jet Propulsion Laboratory/Caltech, 4800
Oak Grove Drive, Pasadena, CA 91109, USA;13Institut d’Astrophysique et de G´eophysique, Universit´e de Li`ege, Sart-Tilman, 4000
Li`ege, Belgium; 14ESA/ESOC, Robert-Bosch-Str. 5, Darmstadt, Germany; 15Dip. di Scienze e Tecnologie, Universit`a degli Studi di
Napoli Parthenope, CDN IC4, I-80143 Naples, Italy;16Institute of Physics, University of Graz, Universit¨atsplatz 3, 8010 Graz,
Aus-tria; 17Institut f¨ur Raumfahrtsysteme (IRS), Universit¨at Stuttgart, Pfaffenwaldring 29, 70569 Stuttgart, Germany; 18Planetary and
Space Sciences, Department of Physical Sciences, The Open University, Milton Keynes, MK7 6AA, UK; 19Space Science Institute,
13456 Cajon Creek Court, Rancho Cucamonga CA 91739, USA;20European Space Research and Technology Centre, European Space
Agency, Keplerlaan 1, NL 2201 AZ Noordwijk, The Netherlands;21Imperial College, South Kensington Campus, London SW7 2AZ,
UK;22Department for Astronomy, University of Maryland, College Park, MD 20742-2421, USA ;23Department of Physics and
As-tronomy ”G. Galilei”, University of Padova, Vic. Osservatorio 3, 35122 Padova, Italy;24LATMOS, CNRS/UVSQ/IPSL, 11 Boulevard
d’Alembert, 78280 Guyancourt, France ;25Centro di Ateneo di Studi ed Attivit ˜A ˇC ˆA
,
a Spaziali ”Giuseppe Colombo” (CISAS),
Univer-sity of Padova, Via Venezia 15, 35131 Padova, Italy;26INAF Osservatorio Astronomico di Padova, Vicolo dell’Osservatorio 5, 35122
Padova, Italy ;27CNR-IFN UOS Padova LUXOR, Via Trasea 7, 35131 Padova, Italy ; 28Department of Physics and Astronomy,
Uppsala University, Box 516, 75120 Uppsala, Sweden;29Department of Industrial Engineering University of Padova Via Venezia, 1,
35131 Padova, Italy30INAF-Osservatorio Astronomico, Via Tiepolo 11, I-34143 Trieste, Italy;31University of Trento, via Sommarive,
9, Trento, Italy ;32Aix Marseille Universit´e, CNRS, LAM (Laboratoire d’Astrophysique de Marseille) UMR 7326, 13388, Marseille,
France; 33Instituto de Astrofisica de Andalucia-CSIC, Glorieta de la Astronomia, 18008 Granada, Spain ; 34Institute of Planetary
Research, DLR, Rutherfordstrasse 2, 12489 Berlin, Germany;35Institute for Space Science, National Central University, 32054
Chung-Li, Taiwan;36Institute for Geophysics and Extraterrestrial Physics, TU Braunschweig, 38106 Braunschweig, Germany;37Instituto de
Astrof`ısica de Andaluc`ıa (CSIC), Glorieta de la Astronom`ıa s/n, E-18008 Granada, Spain; 38Department of Information
Engineer-ing, University of Padova, Via Gradenigo 6/B, 35131 Padova, Italy;39Southwest Research Institute, 1050 Walnut Street, Suite 300,
Boulder, CO 80302, USA;40PAS Space Research Center, Bartycka 18A, 00716 Warszawa, Poland ;41International Space Science
Institute, Hallerstrasse 6, 3012 Bern, Switzerland;42Johns Hopkins University Applied Physics Laboratory, Laurel, MD;43Planetary
Science Institute, 1700 East Fort Lowell, Suite 106, Tucson, AZ 85719, USA;44Sorbonne Universit´es, UPMC Univ Paris 06, CNRS,
Laboratoire de M´et´eorologie Dynamique, 4 place Jussieu, 75252, Paris, France;45INAF-OAR, Via Frascati 33, Monte Porzio Catone
(Roma), 00078, Italy;46Jaicoa Observatory, Aguadilla, Puerto Rico, U.S.A.;47Southwest Research Institute, 6220 Culebra Rd., San
Antonio, TX 78238, USA.;48Laboratoire d’Astrophysique de Marseille, UMR 7326 CNRS & Aix-Marseille Universit´e, 38 rue F´ed´eric
Joliot-Curie, 13388 Marseille cedex 13, France.
Accepted XXX. Received YYY; in original form ZZZ
at Bibliotheque Fac de Medecine on September 8, 2016
http://mnras.oxfordjournals.org/
ABSTRACT
On 19 Feb. 2016 nine Rosetta instruments serendipitously observed an outburst of gas and dust from the nucleus of comet 67P/Churyumov-Gerasimenko. Among these instruments were cameras and spectrometers ranging from UV over visible to microwave wavelengths, in-situ gas, dust and plasma instruments, and one dust collector. At 9:40 a dust cloud developed at the edge of an image in the shadowed region of the nucleus. Over the next two hours the instruments recorded a signature of the outburst that significantly exceeded the background. The enhancement ranged from 50% of the neutral gas density at Rosetta to factors >100 of the brightness of the coma near the nucleus. Dust related phenomena (dust counts or brightness due to illuminated dust) showed the strongest enhancements (factors >10). However, even the electron density at Rosetta increased by a factor 3 and consequently the spacecraft potential changed from ∼ −16 V to −20 V during the outburst. A clear sequence of events was observed at the distance of Rosetta (34 km from the nucleus): within 15 minutes the Star Tracker camera detected fast particles (∼ 25 m s−1) while 100 µm radius particles
were detected by the GIADA dust instrument ∼ 1 hour later at a speed of 6 m s−1. The slowest were individual mm to cm sized grains observed by the OSIRIS cameras. Although the outburst originated just outside the FOV of the instruments, the source region and the magnitude of the outburst could be determined.
Key words: comets: individual: 67P/Churyumov-Gerasimenko – comets: general –
1 INTRODUCTION
In August 2014 the Rosetta spacecraft arrived at comet 67P/Churyumov-Gerasimenko (67P). Since then, the space-craft has been accompanying the comet on its journey around the Sun (Glassmeier et al. 2007). During that time Rosetta used all its instruments to closely study the nucleus and its activity. In August 2015 Rosetta and 67P passed through perihelion at a distance of 1.25 AU from the sun, and a firework display of cometary outbursts was observed
Vincent et al.(2016). Six months later on 19 Feb. 2016 nine
Rosetta instruments serendipitously observed an outburst of gas and dust from the nucleus of 67P. This paper is the first report of this most extensively studied cometary outburst.
The observations were carried out during the Rosetta mission extended phase, very close to the end of the intensive summer that the southern hemisphere of the comet experi-enced between May 2015 and March 2016. A large number of observations were under way in order to obtain final mea-surements to characterise the Southern hemisphere before it re-entered polar night, and to observe the return of the northern hemisphere from its shorter polar night. Ground based observations were most favourable during early 2016 because the comet was still relatively active (as exemplified by the event discussed in this paper) and was visible in the night sky as observed from Earth. During 2015 the space-craft had been flying at greater distances from the comet than originally foreseen, in order to avoid the navigational interference caused by the appearance of dust particles in the star tracker cameras. Therefore, at perihelion the space-craft was at a distance of around 400 km from the comet, as a result of the high dust fluxes produced at this time. The period discussed in this paper was particularly focused on achieving the lowest possible altitudes by orbiting in the ter-minator plane. As such, it was the first time the spacecraft had been within 50 km of the comet since April 2015. These lower altitudes were designed to examine surface changes
? E-mail: [email protected]
due to perihelion passage and the seasonal effects of the approach of equinox. In addition, an overall target for the mission had been to investigate ‘active’ areas and ‘jets’ from their origin at the surface of the comet to in-situ at the spacecraft. However, such observations had been difficult to target specifically. Such a serendipitous event with the in-strument coverage of 19 February 2016 was therefore most welcome. Earlier plans to perform an Activity Campaign by flying through a dust jet with all instruments monitoring the gas and dust environment and the source region on the nucleus underneath had been abandoned because of the star tracker interferences.
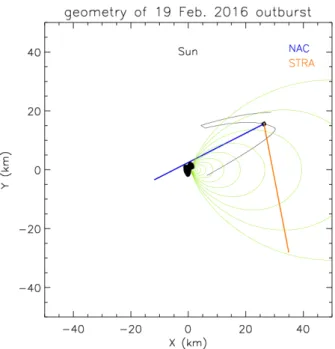
By 19 February 2016 the heliocentric distance had in-creased to almost twice the perihelion distance to 2.4 AU. Rosetta flew hyperbolic arcs between 42 and 32 km with a speed relative to the comet centre of 0.174 m s−1 (Fig.1). At 10:00 on 19 Feb. the distance of Rosetta from the centre of the comet was 34.5 km, the angular size of the nucleus was about 8◦, and the solar phase angle was 63◦. Rosetta was above the southern hemisphere of 67P on the morning side at local time 07:51:37 (referring to the illumination by the sun). The sub-S/C latitude was −30◦and the longitude was 301◦in the Cheops Reference Frame.
Science operations on 19 Feb. called for (1) dust mon-itoring by the OSIRIS imaging system followed by (2) a global coma scan by the microwave instrument MIRO with the Alice UV spectrograph and OSIRIS co-riding. OSIRIS dust monitoring required off-limb pointing for the Narrow Angle Camera NAC and the Wide-Angle Camera WAC (Fig. 1), covering in duration at least a full nucleus ro-tation of about 12 hours. The fourth remote-sensing in-strument VIRTIS, an infrared imaging spectrometer, was monitoring the illuminated nucleus whenever allowed by the dust-monitoring pointings of OSIRIS and MIRO. All in-situ instruments monitored, in parallel, dust (GIADA), gas (ROSINA), and plasma (RPC). In addition the dust collectors of MIDAS were exposed to the environment all day. Science observation periods of about 4 hours were in-terrupted by Nadir pointing navigation and maintenance
at Bibliotheque Fac de Medecine on September 8, 2016
http://mnras.oxfordjournals.org/
teams. In the morning of 22 February the GIADA team re-ported a large flux of compact dust particles between 10:00 and 13:00 on 19 February. The operations team responded that the STR saw a huge increase in background noise in the same time period. The ROSINA team reported a correlated peak in the neutral gas density. Observers on the ground sug-gested from preliminary photometry of 67P with the Tran-siting Planets and Planetesimals Small Telescope (TRAP-PIST) at ESO’s La Silla Observatory an increase in total brightness. A search of the NAVCAM images resulted in im-ages that showed local dust coma brightness enhancements near the nucleus. In addition the Langmuir probes of the Rosetta Plasma Consortium (RPC-LAP) found the space-craft potential to drop from about -15 to -20 V by about 10:00 on 19 Feb. and then slowly go back during the hours after. In the following days MIRO also reported changes in the coma temperature in the same time period. MIDAS also collected plenty of dust during the collection period that in-cluded 19 February. The break-through in understanding of what had happened came about three weeks later when the OSIRIS team presented WAC and NAC images that showed the history of the outburst on 19 February and indicated the potential source region.
In Section 2 we give a detailed description of the ob-servations by various instruments, including some ground-based observations. In Section 3 the timing of the different observations is compared in order to pin-down the exact time of the outburst and identify the potential source region and the magnitude of the outburst. A summary of the results and a comparison with previous outbursts during the peri-helion passage is given in Section 4 including a discussion of further studies and potential mechanisms.
2 OBSERVATIONS
Details of the positive observations of the outburst from Rosetta and ground based astronomical observations are discussed in the following sections. Their order reflects the approximate time order of the maximum signals recorded. First were the OSIRIS and NAVCAM series of camera images and the ALICE UV observations, followed by the MIRO microwave observations, the RPC plasma and the ROSINA COPS gas density measurements. Later came the Star Tracker brightness measurements, and the GIADA dust detections and the MIDAS dust collections. These Rosetta observations are complemented by ground-based observa-tions of coma and tail.
No relevant observations were made by VIRTIS because the VIRTIS-Mapper was looking at the sub solar limb, with the slit located away from the source region. No dust was col-lected by the COSIMA dust mass analyser during 19
Febru-Figure 1. Observation geometry (right) in Sun-67P-Rosetta plane on 19 Feb. 10:00. Black line: projection of trajectory from 15 to 24 Feb. 2016; Square; Rosetta position; blue line: line-of-sight (LOS) of remote sensing instruments (OSIRIS NAC and WAC, Alice, NAVCAM); red line: projection of LOS of Star Tracker A (STR-A); green: schematic evolution of a dust plume.
Figure 2. Model image (generated by the CG Model viewer
https://planetgate.mps.mpg.de:8114/) showing the nucleus and its illumination at 9:40 in the perspective from Rosetta. The Sun is up. The squares of decreasing size are the fields of view (FOVs) of the WAC, NAVCAM, and NAC cameras, respectively. The vertical bar represents the Alice slit and the small circle is the MIRO sub-millimetre beam. The short red, dark green, and blue bars indicate the principle axes of the nucleus.
at Bibliotheque Fac de Medecine on September 8, 2016
http://mnras.oxfordjournals.org/
ary because it was in the dust analysing mode during that period. The Radio Science Investigation (RSI) did not see a sign of the outburst in the radio signal from Rosetta. Also measurements of the gas drag from momentum wheel mea-surements by the attitude and articulation system of the spacecraft were unfavourable during the outburst time pe-riod.
2.1 OSIRIS
The Optical, Spectroscopic, and Infrared Remote Imaging System (OSIRIS,Keller et al.(2007)) on board the Rosetta spacecraft consists of a Narrow- and a Wide Angle Camera (NAC) and (WAC), each having a 2048 × 2048 pixel CCD detector, and fields of view (FOVs) of approximately 2◦× 2◦ and 12◦× 12◦
, respectively. The cameras have regularly imaged the nucleus and coma of 67P since March 2014 in 25 broad- and narrow-band filters covering the wavelength range 240 to 1000 nm (Sierks et al. 2015). The standard data processing on ground comprises bias-subtraction, flat-fielding, correction for distortion of the optical path, and flux calibration relative to standard stars.
From 18 Feb. 21:56 to 19 Feb. 12:10, OSIRIS obtained 1 NAC and 2 WAC images approximately every 30 minutes. The NAC images were taken in the orange filter (centred at 649 nm with a bandwidth of 85 nm, exposure time 3.75 s), and the WAC images were obtained using the green (537 nm, 63 nm, 3 s) and red (630 nm, 157 nm, 1.5 s) filters. At the 34.5 km distance of the comet from the spacecraft, the FOVs covered 1.4 km (NAC) and 6.9 km (WAC). The instrument boresights were pointed at the subsolar limb. The WAC images cover a significant part of the nucleus.
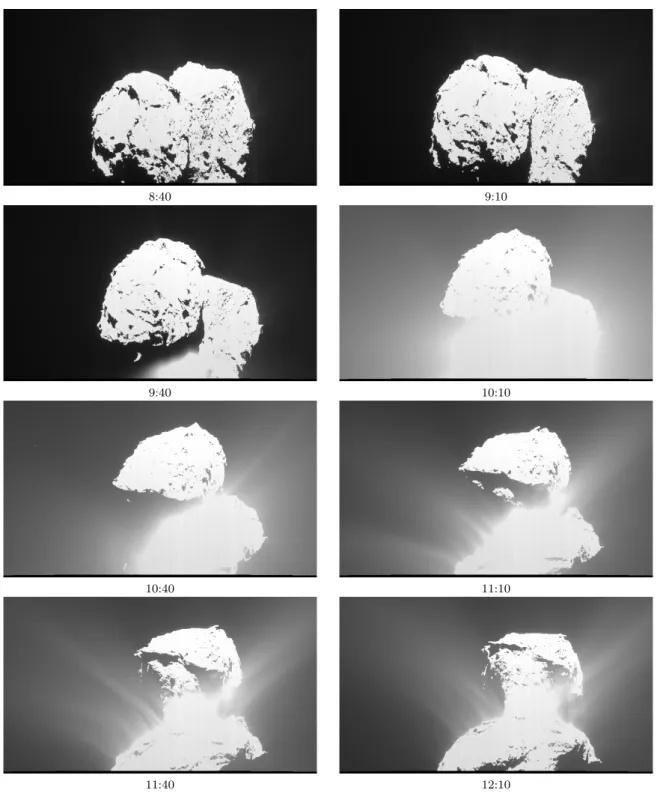
As shown by Fig. 3, up until 19 Feb 9:10 the images show a typical coma composed of faint dust structures. The nucleus has deep shadows and illuminated surfaces that are saturated on the detector, because the exposure times were optimized to capture the faint dust coma. The WAC im-ages obtained at 9:40, however, show a brightening strong enough to saturate the detector in a region where the nu-cleus should be in shadow. By 10:10, the bright cloud had expanded across the entire WAC FOV, saturating the de-tector in front of the whole visible part of the big nucleus lobe. At 10:40 the overall coma brightness had diffused, but a large part of the shadowed nucleus was still hidden behind bright foreground dust. The dust diffused slowly in the fol-lowing images, and several narrow coma structures became visible. These could be related to the outburst, but some may also reflect the typical activity of this region and local time.
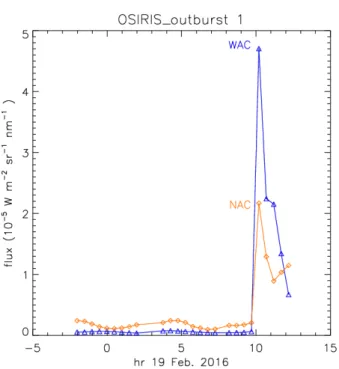
The coma surface brightness as a function of time was measured in two reference areas in the FOVs of NAC (above the sun-lit limb) and WAC (in the lower left corner of the image). These were chosen to be sufficiently distant from the saturated area and from the limb, in order to minimize rotation-induced changes of the brightness as a consequence of changing limb-distance from the irregularly shaped nu-cleus. In the WAC reference area, located near the source region, the surface brightness of the coma (corresponding to the total dust cross-section) increased by two orders of magnitude between 9:40 and 10:10, and decreased back to a factor 10 above the pre-outburst level in the last image obtained at 12:10 (Fig.4).
The NAC images were zoomed and stretched to such de-tail that individual grains became visible. After subtracting the local background the image sequence shows a transition from a point-like granularity (grains that were distant or slow enough to appear as points) to a more linear texture dominated by grains either close or fast enough to be trailed across several pixels. The transition occurred between 11:10 and 11:40.
In the afternoon of 19 February, from 14:30 to 21:30, OSIRIS took NAC and WAC images during a MIRO Great Circle Scan pointing most of the time far from nadir. At 14:30, the coma surface brightness was still one order of mag-nitude higher than at reference epochs with similar pointing. It decreased to normal level at 21:30, i.e. about one spin pe-riod after the start of the outburst.
2.2 NAVCAM
The Navigation Camera (NAVCAM) is part of the space-craft sub-systems. It is used by the Flight Dynamics team in order to determine the relative position between Rosetta and the comet nucleus. Its images are therefore essential for safely navigating the spacecraft in the comet environment. In addition, context images for scientific observations are also scheduled on request of the instrument teams.
There are two identical NAVCAMs on board the space-craft, although only one of them is used in nominal opera-tions. The camera’s field of view is 5◦× 5◦
and its CCD de-tector consists of 1024 × 1024 pixels. The spectral sensitivity covers the visible wavelength range from approximately 550 to 850 nm. A mechanism makes it possible to select between different optical elements with or without attenuation coat-ing. There are no spectral filters.
During the period of the outburst event NAVCAM con-text images without attenuation were acquired at 08:21, 10:14, and 12:29. Afterwards a navigation raster compris-ing four images at 12:51, 12:55, 13:01, and 13:05 was carried out with the attenuation filter. The uncalibrated data are available in the ESA Planetary Science Archive
(Geiger and Barthelemy 2016).
A preliminary version of the foreseen radiometric cali-bration procedureGeiger et al.(2016) was applied in order to transform the raw pixel values to average spectral radi-ance values in the broad visible wavelength range. Fig. 5 depicts the two images acquired at 12:29 and 12:55. The NAVCAM images show that the collimated dust emission seen in the last images of the OSIRIS sequence (cf. Fig.3) continues as the nucleus rotates. In addition to the diffuse component a few individual objects can be seen in the coma. However, from the images it is not possible to determine the distance from the spacecraft and hence the size of these ob-jects.
2.3 Alice
Alice is a far-ultraviolet (70 to 205 nm) imaging spec-trograph on board Rosetta that, amongst multiple objec-tives, is designed to observe emissions from various atomic and molecular species from within the coma of comet 67P
(Feldman et al. 2015) as well as reflected solar radiation
from both the nucleus and the dust coma (Stern et al. 2015;
at Bibliotheque Fac de Medecine on September 8, 2016
http://mnras.oxfordjournals.org/
8:40 9:10
9:40 10:10
10:40 11:10
11:40 12:10
Figure 3. OSIRIS WAC images taken at 8:40, 9:10, 9:40, 10:10, 10:40, 11:10, 11:40, and 12:10, respectively. Each image is about
11.5◦×6.2◦in size, they were obtained in the broadband green filter with 3 second exposure time. The image brightness is scaled according
to the square root of the measured flux, with minimum and maximum values of 1.5 × 10⁻⁷(black) and 1.5 × 10⁻⁴W m−2sr−1nm−1
(white). The Sun is at the top.
Feaga et al. 2015). The spectrograph slit is in the shape of
a dog bone, 5.◦5 long, with a width of 0.◦05 in the central 2.◦0, while the ends are 0.◦10 wide, giving a spectral reso-lution between 0.8 and 1.2 nm for extended sources that fill its field-of-view. Each spatial pixel or row along the slit is 0.◦30 long. Details of the instrument have been given by
Stern et al.(2007).
In particular, Alice is able to address the timing and
du-ration of the event. The Alice observations were made with the small lobe of the nucleus in the lower half of the slit and the coma above the sunward limb in the upper half, as shown in Fig.2. A spectrum taken on 19 Feb. 11:19:44 is shown in Fig.6. A light curve derived from the Alice spectra is shown in Fig.7. In two successive 10-minute histograms beginning at UT 09:45:59 Alice observed a ∼50% increase in brightness in the direction of the small lobe of the nucleus. Considering
at Bibliotheque Fac de Medecine on September 8, 2016
http://mnras.oxfordjournals.org/
Figure 4. Surface brightnesses measured in the WAC and NAC reference areas.
the 10-minute integration time of the Alice data, the onset time is consistent with that reported by the other remote sensing instruments on Rosetta. At the same time the dust coma brightness increased by a factor of ∼5 and remained at that level for ∼30 minutes. The following histograms had contamination of the coma from a bright star in the field-of-view leading to a 20-minute data gap. From UT 11:10 until the end of the observation sequence at ∼12:30 the coma brightness remained at a value of ∼2.5 times the prior qui-escent level. There were no further Alice observations with the same viewing geometry on 19 February. The same data do not show any significant gas emissions at the time of the outburst.
2.4 MIRO
MIRO (Microwave Instrument for the Rosetta Orbiter) is a small radio telescope working at millimetre and submil-limetre wavelengths (Gulkis et al. 2007). It has broadband continuum receivers designed to measure the sub-surface properties of the nucleus and to study dust in the coma. MIRO also has a high-resolution spectrometer, which can be used to probe the abundance, temperature, and velocity of several coma gases, including H2O. MIRO is calibrated
against two internal targets approximately every 30 minutes, and can also be calibrated against dark sky measurements when looking far from the nucleus. Here we focus on some of MIRO’s spectral observations during the outburst. A more complete description of MIRO’s view of the outburst is in
Hofstadter et al.(2016).
MIRO is a single-pixel instrument. From about 08:10 to 12:30 on 19 February 2016 Rosetta was performing a stare above the sub-solar limb (Fig.2). Most of that time MIRO’s footprint was above the limb, but from about 09:30 to 11:00
the rotation of the nucleus brought parts of the surface into its line-of-sight.
Water vapour all along MIRO’s line-of-sight contributes to the received signal, so interpreting the spectrum at all frequencies requires detailed consideration of the three-dimensional structure of the coma. Given the strength of the water line, however, there are frequencies at which the coma is optically thick, and MIRO senses only the gas relatively close to the spacecraft. The received signal is remarkably constant at these frequencies. Even as the nucleus moves into and out of MIRO’s LOS, the signal does not change because the nearby gas screens the view of everything be-yond it. Under these optically thick conditions, the amount of radio energy received is set by the rotational temperature of the gas.
Figure8shows the radio emission from the coma at an optically thick frequency, expressed as a brightness temper-ature. The frequency chosen corresponds to the H162 O line
center for gas moving at 620 m/s toward the spacecraft. The H162 O spectrum in this region shows features indicative
of being optically thick (Hofstadter et al. (2016)) and the H182 O line shape confirms the gas expansion velocity is near
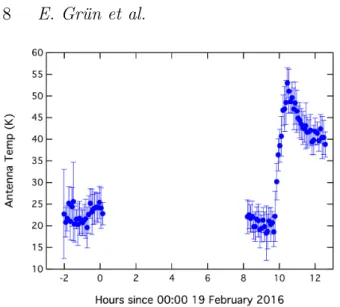
600 m/s. In the figure, the brightness temperature rise of the gas by about 30 K was starting just before 10:00 on 19 February, followed by a slow decrease for several hours. At about 12:30 the spacecraft began pointing to different areas of the coma, and the measurements can no longer be directly compared to those shown. It is interesting to note that one nucleus rotation (about 12.4 hours) before the outburst, the nucleus orientation and MIRO’s observing geometry were similar to that during the outburst. Figure8also shows that the temperature of the coma at that time (times from -2:00 to 00:00) is consistent with the values measured just before the outburst. This demonstrates that the change occurring near 10:00 is not due to normal diurnal variations.
Hofstadter et al.(2016) explore three possible
explana-tions for the increase in coma temperature. One is that the gas during the outburst is coming from a source region on the nucleus with a significantly higher physical temperature than the normally sublimating regions. Another possibility is that the local gas density during the outburst, either above or below the surface, increased enough to alter the adiabatic cooling expected as the gas expands into a near vacuum. The third explanation we are exploring is that the gas is warmed by the dust either via collisions or radiation. Gas by itself cools adiabatically very quickly as it expands into space, whereas dust by itself can stay warm because it cools radiatively much more slowly.
An important clue, discussed later (see Fig.18below), is that the increase in gas temperature near the spacecraft observed by MIRO occurs several minutes after dust is first seen rising from the nucleus, but several minutes before the local gas density increases. Note that dust travelling at me-tres per second takes over an hour to travel from the nucleus to the spacecraft, while gas moving at 620 m s−1takes only about a minute. The relative timing of rising dust at the surface, the increase in gas temperature at the spacecraft, and then the increase in gas density at the spacecraft, is not yet understood.
at Bibliotheque Fac de Medecine on September 8, 2016
http://mnras.oxfordjournals.org/
Figure 5. NAVCAM images acquired at 12:29 (left) and 12:55 (right). The first image was taken without attenuation filter and 0.01 sec exposure time. The vertical structures towards the top right are blooming artefacts due to saturation on parts of the nucleus. The second image is part of a navigation raster with attenuation filter and 1.75 sec exposure time. The grey scales were adapted such that
the maximum (white colour) corresponds to 1 × 10⁻⁴W m−2 sr−1nm−1.
Figure 6. An Alice spectral image beginning at UTC 11:19:44 showing the solar reflected radiation from the nucleus in the lower right. Dust in the coma shows up in the upper right. The orienta-tion of the slit is as shown in Figure 2. The integraorienta-tion time was 1814 s.
2.5 RPC
The Rosetta Plasma Consortium (RPC,Carr et al.(2007)) is a suit of five plasma sensors to monitor the electro-magnetic field and the ionised environment around 67P. Among the RPC sensors, RPC-MIP (Mutual Impedance Probe, Trotignon et al. (2007)) and RPC-LAP (Langmuir Probes,Eriksson et al.(2007)) measure the plasma density. Following the increase in neutral density by a factor of about 1.8 (ROSINA-COPS, section 2.6), MIP and LAP observed a local plasma density increase by a factor of about 2.7 to 3 during the outburst, both through the electron plasma fre-quency increase (MIP) and (negative) spacecraft potential increase (LAP), as shown in Figs.9and10. The spacecraft
Figure 7. Light curve of the reflected solar radiation (175-195 nm) seen by Alice. The times represent the mid-points of each 10-minute integration. The enhancement in emission seen towards the nucleus is superimposed on a smooth variation due to changes in geometry as the comet rotates. The sub-spacecraft longitude(dot-dashed line) and latitude (dashed line) are also
shown. The line near the bottom shows the 3.◦58 offset of the
boresight from nadir towards the Sun.
potential is proportional to the logarithm of the electron density. Note that a local decrease in the plasma density is observed just before the onset of the outburst, around 9:45 UT. The energetic electrons observed during the out-burst are colder than before and after the outout-burst, as suggested by RPC-IES electron spectra (Ion and Electron Spectrometer, Burch et al. (2007)). This would be
at Bibliotheque Fac de Medecine on September 8, 2016
http://mnras.oxfordjournals.org/
Figure 8. Time evolution of the H2O excitational temperature of the gas near the spacecraft, as measured by gas moving at
a velocity of 620 m s−1 towards the observer (see text). MIRO
collected spectral data every 30 seconds. The indicated points represent a 5-minute average of those data, with error bars being the rms deviation of the 10 spectra in each average.
tent with electron cooling during the outburst, in the re-gion between the comet and the spacecraft. Such cooling may be the signature of an increase in electron-neutral col-lisions, which is consistent with the observed increase in the neutral density (section 2.7). Those collisions may have in-creased the local ionisation by electron impact in the region between the comet and the spacecraft. An increase in the ionisation source closer to the comet could explain the sig-nificant relative increase in plasma density, which is larger than the relative increase in neutral density, observed at Rosetta during the outburst. However, other possible expla-nations exist, such as a reduced neutral outflow velocity or changes in composition. Further studies are needed to itify the exact mechanisms causing the variable plasma den-sity as well as the faster plasma denden-sity decay compared to the neutral density decay. Finally, the plasma density relaxes to the pre-outburst value around 12:00 UT, faster than the neutral density, while cold electrons are still observed until 14:00 UT.
While the electron density increased, the average magnetic field measured by RPC-MAG (Magnetometer,
Glassmeier et al.(2007a)) increased slightly from 16 nT to
19 nT. This change was mostly in the y-direction, meaning the direction in the ecliptic that is perpendicular to the Sun-comet line. At the same time the power spectral density in the range of 50-100 mHz decreased by about a factor 1/2.
2.6 ROSINA
ROSINA is designed for in-situ measurements of the cometary coma gas density and composition (Balsiger et al. 2007). The instrument package consists of two complemen-tary mass spectrometers (DFMS and RTOF) for neutrals and primary ions and a pressure sensor (COPS). ROSINA-COPS is an in-situ instrument consisting of two separate sensors, described byBalsiger et al.(2007). The nude gauge (NG) measures the total ambient neutral gas number den-sity at the spacecraft position and the ram gauge, which is
Figure 9. The negative spacecraft potential as determined by RPC-LAP. Individual measurements (dots) and smoothed signal (blue line).
Figure 10. Plasma density measured by RPC-MIP.
normally pointing at the comet, measures the ram pressure of the outflowing gas of coma. All data presented in this study are from the NG sensor only. The neutral gas density is determined from the sensor signal as a linear combination of the abundances of the dominant species H2O, CO2, CO,
and O2which are obtained by DFMS spectrometer
measure-ments (H¨assig et al. 2015).
The neutral gas density is modulated by the space-craft location around the nucleus and the nucleus illumi-nation conditions. Because of the highly irregular shape of the nucleus, the gas production varies by about a factor of 2 depending on the face that is illuminated by the Sun
(Bieler et al. 2015). On 19 Feb. the neutral gas density (Fig.
11) showed fluctuations of up to 108cm−3
due to the nu-cleus rotation. However, at ∼10:00 the gas density rapidly increased to almost 1.5 × 108cm−3
which is more than 50%
at Bibliotheque Fac de Medecine on September 8, 2016
http://mnras.oxfordjournals.org/
Figure 11. Neutral gas density (red) and uncalibrated COPS sig-nal (blue, arbitrary units) during 19 Feb. 2016. Calibration was only applied when DFMS measurements were available. During MR global coma scan starting at 13:00 the coma gas was contam-inated by spacecraft outgassing.
higher than the normal fluctuations at a similar nucleus phase.
2.7 Star Tracker
The autonomous attitude control system of the spacecraft relies on Star Tracker measurements as the main source of information (Buemi, Landi, & Procopio 2000). The field of view of the Star Tracker camera has a size of 16.4◦× 16.4◦
. The characteristics of its CCD detector are identical to those of the NAVCAM, i.e. 1024 × 1024 pixels and a broad spec-tral sensitivity in the visible wavelength range.
For redundancy two identical Star Trackers are available (STR-A and STR-B). Although they are both mounted on the -X-face of the spacecraft, their boresight directions differ by ≈ 30◦. In the period of interest STR-A was continuously active in the closed attitude control loop. In addition, STR-B was switched on for 15 minutes at around 13:00 UTC for a regular attitude acquisition test.
In their operational modes the Star Trackers track the positions and magnitudes of up to 9 stars in the field of view. Housekeeping telemetry downlinked to ground includes a pa-rameter that reports the mean background signal in 20 × 20 pixel windows centred on the tracked stars. The value of this parameter quantifies the diffuse light contribution due to scattering by unresolved dust particles and provides valuable information about the temporal evolution of the outburst event.
We converted this parameter value into spectral radi-ance units by subtracting a bias value estimated from the available time series during the whole mission and by apply-ing a calibration coefficient determined from the magnitude
Figure 12. Temporal evolution of the mean background radiance measured by Star Tracker A (STR-A) during the outburst event. The results are derived from a housekeeping telemetry parame-ter which reports the mean background signal in 20 × 20 pixel windows around the (up to 9) tracked stars.
conversion relations specified by the manufacturer in the on-board software. The uncertainty of this rough radiance cali-bration is expected to be in the order of 50% or better. The spectral radiance values should be understood as a weighted average over the broad visible sensitivity range.
The temporal evolution of the STR-A mean background radiance on 19 February is shown in Fig.12. At the begin-ning of the depicted period the signal is at the noise level. However, shortly before 10:00 UTC the measured back-ground radiance sharply increases, reaches its maximum at 11:00 UTC, and then slowly decreases. The step at about 14:00 UTC is due to a significant attitude change of the spacecraft due to the MIRO global coma scan. Before that time the spacecraft +Z-axis pointed towards the nucleus and consequently the STR-A boresight pointed 90◦off-nucleus.
The radiance values measured by STR-B during its short operating period are in the same order as the STR-A results. Their quantitative difference is consistent with the different boresight directions of the two Star Trackers.
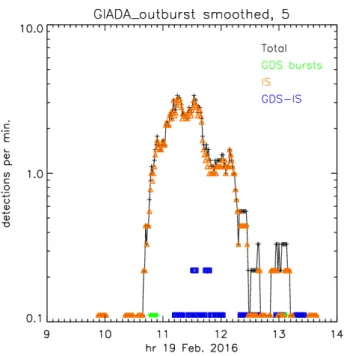
2.8 GIADA
GIADA (Grain Impact Analyzer and Dust Accumulator) consists of three subsystems: 1) the Grain Detection System (GDS), which detects dust particles as they pass through a laser curtain and provides particle speeds and their optical cross section; 2) the Impact Sensor (IS) measures particle’s momentum from their impact on a plate connected to five piezoelectric sensors, which combined with the GDS detec-tion time provides the particle speed and mass; 3) the Micro Balances System (MBS) provides the cumulative dust flux of grains smaller than 10 µm (Della Corte et al. 2014), by using five quartz crystal microbalances in roughly orthogo-nal directions. Calibration activity performed on GIADA by means of cometary analogues (Ferrari et al. 2014) mean that it is possible to convert the GDS signal to the dust particle geometrical cross section (Della Corte et al. 2016), and thus to constrain the particle density (Rotundi et al. 2015). GI-ADA disentangled two particle families (Della Corte et al. 2015) present in the 67P coma: high density aggregates (de-tected by GDS and IS together and by IS alone), i.e. compact particles, and low density porous aggregates (detected by GDS alone), i.e. fluffy particles. GIADA observed an excep-tional dust detection rate on the 19th of February 2016: 188
at Bibliotheque Fac de Medecine on September 8, 2016
http://mnras.oxfordjournals.org/
Figure 13. Rate of GIADA dust detections (total: black) and by its subsystems GDS-IS (blue), IS (red), and GDS bursts (green). The individual counts were smoothed with a 9-minutes running average.
compact particles detected from 10:25:41 to 13:35:47 (Fig. 13) and 5 dust showers (Fulle et al. 2015) representing a to-tal of 386 fluffy particles, 359 of which were detected from 17:27:35 to 17:28:00. The 5 dust showers are counted in the following only as 5 individual events sinceFulle et al.(2015) suggest that the showers are caused by electro-static break-up of very fluffy agglomerates of sub-micron grains close to the Rosetta spacecraft. This is compared to a mean detection rate of ∼ 3 compact particles/day for most of the month of February 2016. For the GDS-IS detections GIADA provides directly particle speed, mass, and density. However, some assumptions have to be made in order to acquire the same information from detections on IS alone Della Corte et al. (2016).
2.9 MIDAS
MIDAS is an atomic force microscope (AFM) coupled with a dust collection and handling system (Riedler et al. 2007;
Bentley et al. 2016). Capable of resolutions down to the
nanometre level, the AFM operates by scanning a sharp tip over the sample and produces three-dimensional images of collected dust particles. During the outburst event MIDAS was exposing target 13 as part of a 3-day exposure (2016-02-16 23:25:25 until 2016-02-20 05:55:19). Coarse (64 × 64, 1.25 µm/pixel) images of the centre of this target immedi-ately showed that new particles had been collected. Since this time a number of scans have been performed to inves-tigate the coverage of this target, in particular to constrain whether the collection represents a large number of indi-vidual dust particles or a multitude of fragments originating from a few larger particles impacting the target. These scans are ongoing and the values presented here may change as more data is analysed.
Data have been processed by performing a polynomial plane subtraction and median line correction to remove the scanner-sample slope and correct for distortions dur-ing the scan. Particles have then been manually identified and masked. Some areas have no corresponding pre-exposure scans; in these cases it cannot be excluded that the particles are contaminants. However, the morphology of dust on this target is so different from any contaminant detected to date, that the probability of contamination is low. Nonetheless de-tections smaller than 3 pixels have been excluded here.
The area of the target scanned to date is 90880 µm2and 135 particles have been identified with an areal coverage of 4.2%. The particle count does not attempt to separate im-pact fragments from individual particles since the coverage is not yet sufficient to determine this, and thus represents an upper limit. For this reason, a true size distribution of the particles prior to collection cannot yet be established. In-stead, some limits are given based on the effective diameters (the diameter of a circle having the same projected area as the particle) of the collected particles or fragments. Ninety percent have an effective size less than 9.3 µm and 50% less than 3.7 µm.
2.10 Ground-based observations
Hundreds of ground-based observers, both professional and amateur, have an interest in observing 67P because their data complement the in situ observations by Rosetta. In the following paragraph we present data obtained from a 30 cm amateur telescope and a professional group with a 60 cm telescope. We also report results from a second professional group with a 2 m telescope.
The Rosetta amateur observer campaign
(http://rosetta.jpl.nasa.gov/rosetta-ground-based-campaign)
provides a link between amateur astronomers and the ESA/Rosetta mission. The image provided by Efrain Morales (Fig. 14) shows the coma and tail about 10 days after the outburst. Most of the dust particles seen in the image were emitted after the perihelion passage in summer 2015. However, big mm and cm sized particles from the 2009 perihelion passage also contribute to the brightness in the trail. Particles emitted during the outburst on 19 Feb. 2016 populate the bright central portion of the image.
The robotic 0.6-m telescope TRAPPIST (TRAnsit-ing Planets and PlanetesImals Small Telescope;Jehin et al. (2011)) is located at ESO’s La Silla Observatory. It is equipped with an FLI ProLine PL3041-BB camera with 2k×2k pixels of 15 µm. Used with the 2 × 2 binning mode it results in a pixel scale of 1.3 arcsec and a field of view of 22 arcmin. The observations of comet 67P have been per-formed once or twice a week in 2016 with a Johnson-Cousins Rc filter and with exposure times ranging from 180 to 240 s. TRAPPIST images are reduced following a standard proce-dure described inOpitom et al.(2015). The sky background is subtracted and the photometric calibration is performed using regular observations of photometric standard stars. The Af ρ parameter (A’Hearn et al. 1984) is computed at a physical distance from the comet of 5 000 km (Fig. 15). The observed brightness has been corrected for the varying phase angle (Sun-67P-observer) using a phase function that is the composite of two different empirical phase functions
fromSchleicher, Millis, & Birch(1998) andMarcus(2007).
at Bibliotheque Fac de Medecine on September 8, 2016
http://mnras.oxfordjournals.org/
Figure 14. Image of 67P taken on 29 Feb. 2016 5:39 UTC taken by Efrain Morales with the 30 cm LX200ACF telescope at Jaicoa Observatory, Puerto Rico, U.S.A.. The CCD image was obtained with a total exposure time of 54 min through a Baader IR filter. The scale of the image is 2.1 × 1.4 million km; the length of the star tracks corresponds to ∼ 120 000 km at the comet’s distance.
During the first 100 days of 2016 the phase angle varied from 28◦at the beginning of that period, through to a minimum phase angle of 4◦at opposition, and finally to 9◦at the end of that period. After 19 Feb. 2016 the coma brightnesses in a 5000 km aperture show a clear increase of ∼25% over val-ues from earlier observations. This increased brightness was observed between 29 February and 6 March. The beginning of the brightness increase cannot be precisely determined because of bad weather in the days following the 19 Febru-ary outburst. On 17 March, the brightness values are back to the normal trend. However, not much of this brightness enhancement remains after the application of the phase func-tion correcfunc-tion because of the opposifunc-tion surge of the applied empirical phase function, which was derived for observations of 1P/Halley Schleicher, Millis, & Birch (1998). The phase correction at low phase angles is rather imperfect and may change after careful comparison with Rosetta observations (see below).
(Boehnhardt et al. 2016) report 67P observations with
the 2 m telescope on the Mt. Wendelstein observatory of the University Observatory Munich. Their brightness values after 19 Feb. 2016 deviate clearly beyond measurement un-certainty from the brightness trend using a fit to the earlier observations. However, application of a special phase func-tion reduced the effect of the outburst. Contrary to an earlier outburst of 67P (22-23 August 2015), on 21-22 Feb. 2016 the 67P coma appeared to be undisturbed in terms of geometric dust structures and radial gradient, except for an increase in the brightness.
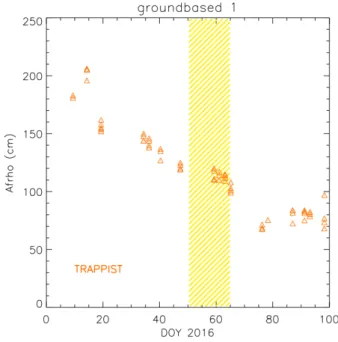
In Fig.15the phase corrected Af ρ data are compared with the time period (shown by yellow stripes) when all burst particles with speeds ≥ 4 m s−1 are still within the aperture. The observations may show a ∼ 10% increase of Af ρ ∼ 10 cm) in the burst period compared with the values before the outburst. Later observations display the expected decrease of Af ρ with heliocentric distance and time.
The long lasting ‘bump’ in the brightness of the comet as seen in the TRAPPIST and in other data sets
(Boehnhardt et al.(2016);Snodgrass et al.(2016)) is
coin-cident with the outburst, but also with the comet being at
Figure 15. Corrected Af ρ parameters of 67P for the time period from Jan. 9 to April 7, 2016 obtained from observations with the TRAPPIST telescope for apertures of 5 000 km. The yellow area
marks the times when all burst particles with speeds ≥ 4 m s−1
are within the aperture.
opposition. It may therefore be a combination of a geometric effect and the prolonged increase in activity. There is some indication that the departure from a smooth decrease in Af ρ starts before 19 February.
To estimate the total dust mass from the increased coma brightness observed with TRAPPIST, we assume that the increase in phase-corrected Af ρ by approximately 10 cm observed around 19 Feb. 2016 was due to dust released dur-ing the outburst on February 19. With Af rho = 4ps2N/ρ
(M¨uller 1999) and assuming a geometric albedo of p = 0.05, mean particle radius s = 100 µm, and aperture radius of ρ = 5000 km, we find N = 2.5 × 10¹¹ particles in the aper-ture, corresponding to a total dust mass of 103kg for a bulk density of 1000 kg m−3.
3 DISCUSSIONS
In this section we describe the timing and duration of the outburst that was observed by the different instruments, and we discuss what this can tell us about the properties of the material released by this event. At first we start with the time relation of the data, secondly, we try to identify the time and source region of the outburst, and thirdly, we dis-cuss the magnitude of the outburst. In order to do this we have to make some (not necessarily unanimously agreed) ad hoc assumptions just for the purpose to demonstrate the interrelations between the various observables. Eventually, such assumptions have to come from a comprehensive model of the outburst which is not the task of this first paper.
at Bibliotheque Fac de Medecine on September 8, 2016
http://mnras.oxfordjournals.org/
3.1 Time relation of the data
Timing and duration of the outburst can be investigated because the clocks for the different instruments are syn-chronised with the spacecraft clock. The flight control team makes sure that the spacecraft clock and ground time (UTC) is accurate within less than ∼ 10 milliseconds. The measure-ment of any parameter takes a certain amount of time, which is called the integration time. If the integration time is short (< 1 second), then this is of no concern here. Even if the measurement only takes a short time, the time tagging and the sampling of the available telemetry data points may be much less frequent than that. In the case of the data dis-cussed here we assume that the accuracy of the sampling is of the order of a few seconds. Some images have longer inte-gration times, which can be identified using the image data products, which carry a PDS label keyword IMAGE TIME in the filename that refers to the middle of the integration time. The start and stop time of the integration are given by the START TIME and STOP TIME keywords in the image label files.
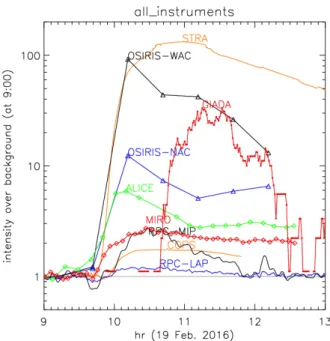
All measured parameters discussed above are displayed in Fig.16from 9:00 to 13:00 on 19 Feb. 2016. For any given time the ratio of the intensity over the background value at 9:00 is displayed. Most parameters reached their maximum between 10:00 and 11:00. The intensity enhancements during the outburst ranged from ∼ 20% (RPC-LAP) to a factor of 130 (STR-A). The parameter values at 9:00 and at maximum are also given in Table1.
The majority of the observations refer to the dust emit-ted in the outburst (Fig.17). These dust observations dis-play a significant time lag between the observations by dif-ferent instruments. The first signature was the dust cloud in the WAC images at 9:40. The next was the significantly enhanced coma brightness (≥ 10% of max. value above back-ground) observed by Alice at 9:51 followed at 9:58 by STR-A. Maximum brightness was observed by the OSIRIS WAC and NAC at 10:10. The GIADA smoothed count rate ex-ceeded 10% of maximum value above background at 10:42, and the trailed NAC images of near-by individual grains were observed at and after 11:40.
The enhanced coma brightness observed by Alice and OSIRIS refer to dust near the nucleus and their order is mostly determined by the respective sequence of observa-tions. In contrast, the enhanced signatures in the STR-A, GIADA, and OSIRIS near-by grain data represent a clear time-of-flight relation of grains of different sizes and emis-sion speeds. The mean speed of the GIADA grains (GDS IS) is 6.5 m s−1and the mean mass is 4 × 10⁻⁸kg, which corre-sponds to a radius of about 180 µm (at an assumed density of 1000 kg m−3).
For the STR-A camera to see any dust from the out-burst, the emitted grains had to have traversed the distance of ∼ 30 km from the nucleus to the STR-A FOV. Therefore, the fastest particles that were seen by STR-A had to have a speed of at least 25 m s−1. The majority of them had speeds between 5 and 10 m s−1. Similarly, the particles that had trails in the OSIRIS images had speeds of ≤ 4 m s−1.
If we assume a speed-radius dependence of v ∼s−0.5 then the particle sizes range from ∼ 10 µm for the fastest STR-A particles to ∼ 300 µm for the OSIRIS individual
par-Figure 16. Intensity ratio of the measured parameters over the intensity measured at 9:00.
ticles. The smallest particles (≤ 10 µm) were those collected by MIDAS.
The earliest indication of gas in the outburst was ob-served by MIRO at 9:52 (Fig.18). This is within a minute of the earliest dust observations by Alice. Both LOSs are very close to each other. However, Alice measurements refer to dust near the nucleus while the MIRO signal is assumed to originate near Rosetta.
ROSINA COPS detected significant gas density increase (> 10% of maximum) at the position of Rosetta at 9:57. There was a small dip in the gas density (∼ 10% of the following enhancement) for ∼ 10 minutes just prior to the strong rise of the signal.
RPC-MIP observed an increase of the electron density at Rosetta at 10:00. However, a significant reduction of the electron density started already at 9:38, just at the expected time of the outburst. The dip in the electron density had an amplitude of ∼ 15% of the following enhancement.
The spacecraft potential monitored by RPC-LAP fol-lowed closely the course of the electron density becoming more negative at higher electron densities. At 9:00 the mean S/C potential was about -16.7 V; by 9:42 it was -15 V and became rapidly more negative reaching -20 V around 10:20. During the following 3 hours the S/C potential excursion decreased to the normal value of ∼ −16 V.
3.2 Time and source region of the outburst The first sign of outburst was seen at 9:40 in the OSIRIS image (Fig.3) close to the shadow region. Fig.19shows the same image with isophotes. The bottom centre brightness originates from the dust cloud that was generated in the outburst and became illuminated by the Sun. Figure2shows the model scene with the complete nucleus and the shadow at 9:40 but without the dust cloud.
The potential source region is in the centre at or
at Bibliotheque Fac de Medecine on September 8, 2016
http://mnras.oxfordjournals.org/
ROSINA COPS Gas density [cm−3] 0.83 × 10⁸ 1.49 × 10⁸ 1.80 10 : 45.3
STR-A Brightness [W m−2sr−1nm−1] 2.6 × 10⁻⁸ 3.43 × 10⁻⁶ 132.1 10 : 58.2
GIADA Dust count rate [min−1] 0.1 3.33 33.3 11 : 15.0
Figure 17. Normalized intensity (to maximum) of dust observa-tions
low the edge of the WAC image (in region Seth, Anubis, or Atum). The brightness of the dust cloud is in saturation. Most of the scene below the WAC image is in the shadow except for a cliff that just appeared in full sunlight. The gra-dient of the isophotes in the lower part of the image (Fig. 19) points to a maximum brightness close to the illuminated cliff which is ∼ 700 m below the edge of the image. At an expansion speed of ∼ 25 m s−1 the time for the cloud to enter the FOV of the WAC camera is . 120 s. This brings the outburst time to 9:38 ±1 minute. The centre coordinates of the illuminated cliff are in the Atum region at longitude 232.3◦, latitude -28.6◦, and radius 1738 m.
The outburst started close to the morning terminator and the source region rotated at a rate of ∼ 30◦/hour into the Sun direction; at about 13:00 on 19 Feb. the source region was near the subsolar limb and at about 16:00 the source region reached the evening terminator and entered comet night.
Figure 18. Normalized intensity (to maximum) of gas and plasma observations
Figure 19. OSIRIS WAC image at 9:40 with isophotes. The isophotes are separated by a factor 1.4 with the innermost
isophote at a brightness of 10.54 × 10⁻⁵W m−2sr−1nm−1(just
below the saturation limit).
at Bibliotheque Fac de Medecine on September 8, 2016
http://mnras.oxfordjournals.org/
3.3 Magnitude of the outburst
The peak brightnesses observed by Alice and OSIRIS provide a means to estimate the magnitude of the out-burst. The increase in mean coma brightness in the 175-195 nm bandpass is ∼ 370 rayleighs. This translates to a radiance of I = 1.58 × 10⁻⁸W m−2nm−1sr−1at 185.5 nm. The solar radiance at 185.5 nm and at 2.4 AU is 1.58 × 10⁻⁴W m−2nm−1sr−1so I/F = 1.0 × 10⁻⁴. From OSIRIS NAC we find I/F ∼ 3 × 10⁻⁵ before the outburst and ∼ 2 × 10⁻⁴
after the outburst, in good agreement with the Alice result. The filling factor, or optical depth, τ , is given by I/F = pj(α)τ , where p is the geometric albedo and j(α) is the phase function. Assuming that the dust has the same properties as the nucleus (Feaga et al. 2015), p = 0.04, j(63◦) = 0.10, so τ = 0.025. OSIRIS WAC finds τ = 0.01 before and τ = 0.1 immediately after the outburst. This dif-ference is not surprising since the LOSs of both instruments are different in relation to the centre of the outburst. Future detailed analysis and modelling the scattering properties of dust of different sizes at different wavelengths along similar LOSs may provide information on the size distribution of the particles. In addition the total cross-section of particles generated in the outburst may be estimated by modelling the particles’ emission.
There is another way to calculate the total cross-section of the emitted particles; this is from the in situ measure-ments by GIADA and MIDAS. MIDAS found an areal cov-erage of 4.2% of bigger than 1 µm-radius particles. The to-tal area of the GIADA IS detector is 10−2m2. The total cross-section of all particles detected during outburst by GI-ADA is 7 × 10⁻⁶m2corresponding to 1.2 × 10⁻³coverage of > 100 µm-radius particles. Scaling the dust coverage to 2 km i.e. ∼1/20th of the Rosetta distance then an optical depth of 1 is reached. This value is compatible with the saturated brightness of the inner dust cloud in the OSIRIS WAC image at 9:40. If detailed analysis confirms these values then dur-ing the outburst the dominant cross-section is in the MIDAS particles of radius < 100 µm.
The total mass of > 100 µm-radius particles detected by the 10−2m2GIADA IS and GDS sensors at 35 km from the
nucleus is 1.33 × 10⁻⁶kg. If we assume that a similar mass flux of dust particles was emitted into a solid angle Ωd= 1 sr
then the total mass M100µm = 1.6 × 10³kg not counting
any mass contribution by smaller and much bigger particles. This mass is about 1.6 times the mass derived from Af ρ measurements in ground-based observations (Section 2.10). The width of the emission was therefore probably narrower than assumed above. The interpretation of the ground-based observations may also be improved by the comparison with Rosetta observations.
Similarly, the gas production can be estimated from the measured extra gas density ng ∼ 5 × 107 cm−3at Rosetta.
We assume that the gas from the outburst is emitted into a solid angle Ωg= 2π sr with a speed vg∼ 600 m s−1. The gas
production rate in the outburst is then Qg = ΩgrROS2 vgng≈
2.3 × 1026s−1corresponding to ∼ 10 kg s−1H2O, CO2, and
CO. The duration of the enhanced gas density was about 2 hours; therefore a total of ∼ 7 × 10⁴ kg of gas was emitted during the outburst. This exceeds the total amount of dust detected by GIADA by at least a factor of 40, giving a lower limit for the dust-to-gas-mass-ratio of ∼ 0.025. During the
background emission Fulle et al.(2016) estimate the dust-to-gas-mass-ratio to be ∼ 6 or larger.
4 CONCLUSIONS
The outburst on 19 Feb. 2016 was unexpected, but serendip-itously most Rosetta instruments were in suitable measuring conditions while the outburst unfolded. This was very special because for the many outbursts during perihelion passage (July to September 2015, Vincent et al. (2016)) we never had the situation that that many instruments observed the same outburst at once. In particular, the in-situ dust instru-ments did not make significant observations of these out-bursts. This was due to the large distances (up to 400 km) Rosetta had to maintain for safety reasons. The unique cir-cumstances of the 19 February outburst enabled the in-situ instruments to provide important measurements to quantify the outburst.
The likely outburst location in the Atum region at lat-itude −28.6◦and longitude +232.3◦(Fig.20) is interesting because two other outbursts observed in 2015 were in the im-mediate vicinityVincent et al.(2016). They were outburst #15 observed by NAVCAM on 2015-08-01T15:44 at latitude = -32◦, longitude = +227◦ and #23 observed by OSIRIS-NAC on 2015-08-28T13:36 at latitude = -31◦, longitude = +229◦.
The location of these outbursts is on the eastern slope of the body of 67P. It is in a region of a steep cliff to the east. The fact that the outburst started when this region just exited the shadow from the head suggests that thermal stress in the surface material may have triggered a landslide that exposed fresh (water) ice to direct solar illumination. Also other features of the observations support that idea: (1) the relative long duration of the GIADA dust impact phase which tells that the dust cone is very broad, (2) from looking at OSIRIS pictures, where one sees a cloud, not a narrow jet (3) from the fact that it is probably driven by water only. In this scenario the trigger of activity is thermal stress together with fracture mechanics and gravity in form of landslides or avalanches before solar heat can release gas from fresh ice which in turn accelerates dust released during this process.
At present, it is difficult to infer the nature of the icy material exposed to solar illumination. Recent simula-tions show that, in addition to sublimation of crystalline ice, clathrate destabilization and amorphous ice crystalliza-tion can lead to the formacrystalliza-tion of outbursts and pits with shapes consistent with those observed in the Seth region
(Mousis et al. 2015). A proof of these ideas would come from
the composition of the gas during this outburst. If the gas is lacking highly volatile species such as CO, N2 or Ar, it
would mean that the sublimating icy layer is close to the surface and was already partly devolatilized before, as shown by thermal evolution models (Mousis et al. 2015). Part of it could even be reprocessed water ice. In this case the outburst was not the ‘jet’ revealing fresh material from the interior, but just a surface effect. It may look completely different from the gas composition perspective than the outbursts last summer, where all volatiles except water peaked.
A further interesting feature of this outburst is that the gas production decreased much faster than expected from
at Bibliotheque Fac de Medecine on September 8, 2016
http://mnras.oxfordjournals.org/
Figure 20. Terrain maps of 67P. Outburst positions are marked by X (19 Feb. 2016 outburst) and by numbers (cf.Vincent et al.(2016)). Top: radius map showing the elevated head region in the centre and the body at the left (West) and right (East) fringes. Lower left: enlarged radius map showing the outburst position (x). The contour lines are separated by 50 m. Gray shading represent illuminated areas at 9:40 (dark gray), 9:50 (middle gray), and 10:00 (light gray). Lower right: topographic map in which the gray shading represents the local slope, accounting for gravity and centrifugal force (white=flat, black=vertical wall).
direct solar illumination. This may suggest that building up of a dust mantle quenched the gas emission. This outburst will trigger many further studies in the near future.
ACKNOWLEDGEMENTS
Rosetta is an ESA mission with contributions from its member states and NASA. Rosetta’s Philae lander is pro-vided by a consortium led by DLR, MPS, CNES and ASI. We thank all elements of the Rosetta project for the magnificent job they are doing to make this mis-sion an astounding success. The Alice team acknowledges
continuing support from NASA’s Jet Propulsion Labora-tory through contract 1336850. GIADA/Univ Parthenope NA/INAFOAC/IAA/INAF-IAPS: this research was sup-ported by the Italian Space Agency (ASI) within the ASI-INAF agreements I/032/05/0 and I/024/12/0. OSIRIS was built by a consortium of the Max-Planck- Institut f¨ur Son-nensystemforschung, G¨ottingen, Germany, CISAS Univer-sity of Padova, Italy, the Laboratoire d’Astrophysique de Marseille, France, the Instituto de Astrof`ısica de Andalu-cia, CSIC, Granada, Spain, the Research and Scientific Sup-port Department of the European Space Agency, Noord-wijk, The Netherlands, the Instituto Nacional de T´ecnica Aeroespacial, Madrid, Spain, the Universidad Polit´eechnica
at Bibliotheque Fac de Medecine on September 8, 2016
http://mnras.oxfordjournals.org/
de Madrid, Spain, the Department of Physics and Astron-omy of Uppsala University, Sweden, the UK(STFC), and the Institut f¨ur Datentechnik und Kommunikationsnetze der Technischen Universit¨at Braunschweig, Germany. The sup-port of the national funding agencies of Germany (DLR), France(CNES), Italy(ASI), Spain(MEC), Sweden(SNSB), and the ESA Technical Directorate is gratefully acknowl-edged. Work at LPC2E/CNRS was supported by CNES and by ANR under the financial agreement ANR-15-CE31-0009-01. Work on ROSINA COPS at the University of Bern was funded by the State of Bern, the Swiss National Science Foundation and by the European Space Agency PRODEX program. O.M.: this work has been partly carried out thanks to the support of the A*MIDEX project (no
ANR-11-IDEX-0001-02) funded by the “Investissements d’Avenir” French Government program, managed by the French National Re-search Agency (ANR). This work also benefited from the support of CNRS-INSU national program for planetology (PNP).
REFERENCES
A’Hearn M. F., Schleicher D. G., Millis R. L., Feldman P. D., Thompson D. T., 1984, AJ, 89, 579
Balsiger H., et al., 2007, SSRv, 128, 745
Bentley M. S., et al., 2016, Acta Astronautica, in press Bieler A., et al., 2015, A&A, 583, A7
Boehnhardt H. et al., 2016, MNRAS, this issue
Buemi M., Landi A., Procopio D., 2000, ESASP, 425, 279 Burch J. L., Goldstein R., Cravens T. E., Gibson W. C., Lundin
R. N., Pollock C. J., Winningham J. D., Young D. T., 2007, SSRv, 128, 697
Carr C., et al., 2007, SSRv, 128, 629 Colangeli L., et al., 2007, SSRv, 128, 803
Della Corte V. et al., 2014, J. Astron. Instrum., 03, 1350011 Della Corte V. et al., 2015, A&A, 583, A13
Della Corte V. et al., 2016, Acta Astronautica, 126, 205 Della Corte V. et al., 2016, MNRAS, this issue
Eriksson A. I., et al., 2007, SSRv, 128, 729 Feaga L. M., et al., 2015, A&A, 583, A27 Feldman P. D., et al., 2015, A&A, 583, A8
Ferrari M., Della Corte V., Rotundi A., Rietmeijer F.J.M.,2014, Planet. Space Sci., 101, 53
Fulle M. et al., 2015, ApJ Lett., 802, L12 Fulle M. et al., 2016, MNRAS, this issue Glassmeier K.-H., et al., 2007, SSRv, 128, 649
Glassmeier K.-H., Boehnhardt H., Koschny D., K¨uhrt E., Richter
I., 2007, SSRv, 128, 1
Gulkis S., et al., 2007, SSRv, 128, 561 Geiger B. et al., in prep
Geiger and Barthelemy, 2016, ROSETTA ORBITER NAVCAM EXT1-MTP026, RO-C-NAVCAM-2-EXT1-MTP026-V1.0
H¨assig M., et al., 2015, Sci, 347, aaa0276
Hofstadter M. et al., in prep Jehin E., et al., 2011, Msngr, 145, 2 Keller H. U., et al., 2007, SSRv, 128, 433 Marcus J. N., 2007, ICQ, 29, 39 Mousis O., et al., 2015, ApJ, 814, L5
M¨uller M, 1998, ESOC Report RO-ESC-TA-5501
Opitom C., Jehin E., Manfroid J., Hutsem´ekers D., Gillon M.,
Magain P., 2015, A&A, 584, A121 Rotundi A. et al., 2015, Science, 347, aaa3905 Riedler W., et al., 2007, SSRv, 128, 869
Schleicher D. G., Millis R. L., Birch P. V., 1998, Icar, 132, 397 Sierks H., et al., 2015, Sci, 347, aaa1044
Snodgrass C. et al., in prep
Stern S. A., et al., 2007, SSRv, 128, 507 Stern S. A., et al., 2015, Icar, 256, 117 Trotignon J. G., et al., 2007, SSRv, 128, 713 Vincent J.-B. et al., 2016, MNRAS, this issue Vincent J.-B., et al., 2016, A&A, 587, A14
This paper has been typeset from a TEX/LATEX file prepared by
the author.
at Bibliotheque Fac de Medecine on September 8, 2016
http://mnras.oxfordjournals.org/