1 INTRODUCTION
Anisotropy is an important factor determining the behaviour of clay soft rocks. Clay rocks, as most of the sedimentary rocks, exhibit anisotropy mainly related to their bedding plane orientation due to their depositional nature. The properties of such materials are usually independent of rotation about an axis of symmetry normal to the bedding plane. This type of anisotropy is called transverse isotropy or cross-anisotropy. In addition to the anisotropy of the reversible mechanical behaviour of soil, as observed for low levels of loading on highly overconsolidated materials, irreversible deformations are also affected by the direction of loading.
This work presents the development and the validation of a mechanical constitutive model that extends the symmetric Drucker-Prager yield criterion (Drucker and Prager, 1952) to cross-anisotropic materials and that is coupled with the classical cross-anisotropic elasticity (Lekhnitskii, 1977; Graham and Houslby, 1982). The new criterion assumes that the strength of materials may vary according to the orientation of the principal compressive stress with respect to the bedding plane orientation. This evolution of the strength as a function of the loading direction follows from experimental observations (e.g. Niandou et al. 1997) as already used for failure criteria of sedimentary rocks (e.g. Duveau et al., 1998; Pietruzciak and Mroz, 2001). In addition, the developed model allows a progressive hardening or softening process through the evolution of the mobilized cohesion and friction angle with an equivalent plastic strain (Barnichon, 1998).
The ability of the model to reproduce the directional dependency of the elasto-plastic response of clayey rocks, as observed in triaxial tests, is proved by the means of comparison between numerical predictions and experimental results on an homogeneous sample of
DEVELOPMENT OF AN EXTENDED DRUCKER-PRAGER HARDENING MODEL
FOR CROSS-ANISOTROPY OF SOFT ROCKS
B. François
Building, Architecture & Town Planning Department (BATir), Université Libre de Bruxelles, Belgium
F. Collin, A. Dizier
FRS-FNRS – Fonds National de la Recherche Scientifique, Bruxelles, Belgium ArGEnCo Department, Université de Liège, Belgium
R. Charlier
ArGEnCo Department, Université de Liège, Belgium
ABSTRACT: The mechanical behaviour of natural geomaterials is often anisotropic. Sedimentary rocks usually show a limited form of anisotropy, called cross-anisotropy. The behaviour is isotropic in the plane of bedding and the unique direction of anisotropy is perpendicular to bedding. This paper presents an original constitutive model based on a Drucker-Prager elasto-plastic framework that has been adapted to consider cross-anisotropic elasticity as well as an cross-anisotropic plastic criterion. The cohesion is a function of the angle between the direction of the major compressive stress and the normal to the bedding plane. The numerical simulations of two sets of experimental tests on Opalinus Clay and Boom Clay reveal the dependency of the direction of loading on the mechanical response of the material. So doing, this original model consists in a relatively simple upgrading of a well-known elasto-plastic model, well-adapted for sedimentary hard soils or soft rocks.
Opalinus Clay. Finally, the model, introduced in the LAGAMINE finite element code (Collin, 2003), is used to predict the hydro-mechanical behavior of non-conventional hollow cylinder tests on Boom Clay (You et al., 2010). In those tests, the hollow cylinders are submitted to mechanical unloading fairly similar to the evolution that would be encountered during gallery excavation. The results are compared with experimental measurements in term of radial displacements.
2 MECHANICAL CONSTITUTIVE MODEL
The elasto-plasticity principle (concept of a loading surface, f , in the stress space which
limits the region of elastic deformation) allows that the total strain rate, ij, be split into elastic, , and plastic, ije
p ij , components : e p ij ij ij
Because of elastic anisotropy, the elasto-plastic stress-strain relations are more convenient to be expressed in the anisotropic axis, as indicated by the star in exponent (ij
and ij ) * ij Cijkl kl (2)
where C is the elasto-plastic constitutive matrix. ijkl
In the more general situation, the reference axes do not coincide with the axes of anisotropy and the expression of ij
and ij
can be obtained from ij and expressed inij the system of reference through the following transformation:
;
ij R Rki lj kl ij R Rki lj kl
(3)
where Rij is the ij component of the rotation matrix:
cos cos sin cos sin
sin cos sin sin cos cos cos sin sin sin sin cos
sin sin cos sin cos sin sin cos sin cos cos cos
R (4)
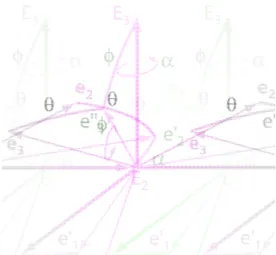
is the rotation angle around the axes E (rotation in the 3 ( ,E E plane), the angles 1 2) and defines the rotation around the axes e and 2 e , respectively (Figure 3). The positive1 direction of rotation is counter-clockwise.
E E E and 1, 2, 3
e e e are the reference axes1, ,2 3
and the anisotropic axes, respectively.At the end of each step of computation, the stress and strain obtained in the anisotropic axes (ij
and ij
) are re-transformed to be expressed in the global axes ( and ij ):ij ;
ij R Rik jl kl ij R Rik jl kl
Fig. 1. Transformation of the global axis E E E into anisotropic axes 1, 2, 3 e e e .1, ,2 3 2.1 Elastic anisotropy
*e ij
is the ij strain rate component that does not modify the hardening state of the material.
*e ij
is linked to stress rate through the Hooke law : *e e ij Dijkl kl
(6)
The D matrix considers anisotropic elasticity. The anisotropic elasticity needs aijkle maximum of 21 independent parameters to be fully described. However, axes of symmetry in the structure of many materials limit the number of independent parameters. Sedimentary rocks show usually a more limited form of anisotropy. The behaviour is isotropic in the plane of bedding and the unique direction of anisotropy is perpendicular to bedding. The properties of such materials are independent of rotation about an axis of symmetry normal to the bedding plane. This type of elastic anisotropy, called transverse isotropy or cross-anisotropy, requires 5 independent parameters (Lekhnitskii, 1977). The elastic compliance matrix is:
//// // // // //// // // // // // // // //// // // // 1 - -1 - -1 - -1 1 2 1 2 e ijkl E E E E E E E E E D E G G (7)
where the subscripts // and indicates, respectively, the direction parallel to bedding (directions 1 and 2) and perpendicular to bedding (direction 3). The symmetry of the stiffness matrix imposes that
// // // E E (8) 2.2 Plasticity
The limit between the elastic and the plastic domain is represented by a yield surface in the principal stress space. This surface corresponds to the Drucker-Prager yield surface f
(Drucker and Prager, 1952):
ˆ 3 0 tan c f II m I (9)
where c is the cohesion and m is a function of the friction angle :
2sin 3 3 sin m (10)I and IIˆ are the first stress tensor invariant and the second deviatoric stress tensor invariant, respectively: ii I (11) ˆ 1 ˆ ˆ ; ˆ 2 ij ij ij ij 3 ij I II (12) In Equation (9), the linear coefficient m between the first and the second stress invariant being independent of the third invariant (or alternatively, the Lode angle), the plastic surface is a cone in the principal stress space. The trace of this plasticity surface on the plane (deviatoric plane) is a circle (Figure 2).
The material cohesion depends on the angle between major principal stress and the normal to the bedding plane. Three cohesion values are defined, for major principal stress parallel (
1 0
), perpendicular (
1 90
) and with an angle of 45° (
1 45
) with respect to the
normal to bedding plane. Between those values, cohesion varies linearly with . The1
mathematical expression of the cohesion is as follows (Figure 3):
1 1 45 0 45 0 0 45 max ; 45 45 45 c c c c c c c (13)with being the angle between the normal to the bedding plane n and the major1
1 1 1 . arccos n n (14)
Fig. 2. Yield surface of the Drucker-Prager criterion in the deviatoric plane. Comparison with the Mohr-Coulomb yield surface.
Fig. 3. Schematic view of the cohesion evolution as a function of the angle between the normal to bedding plane and the direction of major principal stress.
A general non-associated plasticity framework is considered:
p ij ij g (15)
with the plastic potential g defined as:
ˆ 0 g II m I (16) with
2sin
3 3 sin m (17)where is the dilatancy angle.
0 ij ij f f df (18)
with being the hardening variable(s). The used model is a hardening Drucker-Prager model that allows hardening/softening processes during plastic flow. This is introduced via an hyperbolic variation of the friction angle and the cohesion between initial ( and 0 c0) and final ( and f cf ) values as a function of the Von Mises equivalent plastic strain eqp (Barnichon, 1998):
0
0 p f eq p p eq B (19)
0
0 p f eq p c eq c c c c B (20)where Bp and Bc are materials parameters and the Von Mises equivalent plastic strain p eq is obtained by integration of the Von Mises equivalent plastic strain rate :eqp
* * 0 2 ˆ ˆ 3 t p p p p p eq eqdt eq ij ij
; (21) Thus, the consistency condition (Equation 18) reads:0 p ij p p eq ij eq eq f f d f dc df d c d (22)
The Von Mises equivalent plastic strain can be expressed as a function of the plastic multiplier combining Equations (15) and (21), for the specific expression of the Drucker-Prager plastic potential (16):
2 1 3 3 3 3 p eq ij ij kk ll g g g g (23)
Combining together the elastic relation (6) and the expression of plastic strain rate (15) gives: ij ijkl kl kl g C (24)
where Cijkl is the stiffness matrix (CD1). That allows us to determine the plastic multiplier :
3 3 e ijkl kl ij e mnop p p mn eq eq f C f f d f dc C d c d (25) 3 CONSTITUTIVE BEHAVIOUR
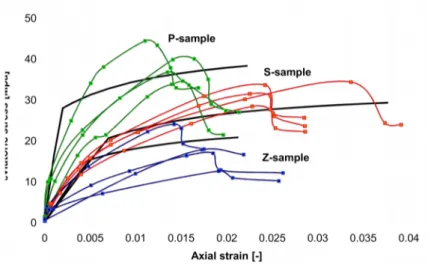
Laloui and François (2008) compile a series of triaxial tests on Opalinus Clay at various confining pressure. They clearly underlines that the mechanical response of the clay is highly affected by the direction of loading with respect to the bedding plane. Three different directions of loading have been considered: bedding planes parallel (P-Sample), perpendicular (S-Sample) and with an inclination of 45°C (Z-Sample) with respect to the loading direction. The numerical simulation of the test at a confining pressure of 15 MPa has been performed. It can be observed that the elastic stiffness and the shear strength are clearly affected by the direction of loading with respect to the bedding plane. The elastic rigidity of the Z-sample is included between the rigidity of P- and S- samples which is characteristics of cross-anisotropic behaviour. The shear strength is the maximum for samples loaded in the direction of bedding (P-sample) while the minimum strength is observed for Z-sample (for loading direction at 45° to the bedding plane orientation). The comparison between experimental results and numerical simulations is made in Figure 4. The mechanical parameters allowing the best matching between numerical simulations and experimental results are reported in Table 1. In spite of some discrepancies in the experimental results (probably due to the heterogeneity of the Opalinus Clay), the model is able to reproduce the strong elastic and plastic anisotropy of the material.
Table 1. Geomechanical characteristics of Opalinus Clay and Boom Clay, used in the numerical simulations
Geomechanical characteristics Opalinus Clay Boom Clay
Young elastic modulus [GPa] E// 16 400
Young elastic modulus [GPa] E 3 200
Poisson ratio [-] υ//// 0.27 0.125
[-] υ// 0.27 0.125
Initial cohesion [kPa] cc0,45°0,0°
c0,90° 4200 (0°) 700 (45°) 7000 (90°) 255 (0°) 240 (45°) 330 (90°) Final cohesion [kPa] ccf,45°f,0°
cf,90° 6000 (0°) 3000 (45°) 10000 (90°) 85 (0°) 80 (45°) 110 (90°) Softening parameter [-] Bc 0.01 0.01
Initial friction angle [°] øc0 14 5
Final friction angle [°] øcf 20 18
Hardening parameter [-] B 0.01 0.01
Fig. 4. Comparison between numerical simulations and experimental results of triaxial compression tests with a confining pressure of 15 MPa and three different orientation of bedding with respect to axial loading.
4 SIMULATION OF A HOLLOW CYLINDER TEST
You et al. (2010) designed non-conventional hollow cylinder tests on Boom Clay. It consists in hollow cylinder samples which are submitted to mechanical loadings fairly similar to the evolution of clays around a gallery excavation. The first results obtained by You et al. (2010) clearly reveal the significant anisotropic response of Boom Clay. The experimental measurements of the central hole displacement show a clear directional dependency. The initial circular hole is transformed into an oval hole after the mechanical unloading (Figure 4). The displacements in the direction parallel to bedding is much than twice larger than the displacement perpendicularly to bedding. Consequently, the measured radial displacements have been analysed in three particular directions: in the bedding direction ( ), with an0 angle of 45° ( ) with respect to the bedding plane and perpendicular to bedding plane (45
90 ).
Fig. 4. Experimental measurements of the central hole displacement at the end of the mechanical unloading and pore water pressure dissipation. The measurements in the entire section (a) are reported in the quarter of the
section (b) by considering the symmetry of the problem.
The objective of this simulation is to reproduce the behaviour of the material in the mid-plane section of the hollow cylinder, assuming mid-plane strain conditions in the axial direction. The mechanical cross-anisotropy being considered, a directional dependency of the
encountered behaviour is expected. Consequently, the problem is not axisymmetric and it must be addressed through a two-dimensional plane strain mesh. The internal and external radii of the hollow cylinder are 7 mm and 43 mm, respectively. The clay sample is considered as homogeneous and to be fully saturated. The considered initial conditions consist in an isotropic total stress field of 4.5 MPa and a pore water pressure of 2.2 MPa. The unloading is performed by decreasing the internal mechanical stress down to 1.0 MPa and the pore water pressure down to 0.6 MPa in 70 minutes. The simulations have been performed until reaching a hydro-mechanical steady-state that has been obtained after 45000 s (12 hours 30 minutes). The results are presented at the end of the simulation.
The boundary value problem has been addressed through the finite element method with the LAGAMINE code (Collin et al., 2002) in which the developed constitutive model has been implemented. The use of the mechanical constitutive models requires the calibration of material parameters in agreement with the hydro-mechanical behaviour of the Boom Clay. The parameters of the anisotropic Drucker-Prager model are presented in Table 1. The water permeability has been assumed isotropic with k = 4. 10-12 m/s.
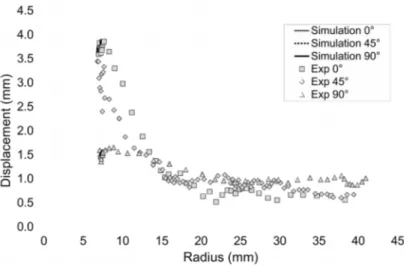
The results of numerical simulations are compared with experimental results in terms of the central hole displacement as a function of the orientation with respect to bedding plane (Figure 5) and the radial profile of radial displacements in three different directions (Figure 6). The developed anisotropic model allows us to reproduce the magnitude of radial displacements as measured experimentally, including its directional dependency. The larger displacements are obtained in the direction parallel to bedding. The major principal stress being circumferential, c 0 corresponds to the cohesion in the direction for which the circumferential stress is parallel to the normal to the bedding plane, i.e. in the direction of bedding ( = 0°). This direction is weaker than the perpendicular direction ( = 90°), governed by c 90 . So, the plastic strain is larger for = 0°, inducing larger radial displacements for = 0° than for = 90°. As experimentally observed, the central hole displacement is almost constant between = 0° and = 30° (at a value around 3.6 mm). Then, the predicted displacements decrease to 3 mm for = 90° while the experimental measurements are around 2 mm. This discrepancy between the experimental and numerical results is only concentrated in the last 3 mm of the radial profile (Figure 12, “exp 90°” and “simulation 90°”). Also, the radial displacement profiles shows a small discrepancy in the obtained displacements in the outer zone for = 0° (Figure 12) for which experimental displacements are larger than the modelling results.
Fig. 5. Central hole displacement as a function of the orientation with respect to bedding plane. Comparison between experimental and numerical results.
Fig. 6. Radial profile of radial displacements. Comparison between experimental measurements in three different directions and numerical results.
5 CONCLUSIONS
In many applications the anisotropic character of the natural hard soil or soft rock must be carefully considered. In particular, a gallery excavation in sedimentary rocks produces a non-axisymmetric response of the rock mass due to the cross-anisotropic behaviour of the soil. The displacements of the gallery walls are usually larger in the direction of bedding. So, the circular excavated cavity deforms into an oval shape. In such case, classical isotropic elasto-plastic models fail to reproduce properly the observed deformations of the soil and the use of an anisotropic model is required.
Consequently, in addition to cross-anisotropic elasticity the Drucker-Prager plastic criterion has been upgraded considering that the cohesion depends on the angle between the direction of the major compressive stress and the normal to the bedding plane. It is generally observed that the cohesion is the maximum when the major compression stress is in the direction of the bedding plane (i.e., perpendicular to the normal to the bedding plane,
1 90
) while the minimum cohesion is observed for
1
around 45°.
This model has been used for the simulation of a non-conventional hollow cylinder test that reproduces a gallery excavation, at small scale. It has been shown that the model is able to catch the anisotropic response of the rock mass. This original model consists in a relatively simple upgrading of the Drucker-Prager elasto-plastic model, well-adapted for sedimentary hard soils or soft rocks.
ACKNOWLEDGEMENT
The authors would like to acknowledge Dr. Vincent Labiouse from the Rock Mechanics Laboratory of EPFL (Lausanne, Switzerland) for providing the experimental results of the hollow cylinder tests.
REFERENCES
Barnichon J.D. (1998). Finite element modelling in structural and petroleum geology. PhD Thesis, Université de Liège
Collin F. (2003). Couplages thermo-hydro-mécaniques dans les sols et les roches tendres partiellement saturés, PhD Thesis, Université de Liège.
Collin F., Li X.L., Radu J.P., Charlier R. (2002). Thermo-hydro-mechanical coupling in clay barriers. Engineering Geology, Vol. 64, 179-193.
Drucker D.C., Prager W. (1952). Solid mechanics and plastic analysis for limit design. Quarterly of Applied Mathematics, Vol. 10(2), 157-165.
Duveau G., Shao J.F. and Henry J.P. (1998). Assessment of some failure criteria for strongly anisotropic geomaterials. Mechanics of cohesive-frictional materials, Vol. 3, 1-26.
Graham J., Houlsby G.T. (1982) Anisotropic elasticity of a natural clay. Géotechnique, Vol. 33(2), 165-180.
Laloui L., François B. (2008). Benchmark on constitutive modelling of the mechanical behaviour of Opalinus clay – Focus on the material anisotropy. Internal report. Ecole Polytechnique Fédérale de Lausanne.
Lekhnitskii S.G. (1977). Theory of elasticity of an anisotropic elastic body. 2nd Edition, Moscow, MIR Publishers.
Niandou H., Shao J.F., Henry J.P., Fourmaintraux D. (1997). Laboratory investigations of the mechanical behaviour of Tournemire shale, Int. J. Rock Mech. Min. Sci., Vol. 34, 3-16. Pietruszczak S. and Mroz Z. (2001). On failure criteria for anisotropic cohesive-frictional
materials. Int. J. Numer. Anal. Meth. Geomech. Vol. 25, 509-524
You S., Labiouse V., Vigne L., Gastaldo L., Bernasconi M. (2010). Medium resolution X-Ray computed tomography of hollow cylindrical samples of Boom Clay. EUROCK 2010. Rock Mechanics in Civil and Environmental Engineering: 755-758.