Contrib Mineral Petrol (1985) 90:214-225
Mineralogy and
Petrology
9 Springer-Verlag 1985
Petrogenesis of monzonoritic dykes
in the Egersund-Ogna anorthosite (Rogaland, S.W. Norway):
trace elements and isotopic (St, Pb) constraints
J.C. Duchesne 1, I. Roelandts 1, D. D e m a i f f e 2, and D. Weis 2 *
t Laboratoires associ6s de G6ologie, P6trologie, G6ochimie, Universit6 de Liege, B-4000 Sart Tilman, Belgium
2 Laboratoires associ6s de G6ologie-P6trologie-G6ochronologie, Universit6 Libre de Bruxelles, 50, avenue Fr. Roosevelt, B-1050 Bruxelles, Belgium
Abstract. Two major monzonoritic dykes occur in the Eger- sund-Ogna anorthositic massif (S.W. Norway): the Lom- land dyke, which varies from norite to monzonite, and the Vettaland ferronoritic dyke. They are characterized by high Fe, Ti and P contents, low SiO2, variable K 2 0 (0.5%~4.5%) and high Fe/Mg ratios. Small variations in REE distribution are observed inside the Lomland dyke [ L a / Y b = 1 2 ; L R E E ca. 150-180 (chondrite-normalized values), neutral to slightly positive Eu anomaly]. Part of the Vettaland dyke is severely depleted in Zr, Rb and REE and shows a positive Eu anomaly. All rocks are depleted in U and Th, and show very low Cr and Ni contents, as well as high Sr contents (40~600 ppm).
Variation within the Lomland dyke is satisfactorily ex- plained through subtraction of an apatite-bearing noritic cumulate. The role of apatite is predominant in controlling the R E E behaviour. Eutectic partial melting of a Fe-rich noritic cumulate (containing apatite) under low p H / O con- ditions is suggested for the Vettaland dyke by REE model- ling.
Sr isotopic initial ratios are different in Lomland (ca. 0.708) and Vettaland (ca. 0.706) dykes. These values pre- clude direct derivation from the mantle as well as comag- matic relationship with anorthosite. Contamination of a mantle derived m a g m a by deep crustal material or anatexis of the L I L depleted lower crust is compatible with the low U and Th contents, and with the Pb isotopic ratios. The Vettaland partial melting process is extended to all monzon- oritic types, the necessary heat being provided by the high temperature anorthositic crystal mush.
Introduction
Monzonoritic a rocks form dykes and small intrusions in massif-type anorthosites (Emslie 1978). Though much smaller in volume than the associated acidic rocks, they are ubiquitous in all anorthositic provinces. They frequently intrude the contact between anorthositic massifs and their a Monzonorite stands for hypersthene monzogabbro/monzodior- ite, or jotunite. It is extended here to ferrodiorite, ferronorite and to quartz-bearing varieties
* Charg6 de Recherches du F.N.R.S (Belgium) Offprint requests to: J.C. Duchesne
envelope of metamorphic gneisses. They belong to the an- orthosite-quartz mangerite (charnockite) suite of rocks.
Various hypotheses have been proposed for the genesis of monzonoritic rocks. They have been interpreted as comagmatic with the anorthosites (Buddington 1972; Ash- wal 1982; Wiebe 1984). Whatever the composition of the parental magma, plagioclase fractionation tends to enrich the liquid in, for example Fe, Ti and P. The overall similari- ty of monzonorites with Skaergaard ferrodiorites (Wager and Brown 1968) is in agreement with this hypothesis.
F o r Michot (1960, 1965) and Philpotts (1966), the con- sanguinity between monzonorites and anorthosites is ex- tended to the whole anorthosite suite. The monzonorites were thought to represent liquids of intermediate composi- tion in a continuous evolution by fractional crystallization from anorthosites to quartz mangerites.
Discovery in the Hidra body (S.W. Norway) of a con- tact facies (Duchesne et al. 1974) of monzonoritic composi- tion showing no Eu anomaly has, however, questioned the residual character of the monzonorites. Indeed, a magmatic liquid left after fractionation and subtraction of an impor- tant quantity of plagioclase should display a significant neg- ative Eu anomaly, as well as a Sr depletion. The absence of Eu anomaly and the high Sr content of monzonorite (400-600 ppm) thus preclude a residual character for this rock.
These geochemical studies gave rise to two contrasting views on the status of monzonorites in anorthositic mag- matism. On the one hand, Duchesne and Demaiffe (1978) suggested monzonoritic liquid was the parental magma of the andesine anorthosites. Trace element modelling of the Bjerkreim-Sokndal sequence of rocks (Duchesne 1978; Roelandts and Duchesne 1979) and of the Hidra body (De- maiffe and Hertogen 1981) gave results compatible with this hypothesis. On the other hand, Emslie (1978) consid- ered that monzonorites (ferrodiorites) represent late-stage products of olivine- and orthopyroxene-fractionation from a tholeiitic magma in a sub-crustal chamber before intru- sion in the anorthosite massifs. Emslie admits some decou- pling between the production of anorthosites and that of monzonorites. Another interpretation has been made by Philpotts (1981), who considered that monzonoritic liquids could have been produced by immiscibility and were conju- gate to quartz mangeritic liquids.
The purpose of the present study is to provide additional data on monzonorites occurring in the Egersund province,
V a e r s l a n d
S
V e t t a l a n dgers~u nd Ogn
H e t l a n d ( V a r b e r g v 5 4 ~> ~ H~landBjerkreim- Sokndal
?
f L ' /
17\ .-13 12 Puntervold / - "nd-Helleren
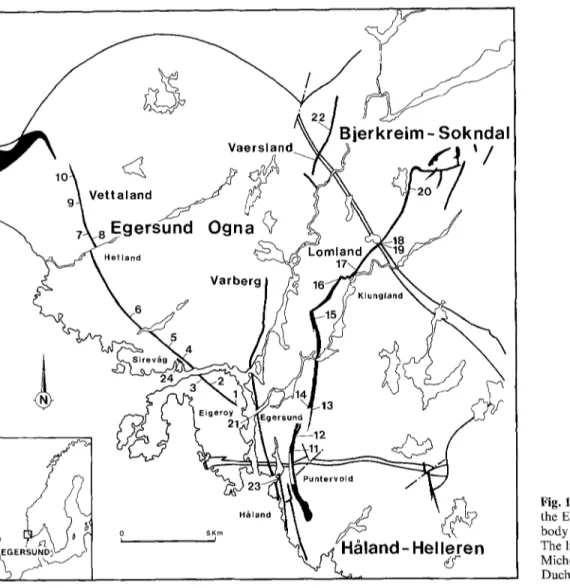
Fig. 1. The monzonoritic dykes in the Egersund-Ogna anorthositic body (with sampling localities). The limits of the massifs are from Michot (1960) and Maquil and Duchesne (1984)
and to see w h a t light these d a t a can t h r o w on the petrogene- sis o f these rocks.
Geological framework and petrography
M o n z o n o r i t i c rocks occur in n u m e r o u s dykes and small intrusions in the R o g a l a n d anorthositic province (S.W. N o r w a y ) ( M i c h o t a n d M i c h o t 1969; Duchesne et al. 1984). They were emplaced a r o u n d 950 M a (Pasteels et al. 1979), n e a r the end o f the igneous event and clearly intrude after the granulite facies regional m e t a m o r p h i s m (Weis a n d De- maiffe 1983b; Demaiffe a n d M i c h o t 1985).
Several m o n z o n o r i t i c dykes (Fig. 1), which cut across the E g e r s u n d - O g n a massif-type a n o r t h o s i t e a n d its neigh- b o u r i n g massifs - the Hgdand m a s s i f and the Bjerkreim- S o k n d a l l o p o l i t h - are studied here with special attention to the V e t t a l a n d (samples 1 10) and the L o m l a n d (samples 11-20) dykes ( M i c h o t 1960), which extend over m o r e t h a n 20 k m a n d have an average thickness o f several tens o f metres. The V a r b e r g (no. 21), V a e r s l a n d (no. 22), H ~ l a n d (no. 23) and Sirevgtg (no. 24) dykes were also sampled. The Lomland dyke. This major dyke shows a continuous variation from an antiperthitic norite (Puntervold facies) in the south to a monzonorite/monzonite (Klungland facies) in the north. The
antiperthitic norites are massive medium-grained rocks (5-10 mm) of subophitic texture (samples 11-14). Plagioclase is euhedral, tabu- lar (An4o , slightly zoned) and contains antiperthite blebs. Large poikilitic crystals (up to 1 cm) of inverted pigeonite develop be- tween the plagioclases. Homogeneous ilmenite and Ti-poor magne- tite fill the interstices between all minerals. Apatite is relatively abundant.
The monzonorites and monzonites (samples 16-20) are charac- terized by tabular mesoperthite-mantled plagioclase in a mesostasis (500 gm) of plagioclase and micro- to mesoperthitic K-feldspar in subequal amounts, variable amounts of quartz, large poikilitic inverted pigeonite, clinopyroxene, apatite, zircon and oxide miner- als (homogeneous ilmenite and Ti-magnetite). A continuous grada- tion exists between the Puntervold and the Klungland facies through increase in K-feldspar and quartz contents and the devel- opment of the mesostasis.
The Vettaland dyke. This differs from the Lomland dyke by its texture and composition. In its southern part (Eiger6y facies) (sam- ples I 6), the rock is an antiperthitic norite with or without quartz. The texture is equigranular, composed of a regular mosaic of an- hedral antiperthitic plagioclase, quartz, inverted pigeonite, subordi- nate clinopyroxene, homogeneous ilmenite, Ti-magnetite and traces of pyrrhotite. From Hellvik to the North (Hetland facies), the rock (samples 7--10) contains some antiperthitic plagioclase slightly coarser than the average mosaic. This feature neither modi- fies the major element composition of the rock, which is remark- ably constant in the whole dyke (see below), nor increases the Sr content relative to the Eiger6y facies.
T a b l e 1. M a j o r and some trace element composition
Vettaland Lomland
m e a n s P" 15 K b
n = 10 7553
Var b Vaers Hald Sirev
21 22 23 24 7520 66192 7548 75542 SiO z 49.9 2.75 43.88 47.29 51.60 46.33 55.82 58.78 52.02 TiO 2 2.7 0.35 4.45 3.56 2.41 3.62 2.24 2.19 2.14 AlzO 3 13.1 0.71 12.89 13.34 14.65 12.68 13.39 13.52 15.04 F%O3 4.1 0.47 5.13 4.08 4.90 4.84 3.27 3.43 4.38 FeO 14.7 1.56 13.20 12.62 8.87 13.45 9.70 7.41 9.64 M n O 0.27 0.03 0.26 0.27 0.19 0.25 0.19 0.17 0.23 MgO 2.40 0.39 3.94 3.58 2.26 3.27 1.96 1.97 2.14 CaO 7.5 0.76 8.76 7.65 6.21 7.63 5.20 4.88 6.21 N a 2 0 2.9 0.18 3.26 3.59 3.96 3.33 3.24 3.72 4.05 K 2 0 0.78 0.23 1.02 1.76 3.00 1.76 3.60 3.11 2.69 P 2 0 5 1.66 0.33 2.99 2.18 1.44 2.47 1.30 1.11 1.01 Total 100.01 99.77 99.92 99.49 99.62 99.91 100.29 99.55 N o r m a t i v e composition (wt %) Or 4.6 1.3 6.0 10.4 17.8 10.4 21.3 18.3 14.9 A b 24.3 1.4 27.6 30.4 33.6 28.2 27.4 31.3 34.1 A n 20.5 1.6 17.5 15.1 13.4 14.5 11.3 10.9 12.0 Q 7.2 3.5 - - 2.1 0.3 8.6 12.7 0.1 Cpx 6.1 0.7 7.1 8.5 7.6 7.6 5.8 5.6 9.7 Opx 22.5 3.0 18.7 15.6 10.5 19.6 13.7 9.5 16.3 O 1 - - 0.6 2.6 . . . . . M t 5.9 0.7 7.5 5.9 7.1 7.0 4.7 5.0 6.4 I1 5.1 0.7 8.5 6.8 4.6 6.9 4.3 4.1 4.1 Ap 3.6 0.7 6.5 4.8 3.2 5.4 2.8 2.4 2.2 Trace elements (ppm) E o H d Ba 485 699 720 1,451 1,800 1,064" 1,403" 1,747" 1,613" R b < 3 * * 5 5.3** 9.7 22 13.9 40 23.5 42 Sr 592 532 458** 417 393 406 294 335 347 Z r 30 1,185 55 89 572 215 867 770 1,591 Y 34 85 51 51 52 69 53 44 144 La < 15 45 40 37 44 58.7" 45" 47.2" 102" Ce 32 131 112 98 103 149" 112" 110" 254* N d 27 91 72 68 67 88" 66" 67.6" 161 * Co 36 35 46 38 27 37* 21 * 21 * 21 * V 67 50 160 110 73 151 58 75 66 Z n 217 217 202 221 186 225 158 155 221 Ni < 1 0 < 1 0 < 1 0 < 1 0 < 1 0 < 1 0 < 1 0 < 1 0 < 1 0
* Determination by N A A (see Table 2) ** Determinations by isotope dilution
All other determinations by X R F (G. Bologne, analyst)
" P: Puntervold facies - average of samples 11-14 (66175; 7536; 7533 ; 7534) b K: Klungland facies - average of samples 16-20 (7552; 72105; 7559; 7365; 8147) c E: Eiger6y facies - average of analyses 1-6 (7613; 7611; 76123; 7555; 7557; 7522) a H : Hetland f a c i e s - average of analyses 7-10 (7527; 75281; 75301; 7529)
The Varberg dyke is petrographically homogeneous : it is a mon- zonorite (sample 21) texturally similar to the Puntervold facies, but with more microperthitic feldspar. The Vaersland dyke (sample 22) is a quartz monzonite, petrographically homogeneous along strike. A particular facies has been sampled in the Hgffand dyke,
south o f Egersund (sample 23). It is a fine-grained quartz m o n z o n - ite showing a granular texture (0.7 ram). Sample 24 (Sirevdlg) is a fine-grained granular monzonoritc from a thin dyke (1.5 m), which crops out not far from the Vettaland dyke, but with a clearly different chemical composition.
G e o c h e m i c a l d a t a T a b l e s 1 a n d 2 give t h e m a j o r a n d t r a c e e l e m e n t c o m p o s i - t i o n s ( t h e m e t h o d s a r e d e s c r i b e d i n A p p e n d i x 2). T h e s a m - ples f r o m t h e v a r i o u s p e t r o g r a p h i c f a c i e s a r e a v e r a g e d i n T a b l e 1. D e t a i l e d a n a l y s e s - w h i c h c a n b e o b t a i n e d f r o m t h e a u t h o r s - w e r e u s e d t o p l o t F i g s . 2 - 5 . R e s u l t s o f N A A o n s e l e c t e d s a m p l e s a r e r e p o r t e d i n T a b l e 2 a n d Fig. 5. T h e f o l l o w i n g c h e m i c a l c h a r a c t e r i s t i c s a r e o b s e r v e d f o r
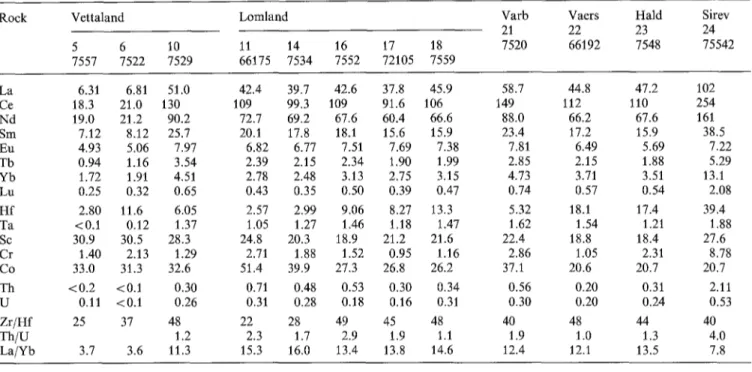
Table 2. REE and other trace element composition (ppm)
Rock Vettaland Lomland
5 6 10 11 14 16 17 18
7557 7 5 2 2 7529 66175 7 5 3 4 7 5 5 2 72105 7559
Varb Vaers Hald Sirev
21 22 23 24 7520 66192 7548 75542 La 6.31 6.81 51.0 42.4 39.7 42.6 37.8 45.9 Ce 18.3 21.0 130 109 99.3 109 91.6 106 N d 19.0 21.2 90.2 72.7 69.2 67.6 60.4 66.6 Sm 7.12 8.12 25.7 20.1 17.8 18.1 15.6 15.9 Eu 4.93 5.06 7.97 6.82 6.77 7.51 7.69 7.38 Tb 0.94 1.16 3.54 2.39 2.15 2.34 1.90 1.99 Yb 1.72 1.91 4.51 2.78 2.48 3.13 2.75 3.15 Lu 0.25 0.32 0.65 0.43 0.35 0.50 0.39 0.47 H f 2.80 11.6 6.05 2.57 2.99 9.06 8.27 13.3 Ta <0.1 0.12 1.37 1.05 1.27 1.46 1.18 1.47 Sc 30.9 30.5 28.3 24.8 20.3 18.9 21.2 21.6 Cr 1.40 2.13 1.29 2.71 1.88 1.52 0.95 1.16 Co 33.0 31.3 32.6 51.4 39.9 27.3 26.8 26.2 Th < 0 . 2 <0.1 0.30 0.71 0.48 0.53 0.30 0.34 U 0.11 <0.1 0.26 0.31 0.28 0.18 0.16 0.31 Z r / H f 25 37 48 22 28 49 45 48 T h / U 1.2 2.3 1.7 2.9 1.9 1.1 L a / Y b 3.7 3.6 11.3 15.3 16.0 13.4 13.8 14.6 58.7 44.8 47.2 102 149 112 110 254 88.0 66.2 67.6 161 23.4 17.2 15.9 38.5 7,81 6.49 5.69 7.22 2.85 2.15 1.88 5.29 4.73 3.71 3.51 13.1 0.74 0.57 0.54 2,08 5.32 18.1 17.4 39,4 1.62 1.54 1.21 1,88 22.4 18.8 18.4 27,6 2.86 1.05 2.31 8.78 37.1 20.6 20.7 20.7 0.56 0.20 0.31 2.11 0.30 0.20 0.24 0.53 4O 48 44 4O 1.9 1.0 1.3 4.0 12.4 12.1 13.5 7.8
F*
F*
+ 2 + 4 040
:
/
\,o/
\.o
S '"':,
40
40
Fig. 2. N a 2 0 + K2O (A) - FeO* (F) - MgO (M) diagram. Legend: 1. Vettaland dyke; 2. Lomland dyke; 3. Varberg dyke; 4. Vaersland dyke; 5. Hfiland dyke; 6. Sirevgtg dykelet; 7. evolution of the Skaer- gaard liquids (after Wager and Brown 1968); 8. evolution in the Lomland dyke
major elements: low SiO 2 contents (43-54%), high total Fe (11-20% FeO*), high TiO 2 (2-5%), high P205 (1-3.4%), KzO between 0.5 and 4.5%, together with nearly constant and moderate A120 3 (12-15%), low MgO (2 4%), high CaO (5 9%). The F e O * / M g O + F e O * ratios (Fig, 2) range from 0.80 to 0.90; K 2 0 is less than N a 2 0 ; the norm indicates compositions near the limit of SiO 2 saturation. The Peacock index divides the rocks into two different groups: (1) the Vettaland dyke, situated at the limit between calc-alkaline and alkali-calcic suites; (2) the other dykes, which form a suite intermediate between alkaline and alkali- calcic suites.
The Vettaland samples have higher FeO*/MgO ratios than the Lomland samples (Fig. 2). Moreover, the Vetta- land rocks are clustered in the A F M diagram while the Lomland dyke shows a trend of alkali enrichment accompa- nied by a slight FeO*/MgO increase when passing from the Puntervold to the Klungland facies. The other dykes roughly follow the Lomland linear trend. Plots of oxides against SiO2, as exemplified by Fig. 3, also demonstrate the small variations in the Vettaland dyke, in contrast with the other dykes.
In the triangular diagram proposed by Philpotts (1981), monzonorites and (quartz) monzonites define a curve which might be interpreted as the boundary of an immiscibility field (Fig. 4). But because the Vettaland compositions plot inside this field, we believe that immiscibility does not play a significant role in the differentiation. The curve is the projection of the liquid line of descent in a process of frac- tional crystallization, which is demonstrated below.
Pertinent geochemical features of the trace element dis- tribution are the following:
1. K / R b values are high (1000-1400) in the monzonorites, and moderately high (600-800) in the monzonites and quartz monzonites (Vaersland). In the Vettaland dyke, the Eiger6y facies shows extreme values (5000). Sr is high in the Vettaland dyke (530-590 ppm); it slightly decreases from 460 to 390 p p m with increasing SiO 2 in the Lomland dyke. The K/Ba ratio appears rather constant in monzonor- ites (12-13) and increases slightly in monzonites and quartz- rich varieties (up to 21).
2. The Z r / H f ratio shows its widest variation in the Lom- land dyke (26-47). The Zr variation is the most significant in the Vettaland dyke where the Itetland facies is very rich (up to 1,400 ppm) while the Eiger6y facies is strongly de- pleted in Zr.
3. Most samples show chondrite-normalized values between 120 and 180 for the light REE (Fig. 5) and [La/Yb]N ratios
8" 6 i = 4 6 84 5 84 4. 0 .,~3. 2 . 1" 0 § + + + x + 9 a ~o 4:~ 4'8 5'2 ;6 8'o SiO 2 + C + + e 4-x ++ + + $ [ I go 4'4 47 ~2 ~6 io SiO 2 6 " ~4" 0 3- 2 - 1" 0 ' 31 27 0 2 3 - 1 9 15 11 "& + + + • + gO '44 4'8 5'2 SiO 2
+++
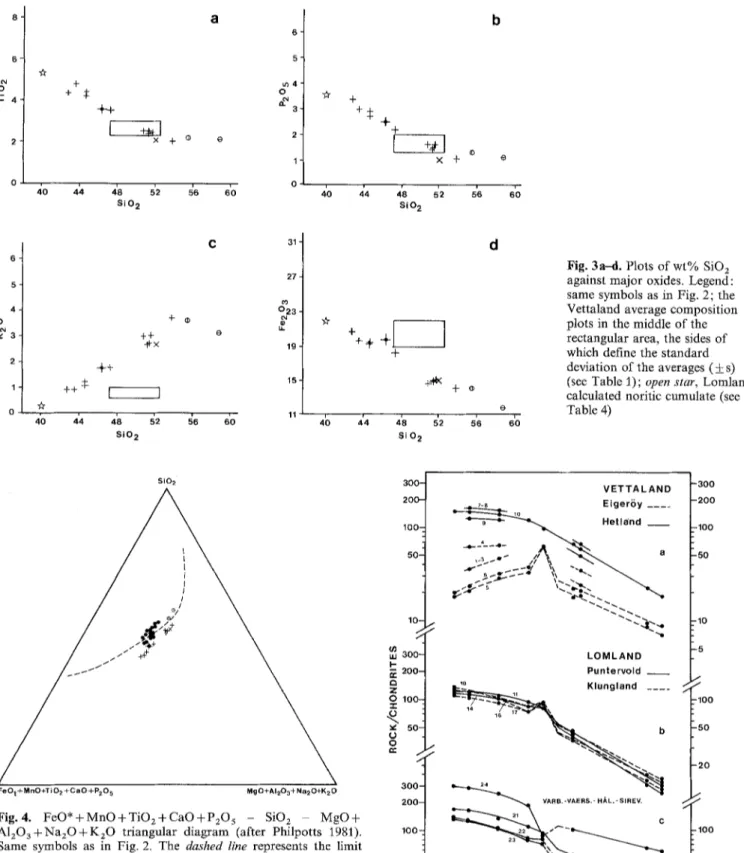
+ + +,1~ + 4(3 4'4 4'8 5'2 Si 0 2 <D s'6 e 6'0 d | o 5'6 6'0Fig. 3a-d. Plots of wt% S i O 2
against major oxides. Legend: same symbols as in Fig. 2; the Vettaland average composition plots in the middle of the rectangular area, the sides of which define the standard deviation of the averages (_+ s) (see Table 1); open star, Lomland calculated noritic cumulate (see Table 4)
Si02
Fe Ot +M nO+Ti O2 +Ca O +P205 MgO+AI203+ Na20+K20
Fig. 4. F e O * + M n O + T i O z + C a O + P 2 0 5 - SiO 2 MgO+ A120 a 4- Na20 4- K20 triangular diagram (after Philpotts 1981). Same symbols as in Fig. 2, The dashed line represents the limit of the immiscibility field according to Philpotts
nearly c o n s t a n t (7 • except in the Eiger6y facies; the R E E distributions usually display n o E u a n o m a l y or a posi- tive one; there is however a negative Eu a n o m a l y in the most R E E - r i c h samples (Sirev~g); a very peculiar R E E dis- t r i b u t i o n appears in the Eiger6y facies: low contents of the light a n d heavy REE, with enrichment in intermediate R E E a n d a positive Eu anomaly. 3 0 0 - V E T T A L A N D - 3 0 0 200- 7-s ~o E i g e r ~ y . . . . - 2 0 0 100- H e t l a n d - 1 0 0 - - - - ' - - ' - A ~-~'~. ~ . ~ - : : / ), -... L5 L O M L A N D Punte rvold '~ K l u n g l a n d . . . . 14 1 ~ -100 b -50 11 " ~ .20 3 0 0 200- VARB.-VAERS.- N~L.-smev. ~ ~ 21 C 1 0 0 - 22 - ~ - 1 0 0 23 5 0 "50 2 0 " .20 , , , . . . . , , L a C e N Sm Eu T b Y Y Lu
Fig. 5a-c. Chondrite-normalized REE distribution in the various occurrences (see Table 2). Note that in the Vettaland dyke, the yttrium values, normalized in order to fit the REE distribution, are also considered. Samples 1-4 were only analysed for Ce, Nd and Y by XRF (see Table 1). They give a good approximation of the REE distribution
10. ~ 3 0 0 - I..." ~. 200- e~ Z O 100- 502 O /
4. As for the transition elements, N i a n d Cr are very low (1-3 p p m a n d < 1 0 p p m respectively); Sc (18-30 p p m ) in- creases slightly with the mafic content; Co and Zn show small variations, while V significantly decreases with in- crease in SiO z. N o significant differences can be observed between the two V e t t a l a n d facies.
5. Th and U contents are very depleted, usually less t h a n 0.5 p p m U and less t h a n 1 p p m Th (except Sirev~g, with 2.1 p p m Th).
Role of apatite in the R E E budget
The P205 contents a n d consequently the n o r m a t i v e apatite content o f the m o n z o n o r i t e s are usually high (see Table 1). As apatite is usually rich in R E E ( W a t s o n and G r e e n 1981), it is interesting to examine the c o n t r i b u t i o n o f the apatite to the w h o l e - r o c k R E E budget. A p a t i t e s have therefore been s e p a r a t e d f r o m selected rocks and analysed for La. The results are r e p o r t e d in Table 3, together with d a t a from Tables 1 and 2.
In the L o m l a n d dyke the L a content o f the apatite is inversely c o r r e l a t e d with the a m o u n t s o f n o r m a t i v e apatite, so t h a t the c o n t r i b u t i o n o f the a p a t i t e to the L a whole-rock content is virtually c o n s t a n t and equal to 60% 65%. This c o n s t a n c y suggests t h a t the rocks simply result from the crystallization o f m a g m a t i c liquids without any modifica- tion o f the a p a t i t e p r o p o r t i o n s by cumulative processes or by s e p a r a t i o n o f immiscible P - T i - F e - r i c h liquids in the course o f crystallization. A p a t i t e therefore a p p e a r s n o t to be a cumulate phase in the L o m l a n d dyke.
The Lomland dyke: evidence for fractional crystallization process
Major elements. In the A F M p l o t (Fig. 2) a n d in v a r i a t i o n d i a g r a m s (Fig. 3), the samples from the L o m l a n d dyke de- fine linear evolution trends, passing from the P u n t e r v o l d facies to the K l u n g l a n d facies. Field evidence, lack o f cumu-
Table 3. La content of apatites (ppm) and its contribution to the whole-rock La content
Lomland Vetta- Vaers-
land land Rock no. 11 14 18 17 5 24 Specimen 66175 7534 7 5 5 9 72105 7557 66192 La 376 419 841 736 115 878 %Ap" 7.5 6.3 3.1 3.3 3.0 2.8 La b 42.4 40.0 46.0 27.8 6.3 44.8 Apatite contribution to whole-rock La content
in ppm 28.2 26.4 26.1 24.3 3.45 24.6
in % 67 66 57 64 55 55 Normative apatite content of the rock (see Table 1) b Whole-rock La content (ppm)
late textures and R E E content o f apatite suggest t h a t these rocks represent m a g m a t i c liquids.
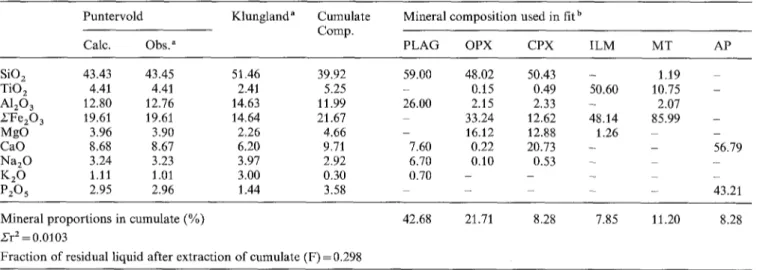
The possibility o f deriving the K l u n g l a n d f a d e s from the P u n t e r v o l d facies by fractional crystallization and sepa- r a t i o n at d e p t h o f a " h i d d e n " c u m u l a t e has been investi- gated. A least-square regression m e t h o d (Table 4) has shown that, starting from the P u n t e r v o l d average composi- tion, s u b t r a c t i o n o f an oxide- a n d apatite-rich noritic cumu- late gives a residual liquid close to the K l u n g l a n d facies average c o m p o s i t i o n , which therefore explains the m a j o r element variations in the dyke. The agreement between the calculated and observed values is excellent, the sum o f squared residues (~'r 2) being 0.01.
A p a t i t e can thus be considered a liquidus mineral for the P u n t e r v o l d c o m p o s i t i o n . As shown experimentally b y W a t s o n (1979), s a t u r a t i o n in apatite depends on the P205 content o f the m a g m a as well as on the t e m p e r a t u r e and SiO2 content. W a t s o n ' s f o r m u l a gives a t e m p e r a t u r e o f 1,050 ~ C for the P u n t e r v o l d norite.
Table 4. Least-square fractionation model for the Lomland dyke Puntervold Klungland" Cumulate
Comp. Calc. Obs. a
Mineral composition used in fit b
PLAG OPX CPX ILM MT AP
SiO 2 43.43 43.45 51.46 39.92 TiO z 4.41 4.41 2.41 5.25 A120 a 12.80 12.76 14.63 11.99 SFe20 3 19.61 19.61 14.64 21.67 MgO 3.96 3.90 2.26 4.66 CaO 8.68 8.67 6.20 9.71 Na20 3.24 3.23 3.97 2.92 K 2 0 1.11 1.01 3.00 0.30 P20 5 2.95 2.96 1.44 3.58 59.00 48.02 50.43 - - 0.15 0.49 50.60 26.00 2.15 2.33 - 33.24 12.62 48.14 - 16.12 12.88 1.26 7.60 0.22 20.73 - 6.70 0.10 0.53 - 0.70 - - -- 1.19 10.75 2.07 85.99 56.79 43.21 Mineral proportions in cumulate (%)
Nr z =0.0103
Fraction of residual liquid after extraction of cumulate (F) = 0.298
42.68 21.71 8.28 7.85 11.20 8.28
All analyses (except the first column) recalculated to 100% after subtraction of MnO and with Fe as FezO 3 a See Table 1
b The mineral compositions are close to those of the upper part of the anorthosito-noritic stage of the Bjerkreim-Sokndal lopolith (rhythm V in the stratigraphy of P. Michot 1960): PLAG (An37); OPX (Cao.sFe49.9Mg49.6); CPX (Ca43Fe19Mg38) - from specimen JCD8027 (Duchesne, unpublished); ILM and MT from specimen JCD6482 (Duchesne 1972)
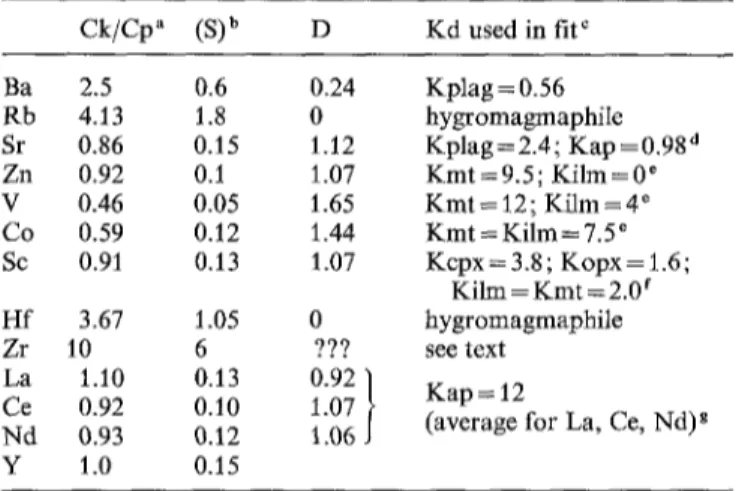
Table 5. Trace element modelling of the Lomland fractional crys- tallization Ck/Cp" (S) b D Kd used in flu Ba 2.5 0.6 0.24 Kplag=0.56 Rb 4.13 1.8 0 hygromagmaphile Sr 0.86 0.15 1 . 1 2 Kplag= 2.4; Kap =0.98 d Zn 0.92 0.1 1.07 Kmt =9.5; Kilm = 0 e V 0.46 0.05 1.65 K m t = 12; Kilm = 4 ~ Co 0.59 0.12 1.44 Kmt = K i l m = 7.5 e Sc 0.91 0.13 1 . 0 7 Kcpx= 3.8; Kopx= t.6; Kilm = Kmt = 2.0 f Hf 3.67 1.05 0 hygromagmaphile Zr 10 6 ??? see text La 1.10 0.13 0.92 / K a p = 12
Ce 0.92 0.10 1.07 J (average for La, Ce, Nd) g Nd 0.93 0.12 t.06
Y 1.0 0.15
Trace element contents in ppm, except REE contents, which are in chondrite-normalized values.
From Table 1
b Standard deviation (S) calculated from the values in Table 1 c When the Kd value is not specified in a mineral, it is assumed to be equal to 0 for that mineral
a With Kap/plag=0.41 (see Roelandts and Duchesne 1979) e On the basis of the distribution between ilmenite and magnetite in coexisting pairs from the Bjerkreim-Sokndal lopolith (Duchesne 1972)
f Assuming Kcpx/opx = 2.3 and Kcpx/mt = 1.9 (see Schilling et al. 1978)
g It is assumed that the REE do not enter the other minerals
Trace elements. The results o f the major element modelling can be extended to trace elements (Table 5). Assuming a Rayleigh fractional crystallization model, concentration o f a trace element in Klungland (CK) will be related to that in Puntervold (Cp) by the following equations:
CK = CpF D- 1 (1)
and
D = Z g K d (2)
in which F is the fraction o f liquid ( = 0.298 - see Table 4), D the bulk partition coefficient, bt the mineral proportions in the cumulate (determined in Table 4) and K d the solid/ liquid partition coefficients. F o r hygromagmaphile ele- ments (like R b and Hf), D = 0 and Eq. (1) becomes CK/Ce = 1/F and the ratio CK/C e reaches its m a x i m u m value, 3.4 for F = 0.298.
Table 5 summarizes the evolution o f the trace element contents between the two fades, o f the bulk partition coeffi- dents calculated from Eq. (I) and o f the K d values which fit the model. The latter are calculated using Eq. (2), which is greatly simplified in most cases because K d values can be considered equal to zero in m a n y minerals, the behaviour o f a particular trace element being mainly controlled by one or two minerals.
Some points are worth commenting on
1). The apatite/liquid K d for the R E E - a r o u n d 12 - is close to values used by Paster et al. (1974) to model the Skaergaard evolution and recommended by H a n s o n (1980) for basaltic compositions.
2. The evolution o f Eu, which paradoxically shows an in- crease o f its positive a n o m a l y with differentiation (Fig. 5),
can be explained by subtraction o f apatite (which has a negative Eu anomaly) together with plagioclase. The posi- tive Eu anomaly o f the plagioclase is outweighed by the negative anomaly o f the apatite. In the present case, a sim- ple calculation shows that a K d o f 9.0 for Eu in apatite fits the model, if we assume a K d value o f 0.40 for Eu in plagioclase (see Appendix 1 - Table 2), and a K d o f 13.4 for Eu* in apatite, a value consistent with the K d o f La, Ce and Nd. More elaborate calculations would re- quire a better knowledge o f the oxygen fugacity o f the sys- tem. It is sufficient here to demonstrate that the evolution can be accounted for with plausible values o f Kd.
3. K d for transition elements are not well defined because their behaviour is controlled by several mafic minerals. F o r Zn, Co and V, additional constraints were defined from the data obtained on ilmenite-magnetite pairs in the Bjerk- reim-Sokndal massif (Duchesne 1972). F o r Sc, values in agreement with those reviewed by Schilling et al. (1978) were obtained.
4. Ta, U and Th are not considered in Table 5. Ta and Th vary somewhat erratically and do not show the classical hygromagmaphile behaviour. U is also variable and de- pleted, as is c o m m o n in rocks o f the granulite facies. 5. H f can be considered hygromagmaphile but Zr, in the Klungland facies, is much more enriched than should be expected if it is hygromagmaphile and shows a large scatter of values ( s = 186 ppm, i.e. 32%). Actually the proposed model fails to explain the Zr behaviour in Lomland.
F o r most trace elements the partition coefficients which fit the model lie within the accepted limits o f uncertainty. It can therefore be concluded that the behaviour o f most trace elements does not contradict the fractional crystalliza- tion model developed for the major elements. The other monzonoritic occurrences show geochemical features broadly similar to those o f Lomland. The Sirevgtg dyke, however, is significantly enriched in R E E and other hygro- magmaphile elements and displays a negative Eu anomaly which requires a large a m o u n t o f plagioclase fractionation.
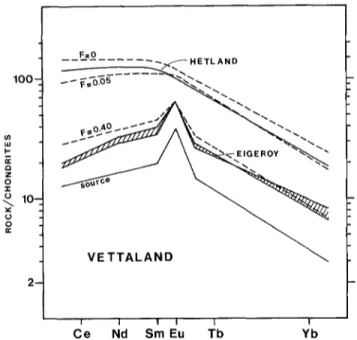
The Vettaland dyke: evidence for eutectic partial melting
Regarding the major element contents, the Vettaland dyke rocks are very homogeneous (Figs. 2 and 3; Table 1): they could have been formed by crystallization o f a single mag- matic liquid. However, when trace elements are taken into consideration, the Hetland facies, comparable to c o m m o n monzonorites in other dykes, appears quite distinct from the E i g e r t y facies, which is depleted in L I L E , and is charac- terized by an umbrella-shaped R E E distribution with a pos- itive Eu anomaly. Textural evidence suggests that the Ei- g e r t y facies is not a cumulate rock and the chemical c o m p o - sition is not different from that o f the Hetland facies, partic- ularly in P2Os and TiO z .
The two facies could result from different degrees o f partial fusion o f the same source material. The constancy o f the major element composition can be accounted for if the liquid is eutectic and remains at the eutectic during the melting process. Moreover, the Vettaland composition is very rich in Fe and plots in the A F M diagram (Fig. 2) not far from the Skaergaard late stage liquids [near the U Z a liquid o f Wager and Brown (1968), corresponding to 96% solidification]. If partial fusion is considered an equi-
1 0 0 - l - r. O 3: ~. 10- 2- F=0 7 . - ~ H E T L A N D ---~__, . . . ~ - ,
"-8.'-.
/
D I I I I I I C e Nd Sm Eu Tb YbFig. 6. Comparison of the measured REE distributions in the Vet- taland dyke with those calculated from a partial melting model (see text). The Kd values used for apatite are: Ce=4.5, Sm=7.0, Eu = 6.0, Tb = 7.0, and Yb = 4.0. Various degrees of partial melting (F = 0, 0.05, 0.40) of the source rock are represented by the dashed lines (see text). They are compared to the Hetland and Eiger6y facies
librium process, the composition of the starting material must not be very different from that of the liquid. There- fore, the source rock must be a moderately Fe-enriched gabbro or norite.
Fusion of a basic rock to produce an iron-rich and rela- tively SiO2-poor liquid of monzonoritic composition re- quires the same physicochemical conditions as those which control the formation of Fe-enriched liquids through frac- tional crystallization, that is, low water content and low fO2, as well as moderate depths. By contrast, dacitic liquids would be produced in wet conditions with an amphibolite residue (Helz 1976) or at greater depths with an eclogite residue (Green and Ringwood, 1967). The anorthositic plu- tonism provides a suitable environment for the development of such a dry basic anatexis: indeed, anorthosite emplace- ment as hot diapirs of rising plagioclase crystal mush (Ma- quil and Duchesne 1984) in the granulite facies lower crust could induce this anatexis.
The model. By trial and error, the composition of a possible source rock for the Vettaland liquids has been found to be a basic rock containing 1.5% apatite and characterized by a positive Eu anomaly and a somewhat depleted light REE distribution, as shown in Fig. 6. Such a REE distribu- tion can be accounted for by various mineral associations provided it contains suitable amounts of plagioclase (posi- tive Eu anomaly) and apatite (light REE depletion). The latter mineral plays a critical role, since it is present in minor amounts (1.5%) but provides a large part of the REE content of the rock (e.g. up to 80% of the Sm content). Besides the apatite content, the following mineral con- tent for the source rock has been assumed: 45% plag(An40 ) + 22% opx + 9% cpx + 12% ilm + 10% mag. Such an association is commonly found in norite cumulates, e.g. in Bjerkreim-Sokndal (see Duchesne 1978), and has a major
element composition not far from that of the Vettaland composition.
The mathematical expression of the model is equilibri- um non-modal melting
CL/CO= 1/Do + F(1 -- P) (3)
where C L and Co are the concentrations of a given element in the liquid and in the initial solid, respectively, F is the fraction of melt, Do is the bulk partition coefficient at the beginning of melting and P is the bulk partition coefficient for the melt proportions.
The Kd values used in the calculations of Do and P (Appendix 1) have been determined on the basis of the composition of the various minerals of a noritic cumulate of the Bjerkreim-Sokndal massif (Duchesne 1978; Roe- landts and Duchesne 1979). The silicate minerals Kd values are interestingly close to those calculated by Paster et al. (1974) for the Skaergaard differentiation. For apatite the Kd's used are 2 times lower than those which fit the Lore- land crystallization model (Table 4). Watson and Green (1981) have shown on experimental grounds that apatite/ melt Kd values are very sensitive to temperature and SiO 2 content of the melt and particularly that a two-fold decrease in the values can be due to a 130 ~ C increase in temperature. The difference between the Lomland and Vettaland mag- mas, both in temperature and composition, can account for the variation in the apatite Kd values. The mineral pro- portions used in calculation of Do and P are respectively those assumed for the source and those calculated from the average normative composition of the Vettaland dyke (Table 1). Equation (3) is used until the total exhaustion of apatite, which takes place for F = 0.40. Figure 6 shows that the model satisfactorily accounts for the Hetland facies (0-5% partial melting) and for the Eiger6y facies (up to 40% partial melting).
The behaviour of the other trace elements can also be understood in the light of the model. The strong depletion of Zr in the Eiger6y facies indicates that trace amounts of a Zr-bearing mineral, initially present in the source rock, are used up in the first stages of the melting process and that no Zr is left in the source rock for higher F values. On the other hand, the relatively slight variations of Sr and transition elements between the two facies are due to the small variations in the main mineral proportions in the source rocks during the process, as can be forseen on the basis of the similarity between the major element composi- tions of the source rock and the melt.
In conclusion, the geochemical characters of the Vetta- land dyke - constancy of major elements and strong varia- tion in trace elements - can be explained by partial melting of a basic cumulate rock under granulite facies conditions.
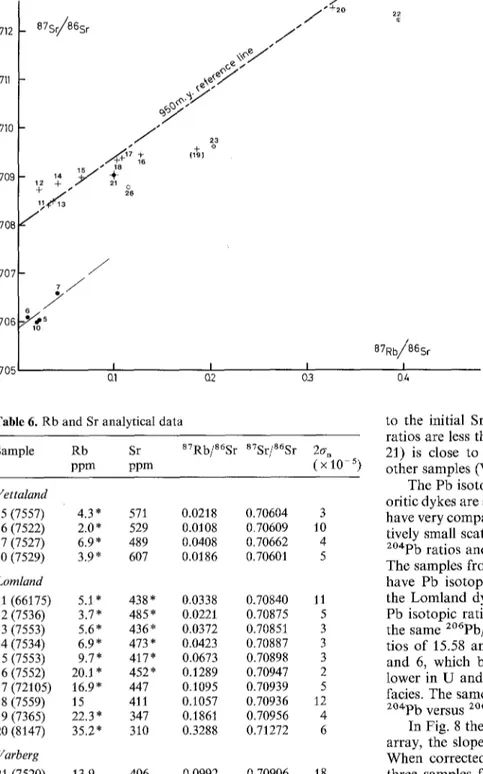
Sr and Pb isotopic compositions
The measured Sr isotopic ratios on selected samples are plotted in Fig. 7 (see Table 6). The Lomland samples are roughly aligned (except sample 19 2) around a 950 Ma refer- 2 Sample 19 comes from a thin (10 cm) dyke a few tens of metres from the main Lomland dyke. Its overall petrographic and chem- ical characteristics point to a close relation with Lomland, and explain that it has not been distinguished from it in the previous sections. Nevertheless, the Sr isotopic composition indicates that the relation is more complex
0.712 0.711 0,710 0.709 0.708 0.707 0.706 8 7 S / 8 6 S r /
/
t sj++,7 ~
1 2 -~- 21 0 " 2 6 //
1 0+~
Og) 0.705 I I I Q1 Q2 0.3 2~ 87Rb/86Sr I 0.4 Fig. 7. 878r/86Sr versus 87Rb/86Sr diagram for variousmonzonorites. Same symbols as in Fig. 2; the numbers refer to Table 1
Table 6. Rb and Sr analytical data
Sample Rb Sr 87Rb/86Sr 87Sr/86Sr 2a, ppm ppm (x 10 5) Vettaland 5 (7557) 4.3 * 571 0.0218 0.70604 3 6 (7522) 2.0* 529 0.0108 0.70609 10 7 (7527) 6.9 * 489 0.0408 0.70662 4 10 (7529) 3.9* 607 0.0186 0.70601 5 Lomland 11 (66175) 5A * 438* 0.0338 0.70840 11 12 (7536) 3.7" 485" 0 . 0 2 2 1 0.70875 5 13 (7553) 5.6* 436* 0.0372 0.70851 3 14 (7534) 6.9" 473" 0 . 0 4 2 3 0.70887 3 15 (7553) 9.7* 417" 0 . 0 6 7 3 0.70898 3 16 (7552) 20A * 452* 0.1289 0.70947 2 17 (72105) 16.9" 447 0.1095 0.70939 5 18 (7559) 15 411 0.1057 0.70936 12 19 (7365) 22.3 * 347 0.1861 0.70956 4 20 (8147) 35.2* 310 0.3288 0.71272 6 Varberg 21 (7520) 13.9 406 0.0992 0.70906 18 Vaersland 22 (66192) 40 294 0 . 3 9 4 4 0.71226 15 HMand 23 (7548) 23.5 335 0.2032 0.700965 4 Rb and Sr determined by XRF (analysts C. L6ger and A. Kool, MRAC, Tervuren, Belgium), except the values marked by *, which were determined by isotopic dilution
ence line corresponding to the crystallization age of the monzonoritic dykes ( U - P b zircon data: Pasteels etal. 1979), which gives a Sr isotopic initial ratio (Isr) close to 0.7080. The four analysed samples of the Vettaland dyke have distinctly lower Sr ratios of about 0.7060, very close
to the initial Sr isotopic composition since the a7Rb/86Sr ratios are less than 0.04. The Varberg dyke data point (no. 21) is close to the Lomland 950 Ma reference line. The other samples (Vaersland, H~land, no. 19) plot below it.
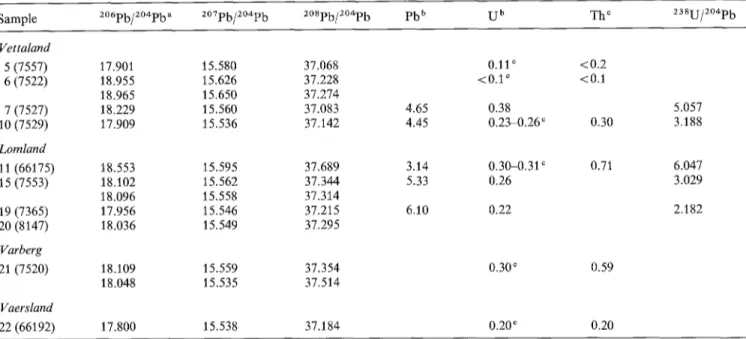
The Pb isotopic compositions for some of the monzon- oritic dykes are shown in Fig. 8. The Lomland dyke samples have very comparable Pb isotopic compositions, with a rela- tively small scatter of values: 17.96 to 18.55 for the 2~ 2~ ratios and 15.55 to 15.60 for the 2~176 ratios. The samples from Varberg (no. 21) and Vaersland (no. 22) have Pb isotopic ratios not very different from those of the Lomland dyke. The Vettaland dyke has well-scattered Pb isotopic ratios, shown by samples 5 and 10, which for the same 2~176 values of 17.9, have 2~176 ra- tios of 15.58 and 15.54 respectively. Moreover, samples 5 and 6, which belong to the Eiger6y facies, are distinctly lower in U and Th than samples 7 and 10 of the Hetland facies. The same kind of grouping is observed in the 2~ 2~ versus Z~176162 diagram.
In Fig. 8 the Lomland dyke data roughly define a linear array, the slope of which roughly corresponds to 950 Ma. When corrected for the in situ U decay for 950 Ma, the three samples for which U and Pb contents are available give similar "initial" Pb ratios (point L on Fig. 8).
Discussion
The Sr isotopic data show that each monzonoritic dyke is distinct but that, within a dyke, there is no isotopic varia- tion. The enclosing anorthositic massifs also display vari- able Isr, as shown by Demaiffe (1977) and Duchesne and Demaiffe (1978): Egersund-Ogna (0.7035-0.7045); Hgdand- Helleren (0.705-0.706); Bjerkreim-Sokndal anorthosites and norites (ca. 0.7057). This precludes any direct relation of any of these massifs with the Lomland dyke, which has a higher Isr. Regarding the Vettaland dyke, its Is~ (ca. 0.706) is not far from Bjerkreim-Sokndal, but quite distinct from the enclosing Egersund-Ogna massif.
Table 7. Pb isotopic compositions
Sample 2~176 ~ 2~176 2~176 Pb b U b The z38u/2~
VettaNnd 5 (7557) 17.901 15.580 37.068 6 (7522) 18.955 15.626 37.228 18.965 15.650 37.274 7(7527) 18.229 15.560 37.083 10 (7529) 17.909 15.536 37.142 LomNnd 11 (66175) 18.553 15.595 37.689 15 (7553) 18.102 15.562 37.344 18.096 15.558 37.314 19 (7365) 17.956 15.546 37.215 20 (8147) 18.036 15.549 37.295 Varberg 21 (7520) 18.109 15.559 37.354 18.048 15.535 37.514 Vaersland 22 (66192) 17.800 15.538 37.184 0.11 ~ <0.2 <0.1 ~ <0.1 4.65 0.38 5.057 4.45 0.23-0.26 r 0.30 3.188 3.14 0.30-0.31 c 0.71 6.047 5.33 0.26 3.029 6.10 0.22 2.182 0.30 ~ 0.59 0.20 c 0.20
" Results corrected for mass discrimination (1.34 + 0.4%, a.m.u) on the basis of repeated analyses of the NBS 981 Pb standard b In ppm - isotope dilution mass spectrometry
c In ppm - instrumental neutron activation analysis
15.65 15.60 1E55 15.50 15.45 15.40 207pb,//204Pb
~6
11 + 5 9 1 5 19 20 ,-~7 ~ ~ " 9 2*2 ?o + + ~21 9~0~."j "~'e'~e~e ... 9 H G L J 206pb,//204pb 17.5 18.0 18.5 9.0 I I I I Fig. 8. 2~176 v e r s u s 2 ~2~ diagram. Same symbols as in Fig. 2; the numbers refer to Table t. L and V indicate the initial ratios for the Lomland and Vettaland dykes respectively. B, H and G correspond to the initial ratios of the Bjerkreim-Sokndal acidic rocks, of the Hidra charnockitic dykes, and of the average granulite facies gneisses, respectively (see text)
The high Isr ratios also indicate that m o n z o n o r i t e s are not directly derived f r o m a mantle source. The hypothesis o f Emslie (1978) - derivation from a tholeiitic basaltic m a g m a - thus c a n n o t be generalized to all occurrences.
D e p l e t i o n in R b a n d U due to a granulite facies meta- m o r p h i s m (see Heier 1973) occurring after the crystalliza- tion o f the dykes m u s t be rejected. The dykes indeed in- t r u d e d after the regional d e f o r m a t i o n , and m o s t l y display a typical m a g m a t i c texture with no indication o f a meta- m o r p h i c overprint.
C h a r n o c k i t i c acid rocks associated with the anorthosites usually present Sr and Pb characteristics, indicating either a large a m o u n t o f c o n t a m i n a t i o n by crustal m a t e r i a l or direct melting from lower crustal source rocks (Demaiffe et al. 1979; Weis a n d Demaiffe 1983a). The high Isr values o f the L o m l a n d dyke (ca. 0.708) as well as the position o f the Pb initial ratio (point L, Fig. 8), intermediate between the H i d r a charnockitic dykes (point H) a n d the Bjerkreim- S o k n d a l acidic rocks (point B), can be explained by a con-
t a m i n a t i o n process but c a n n o t preclude direct melting o f lower crustal material. The low U c o n t e n t o f L o m l a n d ( < 0.3 p p m ) together with the high Isr indicate t h a t the con- t a m i n a n t o r the source rock were relatively m o r e depleted in U t h a n in Rb, a fact a l r e a d y observed in m a n y granulite facies d o m a i n s (Ben O t h m a n et al. 1984).
The initial Pb ratios for the H e t l a n d facies o f the Vetta- land dyke (point V on Fig. 8) p l o t near the R o g a l a n d aver- age granulite m a t e r i a l (point G, Fig. 8) (Weis a n d Demaiffe 1983b). This again p o i n t s to strong c o n t a m i n a t i o n or direct melting.
O u r geochemical data, however, suggest t h a t p a r t i a l melting can be preferred to all other processes to account for the m o n z o n o r i t e s . W e have indeed shown t h a t a ferron- oritic cumulate can be the source r o c k o f the V e t t a l a n d dyke. Because o f the m a n y similarities o f p a r t o f the dyke (the H e t l a n d facies) with c o m m o n m o n z o n o r i t e s , the p a r t i a l melting hypothesis can be extended to all occurrences. The low level o f U a n d Th a n d the range o f values o f the Isr
(0.706-0.708) indicate that the source rock was in the g r a n u - lite facies a n d the K 2 0 c o n t e n t points to a basic to interme- diate composition.
Conclusions
The geochemical features o f the m o n z o n o r i t i c liquids (no Eu anomaly, high Sr initial ratios, P b isotopic composition) suggest that they are n o t strictly c o m a g m a t i c with massif- type anorthosites a n d that they are n o t generated in the upper mantle.
F r a c t i o n a l crystallization by s u b t r a c t i o n of a noritic cu- mulate can explain the variety of rocks from norite to (quartz) monzonite. This shows that m o n z o n o r i t i c m a g m a t - ism can give rise to acidic rocks w i t h o u t a n y c o n t a m i n a t i o n d u r i n g the process (constant initial Sr a n d P b ratios in the L o m l a n d dyke).
The Vettaland dyke is a r e m a r k a b l e case of eutectic partial melting, the source rock being an apatite-bearing
ferronoritic cumulate. The process would have taken place in a granulite facies e n v i r o n m e n t (low p H 2 0 ) in moderate total pressure conditions (plagioclase is stable in the resi- due). T h e necessary heat o f melting might have been pro- vided by the huge diapirs of anorthositic mush which consti- tute the massif anorthosites.
I n view of the similarities between part o f the Vettaland dyke a n d other monzonorites, it is suggested that the partial melting process of granulite facies rocks could be generally applied to a c c o u n t for all m o n z o n o r i t i c occurrences, rather t h a n advocating variable crustal c o n t a m i n a t i o n of mantle- derived liquids.
Acknowledgments. J. Michot and J. Hertogen are thanked for their advice and interest. I. Roelandts thanks K.S. Heier, J.A. Dons and A.O. Brunfelt for providing NAA laboratory facilities during a period of work at the Mineralogisk-Geologisk Museum, Oslo. Major elements and some trace elements were analysed in the "Col- lectif Interuniversitaire de G6ochimie Instrumentale" (University of Li6ge). G. Bologne provided valuable assistance in the analytical work. The research was supported by the F.N.R.S. (Belgium).
Appendix 1
Table 1. REE content (ppm) in the various cumulate minerals of a norite from the Bjerkreim-Sokndal lopolith (rock specimen JCD6444)
La Ce Nd Sm Eu Tb Yb Lu Apatitea 216 606 479 130 25.9 16.1 17.8 1.9 Plagioclase ~ 2.98 4.94 2.1 0.33 1.66 0.034 0.043 0.007 Orthopyroxene 0.49 1.85 1.3 0.41 0.10 0.084 0.49 0.10 Clinopyroxene 3.04 12.6 14.6 6.05 1.52 1.03 1.61 0.26 Ilmenite 0.74 1.81 0.9 0.29 0.092 0.033 0.14 0.033 Magnetite 0.27 0.74 0.5 0.10 0.03 0.013 0.036 0.005
" See Roelandts and Duchesne (1979)
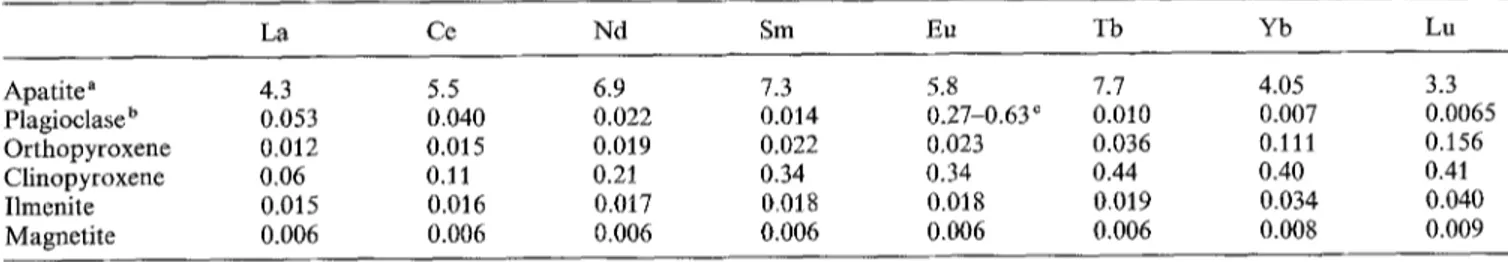
Table 2. Mineral/melt distribution coefficients for the REE used in modelling the Bjerkreim-Sokndal differentiation
La Ce Nd Sm Eu Tb Yb Lu Apatite a 4.3 5.5 6.9 7.3 5.8 7.7 4.05 3.3 Plagioclase b 0.053 0.040 0.022 0.014 0.27-0.63 c 0.010 0.007 0.0065 Orthopyroxene 0.012 0.015 0.019 0.022 0.023 0.036 0.111 0.156 Clinopyroxene 0.06 0.11 0.21 0.34 0.34 0.44 0.40 0.41 Ilmenite 0.015 0.016 0.017 0.018 0.018 0.019 0.034 0.040 Magnetite 0.006 0.006 0.006 0.006 0.006 0.006 0.008 0.009
a From Roelandts and Duchesne 1979; Duchesne 1978
b Calculated on the basis of the distribution between 7 pairs of plagioclase and apatite (Roelandts and Duchesne c K ~ g depends on oxygen fugacity (see Table 4 in Roelandts and Duchesne 1979)
1979)
Appendix 2. Analytical procedures
Major elements were determined by X-ray fluorescence on a CGR Lambda 2020 spectrometer on Li borate glass discs. The trace elements reported in Table 1 were also measured by XRF, matrix corrections being calculated from the major element composition. FeO was measured by titration.
Neutron-activation analyses have been carried out at the Mineralogisk-Geologisk Museum, Oslo University, Norway. USGS reference basalt BCR-1 was used as a multi-element standard. Details have been reported previously (Roelandts 1975, 1977). Results reported in Tables I and 2 are averages of 2-5 replicate analyses. The relative standard deviations were as follows: La 2.4%; Ce 4.4%; Nd 7.8%; Sm 2.7%; Eu 6.5%; Tb 7.1%; Yb 8.9%; Lu 6.8%; Ba 4.6%; Co 5.8%; Cr 5.0%; Hf 10%; Rb 5.4%; Sc 7.8%; Sr 7.9%; Ta 9.8%; Th 25%; U 45%. Our values on geochemical reference samples are in close agreement with the "consensus values" of Gladney et al. (1983). Some light REE have been determined in apatites by XRF after anion exchange extraction (Roelandts 1981).
Rb, Sr, U and Pb concentrations were determined in some samples by isotope dilution mass spectrometry on a VARIAN TH5 mass spectrometer. Sr was separated in an ion-exchange column and its isotopic composition was measured by thermoionization with a double rhenium filament on a FINNIGAN MAT 260 mass spectrometer. The 87Sr/86Sr values were normalized to 8SSr/86Sr = 8.3752. Ten determinations of the Eimer and Amend Sr standard yielded an average 87Sr/86Sr ratio of 0.70807_+7. Pb was separated with an ion-exchange column in a HBr-HC1 medium and loaded on a single rhenium filament using the silica gel/H3PO4 method (see Weis 1981, for detailed procedure). The Pb isotopic composition measured on a FINNIGAN-MAT260 mass spectrometer was corrected
for mass discrimination (1.34_+0.4%, per a.m.u.) on the basis of 25 analyses of the NBS 981 Pb standard. All blanks were less than 2 ng Pb.
References
Ashwal LD (1982) Mineralogy of mafic and F e - T i oxide rich differentiates of the Marcy anorthosite massif, Adirondacks, New York. Am Mineral 67:14-27
Ben Othman D, Polv6 M, All+gre CJ (1984) N d - S r composition of granulites. Constraints on the evolution of the lower conti- nental crust. Nature 307:510-515
Buddington AF (1972) Differentiation trends and parental magmas for anorthositic and quartz mangerite series, Adirondacks, New-York. Geol Soc Am Mem 132:477-488
Demaiffe D (1977) De l'origine des anorthosites. P6trologie, g6o- chimie et g6ochimie isotopique des massifs anorthositiques de Hidra et de Garsaknatt (Rogaland, Norv6ge m6ridionale). Un- publ Dr Sc Thesis, Univ Bruxelles
Demaiffe D, Hertogen J (1981) Rare earth geochemistry and stron- tium isotopic composition of a massif-type anorthositic-char- nockitic body: the Hidra massif (Rogaland, S.W. Norway). Geochim Cosmochim Acta 45 : 1545-1561
Demaiffe D, Duchesne JC, Hertogen J (1979) Trace element varia- tions and isotopic composition of charnockitic acidic rocks re- lated to anorthosites (Rogaland - S.W. Norway). In: Ahrens LH (ed) Origin and distribution of the elements. Pergamon Press, pp 417-429
Demaiffe D, Michot J (1985) Isotope geochronology of the Proter- ozoic crustal segment of Southern Norway: a review. In: Touret J (ed) "The deep Proterozoic crust in the North Atlantic Prov- inces". Reidel (in press)
Duchesne JC (1972) Iron-Titanium oxide minerals in the Bjerkrem- Sogndal massif, Southwestern Norway. J Petrol 13:57-81 Duchesne JC (1978) Quantitative modeling of Sr, Ca, Rb and K
in the Bjerkrem-Sogndal layered lopolith (S.W. Norway). Con- trib Mineral Petrol 66:175-184
Duchesne JC, Demaiffe D (1978) Trace elements and anorthosite genesis. Earth Planet Sci Lett 38:249-272
Duchesne JC, Demaiffe D, Maquil R, Michot J, Wilmart E (1984) The Rogaland intrusive masses. In: Excursion guide of the South Norway geological excursion", NATO Adv Stud Inst Moi, July 1984
Duchesne JC, Roelandts I, Demaiffe D, Hertogen J, Gijbels R, De Winter J (1974) Rare-earth data on monzonoritic rocks related to anorthosites and their bearing on the nature of the parental magma of the anorthositic suite. Earth Planet Sci Lett 24:325-335
Emslie RF (1978) Anorthosite massifs, Rapakivi granites, and late Proterozoic rifting of North America. Precamb Res 7: 61-98 Gladney ES, Burns CE, Roelandts I (1983) 1982 compilation of
elemental concentrations in 11 US Geological Survey rock stan- dards. Geostand Newsl 7:3-226
Green DH, Ringwood AE (1967) The genesis of basaltic magmas. Contrib Mineral Petrol 15 : 103-190
Hanson G (1980) Rare earth elements in petrogenetic studies of igneous systems. Ann Rev Earth Planet Sci 8:371-406 Heier KS (1973) Geochemistry of granulite facies rocks and the
problems of their origin. Phil Trans Roy Soc London A273:429-442
Helz RT 0976) Phase relations of basalts in their melting ranges at P H z O = 5 K b . Part II. Melt compositions. J Petrol 17:139-193
Maquil R, Duchesne JC (1984) Geothermom6trie par les pyrox6nes et mise en place du massif anorthositique d'Egersund-Ogna (Rogaland, Norv6ge m6ridionale). Ann Soc G6ol Belg
107: 2%49
Michot P (1960) La g6ologie de la catazone: Le probl+me des anorthosites, la palingen+se basique et la tectonique catazonale dans le Rogaland m~ridional (Norv+ge m~ridionale). Norges Geol Unders 212g: 1-54
Michot P (1965) Le magma plagioclasique. Geol Rundschau 54: 956-976
Michot J, Michot P (1969) The problem of the anorthosites. The South Rogaland igneous complex (South Western Norway). In: Isachsen YW (ed) "Origin of anorthosites and related rocks", N Y State Mus Sci Serv Mem 18:399-410
Pasteels P, Demaiffe D, Michot J (1979) U - P b and R b - S r geo- chronology of the eastern part of the South Rogaland igneous complex, Southern Norway. Lithos 12:199-208
Paster TP, Shauwecker DS, Haskin LA (1974) The behaviour of some trace elements during solidification of the Skaergaard layered series. Geochim Cosmochim Acta 38 : 154%1577 Philpotts AR (t966) Origin of the Anorthosite-Mangerite rocks
in Southern Quebec. J Petrol 7 : 1-64
Philpotts AR (1981) A model for the generation of massif-type anorthosites. Can Mineral 19:233 253
Roelandts I (1975) Contribution au dosage par activation neutron- ique des terres rares et d'autres ~l~ments en trace dans les roches magmatiques. Unpubl Dr Sc Thesis, Univ Liege
Roelandts I (1977) Silicate rock and rock-forming mineral neutron activation analysis. Radiochim Acta 24:139-146
Roelandts I (1981) Determination of light rare earth elements in apatite by X-ray fluorescence spectrometry after anion ex- change extraction. Anal Chem 53:676-680
Roelandts I, Duchesne JC (1979) Rare-earth elements in apatite from layered norites and iron-titanium oxide ore-bodies related to anorthosites (Rogaland, S.W. Norway). In: Ahrens LH (ed) Origin and distribution of the elements. Pergamon, pp 199-212 Schilling JG, Sigurdsson H, Kingsley RH (1978) Skagi and Western Neovolcanic zones in Iceland: 2. Geochemical variations. J Geophys Res 83 : 3983 4002
Wager LR, Brown GM (1968) Layered igneous rocks. Oliver and Boyd Ltd, London
Watson EB (1979) Apatite saturation in basic to intermediate mag- mas. Geophys Res Lett 6:93%940
Watson EB, Green TH (1981) Apatite/liquid partition coefficients for the Rare Earth elements and Strontium. Earth Planet. Sci Lett 56: 405-421
Weis D (1981) Composition isotopique du plomb total de roches: m6thodologie. Bull Soc Chim Belg 90:1127-1140
Weis D, Demaiffe D (1983a) Pb isotope geochemistry of a massif- type anorthositic body: the Hidra massif (Rogaland, S.W. Nor- way). Geochim Cosmochim Acta 47:1405-1413
Weis D, Demaiffe D (1983b) Age relationships in the Proterozoic high-grade gneiss of Southern Norway: discussion and com- ment. Precamb Res 22:149-155
Wiebe RA (1984) Fractionation and magma mixing in the Bjerk- rem-Sogndal lopolith (S.W. Norway): evidence for the compo- sitions of residual liquids. Lithos 17:171-188