Prospective Association Among
Diabetes Diagnosis, HbA
1c
,
Glycemia and Frailty Trajectories
in an Elderly Population
https://doi.org/10.2337/dc19-0497
OBJECTIVE
Frailty is a dynamic state of vulnerability in the elderly. We examined whether individuals with overt diabetes or higher levels of HbA1cor fasting plasma glucose
(FG) experience different frailty trajectories with aging. RESEARCH DESIGN AND METHODS
Diabetes, HbA1c, and FG were assessed at baseline, and frailty status was evaluated
with a 36-item frailty index every 2 years during a 10-year follow-up among participants from the English Longitudinal Study of Ageing. Mixed-effects models with age as time scale were used to assess whether age trajectories of frailty differed as a function of diabetes, HbA1c, and FG.
RESULTS
Among 5,377 participants (median age [interquartile range] 70 [65, 77] years, 45% men), 35% were frail at baseline. In a model adjusted for sex, participants with baseline diabetes had an increased frailty index over aging compared with those without diabetes. Similar findings were observed with higher levels of HbA1c, while FG was not associated with frailty. In a model additionally adjusted
for income, social class, smoking, alcohol, and hemoglobin, only diabetes was associated with an increased frailty index. Among nonfrail participants at baseline, both diabetes and HbA1clevel were associated with a higher increased
frailty index over time. CONCLUSIONS
People with diabetes or higher HbA1clevels at baseline had a higher frailty level
throughout later life. Nonfrail participants with diabetes or higher HbA1calso
experienced more rapid deterioration of frailty level with aging. This observation could reflect a role of diabetes complications in frailty trajectories or earlier shared determinants that contribute to diabetes and frailty risk in later life.
Life expectancy is increasing worldwide. However, the aging process is heterogeneous with a large interindividual variability in health status and disability (1). This heterogeneity in aging can also affect people with diabetes, who are also living longer than before. Although the age-specific prevalence of diabetic complications is lower now than in the past, the cumulative lifetime prevalence of complications in older adults with diabetes and the co-occurrence of having multiple medical conditions are higher (2).
1
Population Health Department, Luxembourg Institute of Health, Strassen, Luxembourg
2Department of Public Health, Aarhus University,
Aarhus, Denmark
3
Danish Diabetes Academy, Odense, Denmark
4
Steno Diabetes Center Aarhus, Aarhus, Denmark
5Competence Center for Methodology and
Sta-tistics, Luxembourg Institute of Health, Strassen, Luxembourg
6
Department of Public Health, University of Li `ege, Li `ege, Belgium
7Departments of Epidemiology and Biostatistics
and Family Medicine, Schulich School of Med-icine and Dentistry, University of Western On-tario, London, OnOn-tario, Canada
8
INSERM U1153, Epidemiology of Ageing and Neurodegenerative Diseases, Paris, France
9Department of Epidemiology and Public Health,
University College London, London, U.K. Corresponding author: Gloria A. Aguayo, gloria .aguayo@lih.lu
Received 11 March 2019 and accepted 8 July 2019 This article contains Supplementary Data online at http://care.diabetesjournals.org/lookup/suppl/ doi:10.2337/dc19-0497/-/DC1.
© 2019 by the American Diabetes Association. Readers may use this article as long as the work is properly cited, the use is educational and not for profit, and the work is not altered. More infor-mation is available at http://www.diabetesjournals .org/content/license.
Gloria A. Aguayo,1Adam Hulman,2,3,4 Michel T. Vaillant,5
Anne-Françoise Donneau,6Anna Schritz,5 Saverio Stranges,1,7Laurent Malisoux,1 Laetitia Huiart,1Mich `ele Guillaume,6 S ´everine Sabia,8,9and Daniel R. Witte2,3
EPIDEMI
OLOGY/HEALTH
SERVICES
RESEARCH
Another consequence of population aging is an increase in the number of frail elderly people, who are easily af-fected by stressors. Frailty is a state of vulnerability in the elderly, which in-creases the risk of poor health outcomes such as falls, fractures, hospitalization, institutionalization, disability, and mor-tality (3). Frailty is highly prevalent in elderly populations, with an estimated prevalence between 4 and 59%, depend-ing on which instrument is used to assess frailty (4). There are many different op-erational definitions of frailty. These are based on different underlying con-cepts, such as the accumulation of def-icit definitions, which emphasize the number of deficits out of at least 30 var-iables (5); the multidimensional model definitions, which assess different di-mensions of functioning but with less than 30 variables (3); and the phenotype of frailty definitions, which are centered on physical frailty (6). However, despite these differences, most experts agree that frailty is a dynamic process that increases with aging (3). There is evi-dence that frailty progression can be slowed or reverted by treatment, high-lighting the need to detect it at early stages to minimize potential health consequences (7).
Diabetes and frailty share some path-ophysiological mechanisms, such as low-grade inflammation, insulin resistance, and sarcopenia (2). There is also epide-miological evidence supporting the as-sociation between diabetes and frailty (8), and both have a strong socioeco-nomic gradient, with deprived popula-tions experiencing a higher risk of the two conditions. However, the long-term effect of diabetes on the evolution of frailty as people get older remains unexplored.
The purpose of this study was to evaluate the association of diabetes, HbA1c,
and fasting plasma glucose (FG) with the development of frailty as people age (frailty trajectory). We hypothesized that diabetes, as well as higher HbA1cand
FG levels, would be associated with a higher level of frailty and with a more marked increase in frailty over time. RESEARCH DESIGN AND METHODS Study Design, Participants, and Inclusion Criteria
The English Longitudinal Study of Ageing (ELSA) is an ongoing cohort study that is based on a representative sample of the
elderly English population established in 2002, with data collected at 2-year intervals. Mental/physical health data, determinants of health, and social and economic data were assessed over the follow-up period. In ELSA, even-numbered waves also included a clinical examination with blood sampling (9). Wave 2 (2004–2005) served as the base-line of the current study. Participants aged$60 years who attended the in-terview and clinical examination of this wave were retained in the analysis be-cause some variables needed to calculate frailty scores were not measured for participants aged,60 years. The current study used data collected between 2004 (wave 2) and 2015 (wave 7).
Outcome, Exposures, and Potential Confounders
The outcome was defined as frailty tra-jectories measured from wave 2 to wave 7. Frailty was measured by three different frailty scores. A 36-item Frailty Index (36-FI) (10) was studied as the primary outcome; the Edmonton Frail Scale (EFS) (11) and the phenotype of frailty score (6) were secondary out-comes (Supplementary Table 1).
The 36-FI was calculated on the basis of the frailty index of Searle et al. (10), which is from the accumulation of def-icit approach, including variables de-scribing disability, comorbidity (excluding diabetes), physical functioning, and men-tal health. The 36-FI was chosen as the primary outcome because of its high reliability as well as its predictive and discriminative ability for mortality (12,13). It was possible to calculate the 36-FI in all waves. The score dichotomizes most var-iables as 0 (deficit not present) or 1 (deficit present). The 36-FI is calculated by adding the current deficits and is subsequently rescaled to range from 0 (robust) to 1 (maximum frailty) and considered as a continuous variable in our analyses. The cutoff for defining frailty is 0.2 (10). The EFS (11) is a multidimensional frailty score that includes 11 variables of different dimensions, such as cogni-tion, social support, self-reported health, continence, nutrition, disability, and mood. The EFS was chosen because it has high discriminative ability for mor-tality (13). The scale ranges from 0 to 17. The cutoff for defining frailty is .5.
The phenotype of frailty score (6) is based on a physiological model and
centers on physical frailty. This score includes five variables: unintentional weight loss, weakness, exhaustion, slow gait, and low physical activity. The score was chosen because it is the most cited frailty score (14). The scale ranges from 0 to 5. The cutoff for defining frailty is $3, and a prefrail state is defined when the score is$1 and ,3.
The EFS and the phenotype of frailty score were calculated only in waves 2, 4, and 6 because of the need for variables measured only at clinical examinations. The 36-FI was calculated in each wave because it is mostly calculated with var-iables from questionnaires and only needs a few objective variables mea-sured in clinical examinations. To calcu-late the 36-FI in all waves, if a necessary variable was only measured at a clinical examination (even-numbered waves), the last observation carried forward method was applied.
To facilitate comparisons among the three scales, frailty scores were rescaled from 0 (robust) to 100 (maximum frailty). The frailty scores were rescaled by di-viding the obtained output by the max-imum value possible for this score and multiplying the result by 100.
Diabetes was defined as having a self-reported medical diabetes diagnosis or HbA1c $6.5% ($48 mmol/mol) or
FG .7 mmol/L. HbA1c and FG were
analyzed as continuous variables. Expo-sures were measured at baseline and handled as time-invariant variables.
Potential confounders were demo-graphic and lifestyle variables at base-line and included sex, year of birth, family income, social class, smoking status, maximum self-reported alcohol intake per day, and hemoglobin. Year of birth was categorized in 5-year intervals. Family income and social class were categorized into three levels: high, in-termediate, and low. Smoking status was categorized as never, former, or current smoker. Maximum alcohol con-sumption per day over the past week was categorized as not at all, 1, 2, and.2 units of alcohol per day. Hemoglobin was also included as a covariate because it may influence HbA1clevels (15) and
was analyzed as a continuous variable.
Statistical Analysis
Multiple imputation was applied to deal with missing outcome data. To obtain the most plausible values, the imputation
was performed on the underlying var-iables necessary to calculate the frailty scores. The method of imputation was adapted to the original nature of the outcome variable (binary, categorical, or continuous); imputed variables were thus categorized if needed to build the frailty scores. The imputed values of participants who died or were lost to follow-up were deleted. Missing data in the exposure variables (HbA1cand FG)
were not imputed. The percentage of missing data ranged from 0 to 59%. A missing-at-random mechanism was as-sumed, and the chained equations ap-proach was applied (16). Sixty imputed data sets were generated. The number of imputations was decided on the basis of the maximum percentage of missing data (17). All models were run sepa-rately in each of the 60 data sets. The final estimates and the corresponding SEs were calculated according to Ru-bin’s rules (18). To enhance readability, the methods and results from this point onward are described in the language applicable to a single data set analysis. However, all results presented in the tables were calculated according to the 60-fold multiple imputation procedure.
Frailty trajectories over age werefitted using linear mixed-effects models. Indi-vidual-specific random intercepts and slopes were included in the model. Age, HbA1c, and FG were centered for
better interpretability of the coefficient estimates. Separate models werefitted with diabetes, HbA1c, and FG as
expo-sures (fixed effects) at different levels of adjustment. Model 1 was outcome ad-justed for sex and birth cohort. Model 2 was model 1 further adjusted for HbA1c,
family income, social class, smoking sta-tus, alcohol consumption, hemoglobin, and diabetes medications. Model 3 was model 1 further adjusted for diabetes, family income, social class, smoking sta-tus, alcohol consumption, hemoglobin, and diabetes medication. Quadratic terms of continuous variables were in-cluded in the models. Interactions be-tween age and each exposure were included in the models to account for the effect of the exposure variable on change in frailty index over aging.
The same analysis sequence was re-peated after exclusion of frail partici-pants at baseline to reduce the potential influence of reverse causation. To assess the effect of cardiovascular disease (CVD)
(defined as self-reported myocardial in-farction, heart failure, or stroke) on the associations, an analysis stratified by base-line CVD was performed. Mice, mitml, and lme4 (mixed models) packages in R 3.3.0 were used.
RESULTS
From 9,432 participants in wave 2, 5,377 fulfilled the inclusion criteria and were included in this study (Supplementary Fig. 1). Ten years later in wave 7, 2,692 were still followed (50% of the baseline participants).
At baseline, 35% of participants were frail on the basis of the 36-FI. Table 1
shows baseline characteristics stratified by baseline diabetes. The median age of participants was 70 years (interquartile range 65, 77 years), 45% were men, and 12% had diabetes. From those who had diabetes, 82% were self-reported diagnoses.
Diabetes as Exposure
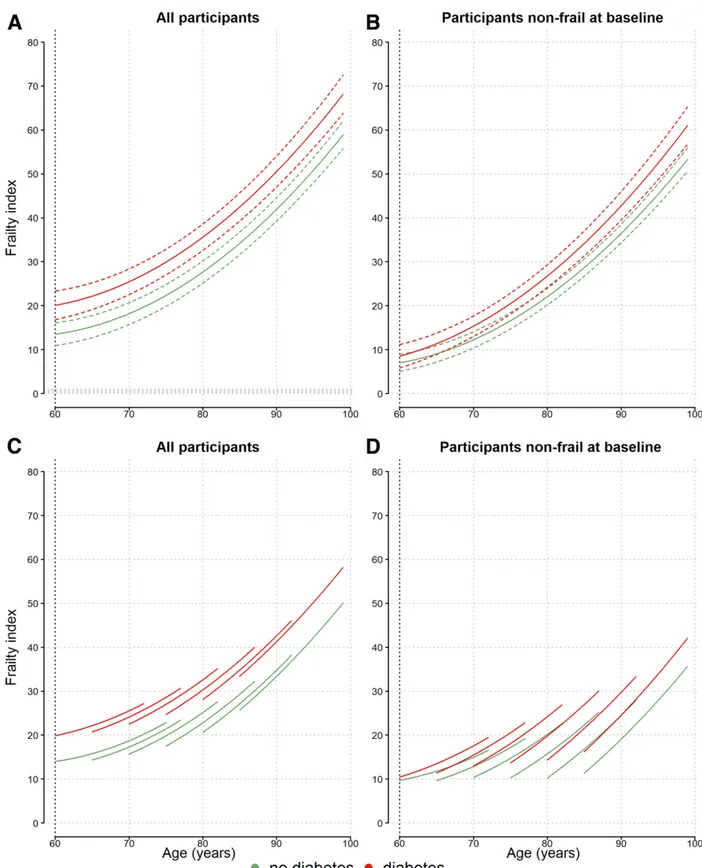
Figure 1 shows estimated frailty trajec-tories by baseline diagnosis of diabetes in the most adjusted model 2. At age 60 years and throughout the whole age range, the 36-FI was significantly higher in individuals with baseline diabetes. The diabetes-age interaction was not
Table 1—Baseline characteristics of 5,377 participants by diabetes diagnosis Characteristic No diabetes (n = 4,742) Diabetes* (n = 635)
Age (years) 70 (65, 77) 72 (66, 77) HBA1c(%)† 5.56 0.5 7.06 0.4 Glycemia (mmol/L)‡ 4.96 0.8 7.06 0.5 BMI (kg/m2) 27.56 4.8 30.16 4.8 Male 43 54 Antidiabetic drugs 0 57 Income Low 33 35 Middle 32 38 High 35 27 Social class Low 21 26 Middle 45 46 High 34 29 Smoking status Current 12 12 Former 51 57 Never 37 31
Maximum alcohol consumption
.2 units/day 19 12 2 units/day 17 11 1 unit/day 13 9 Not at all 51 68 Physical activity Low–sedentary 33 49 Moderate–high 67 51 Nutritional status§ Obesity 26 45 Overweight 44 39 Under/normal weight 29 16 CVD| 12 25 36-FI (units) 14 (8, 24) 22 (13, 25)
Phenotype of frailty (units) 27 (7, 47) 33 (20, 53)
EFS (units) 12 (6, 20) 18 (10, 27)
Frailty index (% frail) 32 53
Phenotype of frailty (% prefrail/% frail) 78/13 73/23
EFS (% frail) 10 19
Data are mean6 SD, median (interquartile range), or %. *Diabetes was defined as self-reported medical diagnosis, FG$7 mmol/L, or HbA1c$6.5% (48 mmol/mol). †No diabetes, n =
3,689; diabetes, n = 303.‡No diabetes, n = 2,217; diabetes, n = 65. §Under/normal-weight BMI#20 kg/m2, overweight BMI.20 to ,30 kg/m2; obese BMI$30 kg/m2.|Medical diagnosis
significant, which suggests that the dif-ferences in frailty between participants with and without diabetes remained constant during the follow-up period (Supplementary Table 2). Figure 1 also shows that although exclusion of partic-ipants with baseline frailty leads the frailty trajectories to start at a lower level, their progression with climbing age is somewhat steeper, and the dif-ference between participants with and without baseline diabetes remains pres-ent (Fig. 1B and D).
Figure 1A and B show estimated frailty trajectories for the birth cohort 1930–1934, while Fig. 1C and D show trajectories plotted for six different birth cohorts. At the same age, more-recent cohorts showed higher frailty levels, but the difference between those with and without diabetes was of similar magnitude.
Table 2 shows estimated values of the 36-FI by baseline diabetes. In model 1, the estimated level of frailty for a 60-year-old man with baseline diabetes was 17 (95% CI 15, 19). This value was similar to the estimated level of frailty for a 74-year-old man without baseline diabetes. Similar results were observed in women.
When adding possible confounders to the less-adjusted model with diabetes as exposure, the strength of the association between baseline diabetes and frailty status was attenuated by 9% when add-ing income and social class, 17% when adding smoking status and alcohol con-sumption, and 43% when adding hemo-globin and HbA1cto the model. Finally,
the strength of the association increased after adding the HbA1c-diabetes
inter-action to the model. When comparing among the three frailty scores, the results were similar for associations between exposures and frailty trajec-tories (Supplementary Table 2 and Supplementary Figs. 2–4).
HbA1cas Exposure
In model 1, with baseline levels of HbA1c
as exposure (Supplementary Table 2), a positive and significant association be-tween HbA1c level and frailty was
ob-served (b = 4.2 [95% CI 2.5, 5.9]). This means that higher levels of HbA1c at
baseline were associated with higher values of frailty. The HbA1c-age
interac-tion was positive and significant (b = 0.10 [95% CI 0.05, 0.15]), which indicates that
the differences increased over time (Fig. 2). In model 3, the overall HbA1c-frailty
association was not statistically signi fi-cant. However, the HbA1c-diabetes
in-teraction was negative for 36-FI. This suggests increased frailty with lower baseline HbA1c values (Fig. 2C and D)
in those with diabetes at baseline. Also in this model, the HbA1c-age interaction
was significant and positive, which means that the differences tended to increase over time. In participants with-out baseline diabetes, higher HbA1cwas
associated with higher frailty levels throughout the follow-up (Fig. 2A and B). In the nonfrail population, lower levels of HbA1c were associated with
higher levels of frailty (Supplementary Table 3). When adding possible con-founders to the HbA1c less-adjusted
model, the strength of the association baseline HbA1c and frailty status was
attenuated by 10% when adding income and social class; 36% when adding smoking status, alcohol consumption, and hemoglobin; and 114% when adding the HbA1c-diabetes interaction.
FG as Exposure
In models 1 and 3 with FG, no statisti-cally significant associations with frailty were observed. However, the quadratic FG and FG-diabetes interaction were significant with model 3, suggesting that there could be a nonlinear associ-ation in participants without baseline diabetes (Supplementary Table 2).
Stratification by CVD
At baseline, participants with CVD (n = 738) were more frail than those without CVD (n = 4,639). Baseline diabetes was only significantly associated with frailty in par-ticipants without CVD (Supplementary Table 4 and Supplementary Fig. 5). These differences did not amplify over time. Similarly, with model 1 and baseline HbA1cas exposure, there were significant
differences in frailty trajectories at differ-ent levels of baseline HbA1conly in
par-ticipants without CVD (Supplementary Table 4 and Supplementary Fig. 6). With model 3, HbA1clevels were not
associ-ated with frailty in any case. CONCLUSIONS
This study showed that baseline diabe-tes and higher HbA1clevels were
signif-icantly associated with higher frailty trajectories measured from age $60
years. Ourfinding of an association be-tween diabetes and frailty in a longitu-dinal setting, even after adjustment for potential confounders, indicates that people with diabetes experience higher levels of frailty during aging. These frailty levels broadly correspond to levels only reached more than a decade later by their peers without diabetes. Among nonfrail individuals at baseline, diabetes and higher levels of HbA1cwere
associ-ated with an accelerassoci-ated increase in frailty compared with participants with-out diabetes.
Although we did notfind studies eval-uating frailty trajectories as outcome, there are longitudinal studies associat-ing diabetes and frailty with results con-sistent with ours. Ottenbacher et al. (19) studied elderly Mexican Americans, evaluating a series of exposures of frailty, and found that diabetes at base-line was associated with higher frailty status 10 years later. Garc´ıa-Esquinas et al. (20) found a prospective associa-tion of baseline diabetes with incident frailty up to 3 years later. They also ob-served that the strength of the diabetes-frailty association was lower after adjustment for health behavior, abdom-inal obesity, comorbidity, and cardiome-tabolic biomarkers, suggesting that it is at least in part confounded by exposures or metabolic pathways shared between diabetes and frailty.
Indeed, the possibility exists that the association between diabetes and frailty in our study is still residually confounded, despite adjustment for multiple potential confounders. However, our primary aim was not to isolate the etiological role of glycemia for the development of frailty but to show to what degree patients with diabetes and even people with nondia-betic, intermediate glycemic levels expe-rience frailty in later life.
To explore the effect of relevant risk factors, we performed additional analy-ses, which showed attenuation of the strength of the association with income/ social class (9%). This suggests that these risk factors could be confounding varia-bles, although the results are still signif-icant in the more-adjusted model. The results of this study also show that participants with diabetes have a similar frailty level to participants without di-abetes who were 12 years older (Table 2), which is consistent with a study by Hubbard et al. (21).
Figure 1—Frailty trajectories (36-FI) by baseline diabetes in all 5,377 participants (frail and not frail at baseline) (A and C) and in 3,457 participants who were not frail at baseline (B and D). Model 2 was adjusted by HbA1c(5.5% [37 mmol/mol]), sex (men), birth cohort, family income (intermediate),
social class (middle), smoking status (former smoker), alcohol consumption (no alcohol), hemoglobin (15 mg/dL in men, 14 mg/dL in women), and diabetes medications (no). Continuous lines are estimates, and dotted lines are 95% CIs. Green lines indicate frailty trajectory for participants without baseline diabetes, and red lines indicate frailty trajectory for participants with baseline diabetes. Trajectories in A and B are plotted in the 1930–1934 birth cohort interval. Trajectories in C and D are plotted in six birth cohort intervals (1940–1945, 1935–1939, 1930–1934, 1925–1929, 1920–1924, and 1911–1919).
A possible explanation for the ob-served higher frailty levels seen in indi-viduals with diabetes is that diabetes and frailty have some common root causes, such as low socioeconomic status (22); low physical fitness, functioning, and activity (23); and presence of multi-morbidity (24). Diabetes and the ag-ing process share pathophysiological mechanisms, such as a chronic state of low-grade inflammation (25). Ad-vanced age is accompanied by an in-crease in the prevalence of sarcopenia, insulin resistance, and obesity. Sarco-penia is accentuated at higher levels of HbA1cand attenuated with the use of
insulin (26). In addition to this evi-dence, metabolic syndrome variables
and insulin resistance have been pro-spectively associated with the pheno-type of frailty score in a general elderly population (27).
The inverse phenomenondfrailty influencing diabetes progressiondis also possible. Veronese et al. (28) studied a cohort of elderly individuals and found that frailty was associated with a higher incidence of diabetes. They attributed these results to the fact that at baseline, frail individuals have a higher prevalence of diabetes risk factors, such as obesity. The under-lying mechanisms that could be involved are mediated by adipose tissue dys-function, where accelerated aging is driven by an increase in proinflammatory
cytokines, macrophage dysfunction, and increased oxidative stress (29). Further-more, frail individuals tend to have lower physical activity levels, which in turn leads to higher insulin resistance. Taken to-gether, the evidence suggests that the association between glycemia and frailty is likely to be bidirectional and may be due to shared determinants and under-lying pathophysiological pathways. How-ever, the complex ways in which these determinants and pathways act and affect each other remains difficult to disentangle. We found that when at baseline frail participants were excluded, diabetes was associated with faster frailty progression over time. Thisfinding should be inter-preted with caution. Although it could be regarded as consistent with diabetes or its treatments accelerating the develop-ment of frailty, it could also be due to regression to the mean, where our ex-clusion of those above a given frailty threshold has left a population more likely to have higher subsequent values, all else being equal. Furthermore, it should be noted that because our out-come measure has a ceiling value, those with low frailty values have more room to increase than those already at high levels. On the other hand, the effect of regression to the mean is likely to be limited to the first observation period after the baseline exclusion of frail in-dividuals, and differences in the latter part of the follow-up time are far less likely to be affected. It is possible that the steeper frailty trajectory observed during follow-up is mediated by or de-pends partly on the development of di-abetes complications. We did not have the possibility of studying this in detail.
Higher levels of HbA1cwere associated
with higher frailty over time. However, these effects were lost when adjusting for potential confounders. The interac-tion of diabetes-HbA1c, smoking status,
and alcohol had the maximum attenua-tion effects. This suggests that the effects are explained by the preceding con-founding factors.
In contrast, among people with dia-betes and at earlier ages, lower levels of HbA1cshowed a tendency of association
with higher levels of frailty (Fig. 2). Zaslavsky et al. (30) found a U-shaped relationship in the FG/HbA1c-frailty
in-teraction, with both extreme high and low levels associated with frailty. The cause of this is U-shaped relationship is
Table 2—Predicted values of 36-FI by sex, baseline diabetes diagnosis, and age
Age (years)
Men Women
No diabetes Diabetes No diabetes Diabetes Estimate (95% CI)* Estimate (95% CI)* Estimate (95% CI)* Estimate (95% CI)* Model 1† 60 10 (9, 11) 17 (15, 19) 12 (11, 13) 19 (18, 21) 62 10 (10, 11) 18 (16, 19) 13 (12, 14) 20 (18, 22) 64 11 (10, 12) 19 (17, 20) 14 (13, 15) 21 (19, 23) 66 12 (11, 13) 20 (18, 21) 15 (14, 16) 22 (21, 24) 68 13 (12, 14) 21 (20, 22) 16 (15, 17) 23 (22, 25) 70 15 (14, 16) 22 (21, 24) 17 (16, 18) 25 (24, 26) 72 16 (15, 17) 24 (23, 25) 19 (18, 19) 26 (25, 28) 74 18 (17, 19) 26 (25, 27) 20 (20, 21) 28 (27, 30) 76 20 (19, 21) 28 (27, 29) 22 (21, 23) 30 (29, 32) 78 22 (21, 23) 30 (29, 31) 24 (23, 25) 33 (31, 34) 80 24 (23, 25) 32 (31, 34) 27 (26, 27) 35 (33, 36) 82 26 (26, 27) 35 (33, 36) 29 (28, 30) 37 (36, 39) 84 29 (28, 30) 38 (36, 39) 32 (31, 33) 40 (39, 42) 86 32 (31, 33) 41 (39, 42) 34 (33, 35) 43 (41, 45) 88 35 (34, 36) 44 (42, 46) 37 (36, 38) 46 (44, 48) 90 38 (37, 39) 47 (45, 49) 41 (39, 42) 50 (47, 52) Model 2‡ 60 9 (8, 11) 16 (13, 19) 21 (17, 24) 42 (30, 53) 62 10 (8, 11) 17 (14, 20) 21 (18, 24) 42 (31, 54) 64 11 (9, 12) 18 (15, 20) 22 (19, 25) 43 (32, 55) 66 12 (10, 13) 19 (16, 21) 23 (20, 26) 44 (33, 56) 68 13 (11, 14) 20 (17, 23) 24 (21, 27) 46 (34, 57) 70 14 (13, 15) 21 (19, 24) 25 (22, 29) 47 (35, 59) 72 15 (14, 17) 23 (21, 26) 27 (24, 30) 49 (37, 60) 74 17 (16, 19) 25 (22, 28) 29 (25, 32) 50 (39, 62) 76 19 (18, 21) 27 (24, 30) 31 (27, 34) 53 (41, 64) 78 21 (20, 23) 29 (27, 32) 33 (29, 36) 55 (43, 66) 80 23 (22, 25) 32 (29, 34) 35 (32, 38) 57 (46, 69) 82 26 (24, 27) 34 (31, 37) 37 (34, 41) 60 (48, 71) 84 29 (27, 30) 37 (34, 40) 40 (37, 43) 63 (51, 74) 86 31 (30, 33) 40 (37, 43) 43 (40, 46) 66 (54, 77) 88 35 (33, 36) 43 (40, 46) 46 (43, 49) 69 (57, 80) 90 38 (36, 39) 47 (43, 50) 49 (46, 53) 72 (60, 84) *95% CI calculated according to Rubin’s rules. †Model 1: predictions for men and women of birth cohort 1930–1934. ‡Model 2: predictions for men and women of birth cohort 1930–1934 with an HbA1cof 5.5% (37 mmol/mol), intermediate family income, middle social class,
former smokers, alcohol abstinent, no diabetes medications, and a hemoglobin of 15 mg/dL in men and 14 mg/dL in women.
probably confounding by indication or reverse causation. For example, people with frailty may be monitored more
closely, leading to stricter glycemic con-trol, while individuals who are nonfrail may be treated less intensively. Another
possibility is that individuals who are frail may be more compliant with med-ication. Indeed, there is evidence that
Figure 2—Frailty trajectories (36-FI) at two different values of HbA1cin 5,377 participants. Model 3 was adjusted without baseline diabetes (A and B) and
with baseline diabetes (C and D), sex (men in A and C, women in B and D), birth cohort (1930–1934), family income (intermediate), social class (middle), smoking status (former smoker), alcohol consumption (no alcohol), hemoglobin (15 mg/dL in men, 14 mg/dL in women), and diabetes medications (no). Continuous lines are estimates, and dotted lines are 95% CIs. Green lines indicate frailty trajectory for participants with a baseline HbA1cof 5% (31 mmol/mol),
compliance with CVD medication in-creases when people with diabetes have more than one prescription (31).
We did notfind that FG was associated with frailty trajectories. One explanation of the stronger association seen with HbA1ccompared with FG is that HbA1c
is more strongly associated with diabetes comorbidities than FG (32). Also, in this study, FG had more missing data than HbA1c, which could have diluted the
results with FG. Finally, HbA1cmay
cap-ture the relevant exposure with more precision than FG. HbA1c reflects the
long-term average glycemic level and thus reflects the total glycemic exposure more closely than FG values, which represents a state most people experi-ence only for a few hours of the day. Our results differ from the results reported by Zaslavsky et al. (30), who showed a pro-spective association between FG and frailty 4–5 years later. These different results could be explained by the fact that Zaslavsky et al. combined the results of HbA1cand glycemia with Bayesian
meth-ods, while we analyzed FG and HbA1c
separately.
We observed that more-recent birth cohorts were more frail than older co-horts at the same age. This is consistent with a study by Yu et al. (33) in older individuals, reporting that the more re-cent cohorts had higher levels of frailty at a similar age. This observation could be at least partially due to selective loss to follow-up. For example, in older birth cohorts, frail individuals may have died much earlier, either before our study’s baseline or at the early stages of our follow-up window, while in the younger birth cohorts, frail individuals may be surviving much longer with frailty as a result of better care.
Thefinding that baseline diabetes was only significantly associated with frailty trajectories in participants without CVD and the fact that the exposure-frailty association only subsists in those without CVD indicates that CVD may be a mod-ifying factor in the association. In con-trast to participants without CVD, in participants with CVD, diabetes was not associated with an additional change of accelerated progression of frailty. Bouillon et al. (34) found that CVD risk scores measured in participants free of CVD were associated with future frailty. The mechanisms of these associations are related to the fact that CVD risk
factors and frailty have inflammatory processes in common that can lead to atherosclerosis as well as to accelerated catabolism associated with frailty (35). Similarfindings were observed for obesity status, with association observed mainly in nonobese participants. Taken together, these results suggest that diabetes in flu-ences frailty, particularly in those free of CVD events and who are nonobese.
This study has several strengths. It had a prospective design with frailty as a repeated measurement. Our ana-lytic approach took into account the dynamic nature of frailty by examining longitudinal trajectories. We used three different instruments to define frailty and found consistent results, strength-ening our confidence that the findings are not driven by one particular concept of frailty. The main results concerning diabetes, HbA1c, and FG were
consis-tent with the three frailty scores, sup-porting the notion that the results of this study apply to the general concept of frailty rather than to a specific opera-tionalization. ELSA is a high-quality data set that integrates many dimensions, such as physical and mental health, determinants/risk factors, and social and economic aspects. ELSA is a large repre-sentative sample of the English elderly population with repeated measures of subjective/objective variables and bio-markers relevant to frailty and the aging process. It is one of the best available longitudinal data sources to address our research questions.
The study also has some limitations. Some variables were not collected con-sistently across waves. In these cases, we used the most similar variable in the analysis. We could not differentiate be-tween type 1 and type 2 diabetes, al-though type 1 diabetes constitutes a minority of cases in elderly populations (36). A further limitation is that we could not include some relevant variables in the adjusted models because they were also part of the 36-FI. In addition, no information on diet was available at baseline, precluding us to account for this covariate in the analysis. A final limitation was the missing data, which could be a source of bias. However, we tried to deal with this issue by applying multiple imputation and fitting mixed-effects models (37). Our results are mostly generalizable to general elderly populations of European origin because
ELSA included very few participants of non-European origin.
To conclude, this study suggests that di-abetes is associated with increased frailty in an elderly population. These results highlight the relevance of a timely diabe-tes diagnosis because of the likelihood of a faster increasing frailty trajectory than among individuals without diabetes (38). Future research should examine the cau-sality and mechanisms of this association.
Acknowledgments. The authors thank Prof. Stephen Senn (Competence Center for Method-ology and Statistics, Luxembourg Institute of Health, Strassen, Luxembourg) for his contribu-tion to this study. The authors thank the UK Data Archive for supplying the ELSA data. ELSA was developed by a team of researchers based at University College London, the Institute of Fis-cal Studies, and the National Centre for Social Research (data sharing project number 82538). Funding. This work was supported by the Ministry of Higher Education and Research of Luxembourg through an internal project (number 20140511) from the Luxembourg Institute of Health (funding G.A.A.). A.H. and D.R.W. are supported by the Danish Diabetes Academy, which is funded by the Novo Nordisk Foundation. The data creators or the funders of the data collection and the UK Data Archive do not bear any responsibility for the analyses or interpre-tations presented here. The funders had no role in study design, data collection and analy-sis, decision to publish, or preparation of the manuscript.
Duality of Interest. No potential conflicts of interest relevant to this article were reported. Author Contributions. G.A.A. researched data, performed the data analysis, and wrote the manuscript. A.H. developed the analytic design. A.H., M.T.V., A.-F.D., A.S., and S.Sa. contributed to the data analysis and reviewed/edited the manuscript. S.St., L.M., and L.H. reviewed/ edited the manuscript. M.G. contributed to the conceptualization of the study. D.R.W. had the idea for the study, developed the analytical design, and contributed to the data analysis, discussion, writing of the man-uscript, and review/editing of the manuscript. G.A.A. is the guarantor of this work and, as such, had full access to all the data in the study and takes responsibility for the integrity of the data and the accuracy of the data analysis. Prior Presentation. Parts of this study were presented in oral form at the European Diabetes Epidemiology Group Annual Meeting 2018, Elsinore, Denmark, 21–24 April 2018.
References
1. Kivim¨aki M, Ferrie JE. Epidemiology of healthy ageing and the idea of more refined outcome measures. Int J Epidemiol 2011;40:845–847 2. Kalyani RR, Golden SH, Cefalu WT. Diabetes and aging: unique considerations and goals of care. Diabetes Care 2017;40:440–443 3. Gobbens RJ, Luijkx KG, Wijnen-Sponselee MT, Schols JM. Toward a conceptual definition of frail
community dwelling older people. Nurs Outlook 2010;58:76–86
4. Collard RM, Boter H, Schoevers RA, Oude Voshaar RC. Prevalence of frailty in community-dwelling older persons: a systematic review. J Am Geriatr Soc 2012;60:1487–1492
5. Mitnitski AB, Mogilner AJ, Rockwood K. Ac-cumulation of deficits as a proxy measure of aging. ScientificWorldJournal 2001;1:323–336 6. Fried LP, Tangen CM, Walston J, et al.; Car-diovascular Health Study Collaborative Research Group. Frailty in older adults: evidence for a phenotype. J Gerontol A Biol Sci Med Sci 2001; 56:M146–M156
7. Rolland Y, Dupuy C, Abellan van Kan G, Gillette S, Vellas B. Treatment strategies for sarcopenia and frailty. Med Clin North Am 2011;95:427–438, ix
8. Yanase T, Yanagita I, Muta K, Nawata H. Frailty in elderly diabetes patients. Endocr J 2018;65:1– 11
9. Steptoe A, Breeze E, Banks J, Nazroo J. Cohort profile: the English longitudinal study of ageing. Int J Epidemiol 2013;42:1640–1648
10. Searle SD, Mitnitski A, Gahbauer EA, Gill TM, Rockwood K. A standard procedure for creating a frailty index. BMC Geriatr 2008;8:24 11. Rolfson DB, Majumdar SR, Tsuyuki RT, Tahir A, Rockwood K. Validity and reliability of the Edmonton Frail Scale. Age Ageing 2006;35:526– 529
12. Aguayo GA, Donneau AF, Vaillant MT, et al. Agreement between 35 published frailty scores in the general population. Am J Epidemiol 2017; 186:420–434
13. Aguayo GA, Vaillant MT, Donneau AF, et al. Comparative analysis of the association between 35 frailty scores and cardiovascular events, can-cer, and total mortality in an elderly general population in England: an observational study. PLoS Med 2018;15:e1002543
14. Bouillon K, Kivimaki M, Hamer M, et al. Measures of frailty in population-based studies: an overview. BMC Geriatr 2013;13:64 15. Christy AL, Manjrekar PA, Babu RP, Hegde A, Rukmini MS. Influence of iron deficiency anemia on hemoglobin A1c levels in diabetic individuals with controlled plasma glucose levels. Iran Bi-omed J 2014;18:88–93
16. Van Buuren S, Brand JPL, Groothuis-Oudshoorn CGM, Rubin DB. Fully conditional
specification in multivariate imputation. J Stat Comput Simul 2006;76:1049–1064
17. White IR, Royston P, Wood AM. Multiple imputation using chained equations: issues and guidance for practice. Stat Med 2011;30:377–399 18. Rubin DB. Multiple Imputation for Nonre-sponse in Surveys. Hoboken, NJ, John Wiley & Sons, 2004
19. Ottenbacher KJ, Graham JE, Al Snih S, et al. Mexican Americans and frailty:findings from the Hispanic established populations epidemiologic studies of the elderly. Am J Public Health 2009; 99:673–679
20. Garc´ıa-Esquinas E, Graciani A, Guallar-Castill ´on P, L ´opez-Garc´ıa E, Rodr´ıguez-Ma~nas L, Rodr´ıguez-Artalejo F. Diabetes and risk of frailty and its potential mechanisms: a prospec-tive cohort study of older adults. J Am Med Dir Assoc 2015;16:748–754
21. Hubbard RE, Andrew MK, Fallah N, Rockwood K. Comparison of the prognostic im-portance of diagnosed diabetes, co-morbidity and frailty in older people. Diabet Med 2010; 27:603–606
22. Hoogendijk EO, Rijnhart JJM, Kowal P, et al. Socioeconomic inequalities in frailty among older adults in six low- and middle-income countries: results from the WHO Study on global AGEing and adult health (SAGE). Maturitas 2018; 115:56–63
23. Rogers NT, Marshall A, Roberts CH, Demakakos P, Steptoe A, Scholes S. Physical activity and trajectories of frailty among older adults: evidence from the English Longitudinal Study of Ageing. PLoS One 2017;12:e0170878 24. Hanlon P, Nicholl BI, Jani BD, Lee D, McQueenie R, Mair FS. Frailty and pre-frailty in middle-aged and older adults and its associ-ation with multimorbidity and mortality: a prospective analysis of 493 737 UK Biobank participants. Lancet Public Health 2018;3: e323–e332
25. Perkisas S, Vandewoude M. Where frailty meets diabetes. Diabetes Metab Res Rev 2016; 32(Suppl. 1):261–267
26. Kalyani RR, Corriere M, Ferrucci L. Age-related and disease-Age-related muscle loss: the effect of diabetes, obesity, and other diseases. Lancet Diabetes Endocrinol 2014;2:819–829 27. P ´erez-Tasigchana RF, Le ´on-Mu~noz LM, Lopez-Garcia E, et al. Metabolic syndrome and
insulin resistance are associated with frailty in older adults: a prospective cohort study. Age Ageing 2017;46:807–812
28. Veronese N, Stubbs B, Fontana L, et al. Frailty is associated with an increased risk of incident type 2 diabetes in the elderly. J Am Med Dir Assoc 2016;17:902–907
29. Stout MB, Justice JN, Nicklas BJ, Kirkland JL. Physiological aging: links among adipose tissue dysfunction, diabetes, and frailty. Physiology (Bethesda) 2017;32:9–19
30. Zaslavsky O, Walker RL, Crane PK, Gray SL, Larson EB. Glucose levels and risk of frailty. J Gerontol A Biol Sci Med Sci 2016;71:1223– 1229
31. Jensen ML, Jørgensen ME, Hansen EH, Aagaard L, Carstensen B. Long-term patterns of adherence to medication therapy among patients with type 2 diabetes mellitus in Den-mark: the importance of initiation. PLoS One 2017;12:e0179546
32. Selvin E, Crainiceanu CM, Brancati FL, Coresh J. Short-term variability in measures of glycemia and implications for the classification of diabetes. Arch Intern Med 2007;167:1545– 1551
33. Yu R, Wong M, Chong KC, et al. Trajectories of frailty among Chinese older people in Hong Kong between 2001 and 2012: an age-period-cohort analysis. Age Ageing 2018;47:254–261 34. Bouillon K, Batty GD, Hamer M, et al. Car-diovascular disease risk scores in identifying future frailty: the Whitehall II prospective cohort study. Heart 2013;99:737–742
35. Newman AB, Gottdiener JS, Mcburnie MA, et al.; Cardiovascular Health Study Research Group. Associations of subclinical cardiovascular disease with frailty. J Gerontol A Biol Sci Med Sci 2001;56:M158–M166
36. Xu G, Liu B, Sun Y, et al. Prevalence of diagnosed type 1 and type 2 diabetes among US adults in 2016 and 2017: population based study. BMJ 2018;362:k1497
37. Stolz E, Mayerl H, R´asky ´E, Freidl W. Does sample attrition affect the assessment of frailty trajectories among older adults? A joint model approach. Gerontology 2018;64:430– 439
38. Morley JE, Malmstrom TK, Rodriguez-Ma~nas L, Sinclair AJ. Frailty, sarcopenia and diabetes. J Am Med Dir Assoc 2014;15:853–859