HAL Id: hal-01008686
https://hal.archives-ouvertes.fr/hal-01008686
Submitted on 4 May 2018
HAL is a multi-disciplinary open access
archive for the deposit and dissemination of
sci-entific research documents, whether they are
pub-lished or not. The documents may come from
teaching and research institutions in France or
abroad, or from public or private research centers.
L’archive ouverte pluridisciplinaire HAL, est
destinée au dépôt et à la diffusion de documents
scientifiques de niveau recherche, publiés ou non,
émanant des établissements d’enseignement et de
recherche français ou étrangers, des laboratoires
publics ou privés.
Probabilistic modeling of the bio-colonization effects on
hydrodynamic forces with several combinations of
sea-state condition: a study on jacket-platforms in the
Gulf of Guinea
Franck Schoefs, Hamed Ameryoun
To cite this version:
Franck Schoefs, Hamed Ameryoun. Probabilistic modeling of the bio-colonization effects on
hydrody-namic forces with several combinations of sea-state condition: a study on jacket-platforms in the Gulf
of Guinea. ASME 2013 32nd International Conference on Ocean, Offshore and Arctic Engineering,
Jun 2013, Nantes, France. �10.1115/OMAE2013-11100�. �hal-01008686�
PROBABILISTIC MODELING OF THE BIO-COLONIZATION EFFECTS ON
HYDRODYNAMIC FORCES WITH SEVERAL COMBINATIONS OF SEA-STATE
CONDITION: A STUDY ON JACKET-PLATFORMS IN THE GULF OF GUINEA
SCHOEFS Franck and AMERYOUN Hamed
LUNAM Université, Université de Nantes-Ecole Centrale Nantes, GeM, Institute for Research in Civil and Mechanical Engineering/Sea and Littoral Research Institute, CNRS UMR 6183/FR 3473, Nantes,
France- Corresponding author: Franck.Schoefs@univ-nantes.fr France Ph.: +33 (0) 2.51.12.55.22
franck.schoefs@univ.nantes.fr hamed.ameryoun@univ-nantes.fr
ABSTRACT
During the stage of designing or re-assessment of a jacket-type offshore structure, one of the most important phases is the re-evaluation of environmental loads, which are exerted by the waves, the wind and the currents, and updating the new data (e.g. meteocean, new regulation, structural damaging etc.). The former is mainly caused by the randomness or uncertainty nature of the marine environment as well as the presence of marine growth that makes the modeling of environmental loading more complicated. The general species of marine growth may be divided into two main categories: vegetable (e.g. algae) and animal (e.g. mussel, anemones, and corals). Indeed, the structures can be covered by many marine organisms quickly (in the first weeks). The influence of bio-colonization on an offshore structure can be measured at several levels: obstruct or prohibits a visual inspection of the subjacent support, cost of procedures of cleaning for oil industries and increasing the hydrodynamic forces on the structure. Considering the latter, loading change due screen effect and added mass are shown to be the most relevant. This study aims to provide a probabilistic modeling of marine growth colonization in the Gulf of Guinea. A physical matrix response surface is used in view to provide a probabilistic modeling of the environmental loading on Jacket type offshore structures for quasi-static behavior in the presence of marine growth. The paper focuses on uncertainty and sensitivity studies respecting to the effects of wave, wind-sea and currents.
INTRODUCTION
Since recent decades, reassessment of offshore structures is one of the major operational challenges. It leads to update design hypothesis which deals with topics such as structural behavior, environmental loadings and structural integrity. This study aims to take place on the actual challenge for the reanalysis and lifetime enhancement of existing fixed offshore platforms, so-called jackets, where the uncertainties should be controlled based on the analysis of inspection reports. Two types of questions are generally addressed in the literature for jacket-type offshore structures: crack detection and measurement, e.g. in [8, 17], or assessment of marine growth colonization. This study focuses on analyze the effect of the latter and the quasi-static behavior of jackets.
Biocolonization on offshore structures is of major importance as it can increase the screen effect and hence modifies the regime flow around the structures. Firstly, this study reviews the major effects of marine growth on offshore structures, and then the key factors of marine growth modeling in structural analysis.
Some illustrative parts of the study i.e. the presentation of specificity of the study case in the Gulf of Guinea, probabilistic models such as extreme wave heights and periods and currents, modeling of marine growth roughness and finally the effect of environmental conditions and marine growth are addressed in this paper. This study has been focused on drag forces on vertical cylindrical members under the wave crest. Monte-Carlo
simulations are performed in the last section for the probabilistic analysis.
GENERAL EFFECTS OF MARINE GROWTH ON JACKET PLATFORMS
When a structure is immersed in the seawater, it is rapidly covered by the unavoidable marine organisms. Its nature and growth are complex phenomena and a lot remains misunderstood. The structures which are partially built afloat or transported to the exploitation site may have the larvae of marine organisms attached before they arrived at their installation locations [1]. Then geographical location, distance from the shore, soil nature, the water depth, building material including coatings and the type of structure, waves, water currents, nutrients availability, physicochemical parameters of seawater, presence of protection systems, human activities, and the date of platform installation in relation with the date of release of spores and larvae will affect the bio-fouling nature and growth rate [2]. The superposition and competition of these mechanisms make the marine growth modeling still a challenge for actual research. Recent measurements [3] demonstrate that marine growth thickness may be considerable (up to 150 mm) depending on geographical site locations. They may have a significant impact on logistics and cost of structural inspections and operational maintenance programs.
The marine growth can damage underlying hard substrata through some mechanisms such as mechanical degradation, chemical degradation and bacterial activities associated with specific micro-environments that are created by marine growth. The mentioned damage can be caused by recurring cleaning of structures, the action of storms, bacterial activities associated with specific microenvironments created by marine organisms or the presence of cathodic protection devices that are typically used to protect metal platforms against the corrosion [4, 5]. The quantification of damage caused is generally unknown and it is not revealed in the existing investigations [6].
Structural effects of marine growth on jacket platforms
Marine growth may have a number of effects on the structural characteristics of offshore structures depending on the type, amount, and position of the growth. The major structural effects of marine growth are: 1) obscuring the substratum, 2) adding to weight loading 3) modifying hydrodynamic loading, 4) creating micro-environments which may encourage corrosion, and 5) causing physical obstruction for instance by blocking or restricting seawater intakes. Most soft marine growths have a specific gravity close to the seawater; therefore, they contribute little to weight loading. However, organisms with hard calcareous shells, plates or tubes, can add significantly to the weight and static loading. Both soft and hard fouling can result in three basic changes to members. They increase dimensions, added mass, and surface roughness of the members that result in changes to structural loading which can be classified into four sections: 1) effect of increasing diameter on drag and inertia loading, 2) effect of increasing roughness on drag and inertia loading, 3) effect of
mass of growth on structural natural period, and 4) effect of increasing the drag loading on structural damping. Moreover, changes of the forces on the structural members can also affect the fatigue life of tubular joints [36].
Mostly, any change in the amount or distribution of mass in a structure can affect the natural period of the structure. Therefore, in many offshore structures, changing the natural frequency of the structure will modify the dynamic amplification effects and consequently the stresses to be designed for. It is necessary to consider the extra mass of the marine growth and the extra mass plus added mass resulting from the entrained water, to estimate the effect of marine growth on the dynamic behavior of an offshore structure.
The total damping on a jacket structure includes contributions to the structural and the hydrodynamic damping. The hydrodynamic damping forces increase with increasing member diameter and surface roughness of members. Therefore, the marine growth will modify hydrodynamic damping.
Effect of diameter increasing on hydrodynamic loadings
The colonization process is very complex and results in a large diversity of marine growth type (animal, vegetal - hard, soft) and species. The competition for access to food and/or light leads to a stratification of heterogeneous layers on the structural members. The consequence is an increase of diameter and thus increasing of the hydrodynamic loadings. Note that it also creates a mask for inspections of the structure and increase the cost of cracks detection [8]. Moreover, it is clearly illustrated that the increasing thickness of marine growth can lead to decrease of the natural frequencies for all the Eigen modes of the support structure (especially in the third fore-aft and side-to-side tower frequencies and torsion frequencies) [9].
KEY FACTORS FOR MODELING OF MARINE GROWTH IN STRUCTURAL ANALYSIS
The Morison equation is employed usually, to estimate the hydrodynamic forces on offshore structures such as jackets, from medium water depth to the deep, and considering the wave heights and periods of the field and particle kinematics.[10]. It was developed to model the hydrodynamic force exerted on a body in a viscous fluid under oscillatory flow conditions. It has been shown to be very suitable for an expansion in the stochastic domain [11].
Hydrodynamic forces, which act on a jacket offshore structure, are not only related to the kinematics and dynamics of water particles in the presence of waves, but also they are affected by the presence of currents, including the water surface. The Morison's equation is often used to apply the principle of linear superposition to predict the hydrodynamic forces in the presence of swell and current.
Furthermore, marine growth can result in increasing of the surface roughness and hence changes in both of the drag and inertia coefficients being linked to the hydrodynamic forces across Morison equation [10]. Their variations induced by the presence of marine growth and affect the hydrodynamic forces
in non-linear way. The percentage of coverage also affects the hydrodynamic coefficients and hence the forces, especially for percentage smaller than 25% [12].
Assumptions used for measurement of marine growth process on loads computation
The calculation of offshore structures,
so-particularly refers to their behavior under extreme environmental conditions (e.g. storm), which the statistical characteristics of 100 year-return wave and current is considered. To address the issue of the evaluation of hydrodynamic forces in quasi-static, it is nece
several points: 1) modeling of the weather
conditions, which has an important role on the behavior of offshore structures, 2) the chosen calculation model of effort, and 3) modeling of the water particle kinematics of the fie that links two previous points [6].
Depending on the region where the offshore field is located and the history of the structure [3], the colonization process leads to very complex stochastic process. The available models lie on marginal distributions given at several depths where the maximum and minimum values were supposed to occur and which statistical moments (mean and standard deviation mainly) vary with the time. Available models are given by Picken [13], Pipe [14] and Theophanatos [12
Sankalpa [15] for Indian Offshore Waters, by Sharma [ Santa-Barbara Channel, and finally by Boukinda [ the Guinea.
Key role of marine growth on wave loading response surface
Let us focus now on the probabilistic modeling of growth from inspection data collected by divers or ROV. The inspection data of marine structures is the necessary information for the oil operators to optimize its plans for Inspection Maintenance programs but also to advocate the values for the design of structures [17,8]. However, methods of data collection of bio-fouling e.g. the
percentage of coverage and the roughness,
the discretion of human in situ measurements are often surrounded by uncertainties that are difficult to quantify. The average thickness of bio-fouling is deduced by a simple treatment of the percentage of coverage and the size of fouling. The average thickness of hard and soft organisms should be calculated separately. The homogenized thicknes
marine growth ( ) is calculated as bellow [18
1
(
)
100
n i i i hC
h
t
=×
=
∑
Where n is number of the groups of marine
percentage of coverage, is the average height (both correspond to group number i).
linear way. The percentage of coverage also affects the hydrodynamic coefficients and hence the forces, especially for
Assumptions used for measurement of marine growth process on loads computation
-called quasi-static, refers to their behavior under extreme environmental conditions (e.g. storm), which the statistical return wave and current is considered. To address the issue of the evaluation of static, it is necessary to consider several points: 1) modeling of the weather-oceanography conditions, which has an important role on the behavior of offshore structures, 2) the chosen calculation model of effort, and 3) modeling of the water particle kinematics of the field Depending on the region where the offshore field is located and the history of the structure [3], the colonization process leads to very complex stochastic process. The available models iven at several depths where the maximum and minimum values were supposed to occur and which statistical moments (mean and standard deviation mainly) vary with the time. Available models are given by 12] for North sea, by ] for Indian Offshore Waters, by Sharma [16] for Barbara Channel, and finally by Boukinda [6] for Gulf of
Key role of marine growth on wave loading response
Let us focus now on the probabilistic modeling of marine growth from inspection data collected by divers or ROV. The inspection data of marine structures is the necessary to optimize its plans for Inspection Maintenance programs but also to advocate the ]. However, methods of e.g. the thickness, length, that are subject to the discretion of human in situ measurements are often e difficult to quantify. The fouling is deduced by a simple treatment of the percentage of coverage and the size of fouling. The average thickness of hard and soft organisms should be calculated separately. The homogenized thickness of hard
18]:
(1)
groups of marine growth, Ci is the
is the average height (both
Soft organisms pose many problems in the calculation of reliability. Their physical characteristics are taken into account with difficulty in common modeling.
overcome this difficulty is to calculate a compressed thickness value which is an estimation of the average thickness when all the organisms are flattened on the structures. The homogenized compressed thickness of soft fouling (
follows: 1
(
)
n i st
=
=∑
Where, CTF (Compress Thick
compress thickness to the extended length or size of the representative organisms within the group [
under moderate and extreme conditions. a CTF equals to 1 indicates the
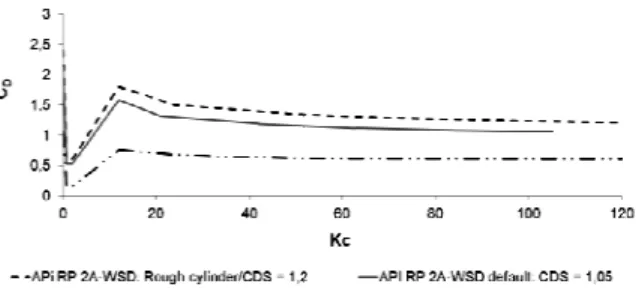
In case of the post-critical regimes, several authors and API [19] recommendations suggest a non
between KC and hydrodynamic coefficients [
illustrates the digitized curves obtained from those recommended by API [19] for 3 drag coeffici
(CDS). It appears clearly that the transfer obtained for North Sea
conditions where KC>60 is different with the one obtained for low values of KC such as the Gulf of Guinea. In this last case, the transfer is strongly non linear and lea
environmental conditions to multi [35]. Then the probabilistic modeling of
hydrodynamic coefficients cannot be considered as independent from the vector of variables <
probabilistic assumptions away from classical ones where normally distributed and independent from
the reason why we suggest direct simulations through hypercube sampling in the following for deducing distributions of drag and inertia coefficients. Comparison between two different sites (North Sea and Gulf of Guinea) is presented in [21].
Figure 1. Relationship between C
STUDY CASE IN THE GU Specificity of Gulf of Guinea
The Gulf of Guinea gathers quite a lot of specific issues in terms of:
Role of Wind Sea,
Soft organisms pose many problems in the calculation of reliability. Their physical characteristics are taken into account with difficulty in common modeling. A possible way to overcome this difficulty is to calculate a compressed thickness value which is an estimation of the average thickness when all the organisms are flattened on the structures. The homogenized compressed thickness of soft fouling ( ) is calculated as
1
(
)
100
i iC
× ×
h
CTF
∑
(2) (Compress Thickness Factor) is the ratio of compress thickness to the extended length or size of the representative organisms within the group [2]. It is determined under moderate and extreme conditions. It should be Noted thatequals to 1 indicates the incompressible bodies.
critical regimes, several authors and API ] recommendations suggest a non-linear relationship between KC and hydrodynamic coefficients [12, 20]. Figure 1 the digitized curves obtained from those ] for 3 drag coefficients in steady flow ). It appears clearly that the transfer obtained for North Sea >60 is different with the one obtained for such as the Gulf of Guinea. In this last case, the transfer is strongly non linear and leads for particular environmental conditions to multi-modal distributions of CD
[35]. Then the probabilistic modeling of CD is complex and
hydrodynamic coefficients cannot be considered as independent from the vector of variables <H, T, th>. These results move probabilistic assumptions away from classical ones where CD is
normally distributed and independent from H and T [10]. That’s the reason why we suggest direct simulations through hypercube sampling in the following for deducing distributions inertia coefficients. Comparison between two different sites (North Sea and Gulf of Guinea) is presented in
igure 1. Relationship between CD and KC for three values of CDS.
STUDY CASE IN THE GULF OF GUINEA Specificity of Gulf of Guinea
High velocities of the currents, Large thickness of marine growth.
Let us first consider meteocean conditions. The role of high frequencies in the spectral analysis has been re highlighted [22, 23]; Thus bimodal spectra must be considered. Moreover the velocity of current reaches the ones of water particles due to wave moving. The
wave-cannot be neglected. Finally the thickness of marine growth is high [18].
Biofouling species in the Gulf of Guinea
In the Gulf of Guinea, there are numerous types of marine growth that we can also find on offshore structures in other parts of the world. Indeed, some species which colonize structures are not influenced by geographical location but simply by physicochemical factors such as temperature and salinity.
The more representative hard fouling organisms are corals and barnacles. The growth of corals is favored by ideal environmental conditions to their developments ( temperature of seawater, intense action of waves, clear water and profusion of nutrients, etc.). The colonization of corals is particularly important between the surface and about 50 m in depth but the covering can also be significant in deeper wate Barnacles are one of the frequent biological fouling organisms that we can find on oil sites located in the North
Mexico, Japan coasts, etc. Their proliferation is not limited by the geographical factors.
When we consider soft fouling organisms,
(brown and green), hydroids and bryozoans are major species. They are present in all water depths and colonize all maritime regions (cold or warm). Their geographic distribution is not influenced by the temperature and the rate of sali
also be present in all types of water depths.
The other species present on offshore structures are sponges, tubeworms, anemones, oysters, and sea urchin. They are in small proportion and colonize offshore structures in a marginal way [18].
Presentation of the study case
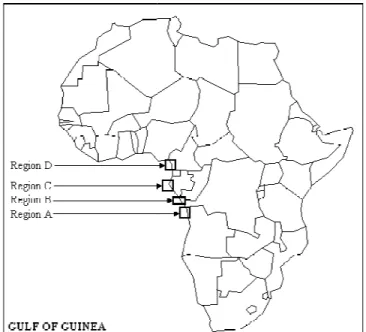
Let us consider a jacket platform placed in a water depth of 30 meters in the region C presented in Figure
the drag forces on a vertical component under the wave crest with diameter of 0.762m which corresponds to t
a Ф30'' pile. In region C it has been shown [18] that the corals are dominant. From picture analysis, we have estimated the roughness: k=60 mm. The model for evolution of the thickness is presented in Figure 3. Both of the linear model sugge [18] and measured thicknesses are reported. Almost 80% of data are in the range +/-2σ around the mean trend. Thus this range is selected for the basis of the support of a symmetrical triangular probability density function. This distribution is one of the distributions that allows to model positive values.
Let us first consider meteocean conditions. The role of high frequencies in the spectral analysis has been recently Thus bimodal spectra must be considered. Moreover the velocity of current reaches the ones of water -current interaction cannot be neglected. Finally the thickness of marine growth is
Biofouling species in the Gulf of Guinea
In the Gulf of Guinea, there are numerous types of marine growth that we can also find on offshore structures in other parts of the world. Indeed, some species which colonize geographical location but simply by physicochemical factors such as temperature and The more representative hard fouling organisms are corals and barnacles. The growth of corals is favored by ideal environmental conditions to their developments (warmer temperature of seawater, intense action of waves, clear water and profusion of nutrients, etc.). The colonization of corals is particularly important between the surface and about 50 m in depth but the covering can also be significant in deeper water. Barnacles are one of the frequent biological fouling organisms the North-Sea, Gulf of Mexico, Japan coasts, etc. Their proliferation is not limited by nisms, e.g. seaweeds (brown and green), hydroids and bryozoans are major species. They are present in all water depths and colonize all maritime regions (cold or warm). Their geographic distribution is not influenced by the temperature and the rate of salinity. They can The other species present on offshore structures are sponges, tubeworms, anemones, oysters, and sea urchin. They are in small proportion and colonize offshore structures in a
Let us consider a jacket platform placed in a water depth of ure 2. We focus on drag forces on a vertical component under the wave crest 0.762m which corresponds to the diameter of it has been shown [18] that the corals are dominant. From picture analysis, we have estimated the =60 mm. The model for evolution of the thickness is presented in Figure 3. Both of the linear model suggested in [18] and measured thicknesses are reported. Almost 80% of around the mean trend. Thus this range is selected for the basis of the support of a symmetrical triangular probability density function. This distribution is one of the distributions that allows to model positive values.
Figure 2. Studied regions in Gulf of Guinea.
It should be ensured that the model is representative of the reality of the mechanical or physical phenomenon studied. As a part of this study, this
representative sampling of the variables H and T that mainly characterizes the wave model. Two methods have been used to accomplish the samples: direct random sampling (Monte Carlo) and Latin Hypercube method.
Figure 3. Evolution of thickness with time.
PROBABILISTIC MODEL EXTREME WAVE HEIGHTS
Current is assumed in this study to be independent of
T. This is probably not a realistic assumption but no data are
actually available to confirm or inf
assume a simple summation rule of the velocities with the same heading for wave-current interaction. However, it has been shown in [3], that the annual distribution of current maximizes the structural response if we consider a 10
of the loading. This distribution of current velocity near the surface is presented in Figure 4.
Figure 2. Studied regions in Gulf of Guinea.
It should be ensured that the model is representative of the reality of the mechanical or physical phenomenon studied. As a part of this study, this validation passes through a representative sampling of the variables H and T that mainly characterizes the wave model. Two methods have been used to accomplish the samples: direct random sampling (Monte Carlo) and Latin Hypercube method.
tion of thickness with time.
PROBABILISTIC MODEL OF CURRENT AND EXTREME WAVE HEIGHTS AND PERIODS
Current is assumed in this study to be independent of H and . This is probably not a realistic assumption but no data are actually available to confirm or infirm it. For simplicity, we assume a simple summation rule of the velocities with the same current interaction. However, it has been shown in [3], that the annual distribution of current maximizes the structural response if we consider a 100 years return period of the loading. This distribution of current velocity near the surface is presented in Figure 4.
Figure 4. Distribution of current velocity.
Considering a scatter-plot, each term of the probability occurrence of the pair (H
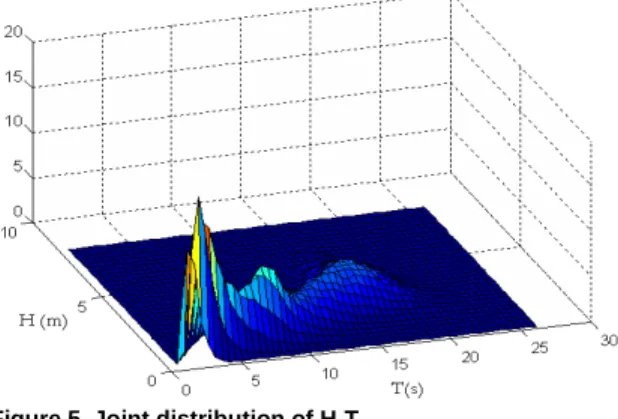
Hypercube consists in cutting support distributions in equiprobable ranges. Here, the probability of occurrence of each 2-D range is known and we achieved a draw for a number of proportional values to this range. The draw is so equally distributed (or uniformed) according to H with a random range of corresponding T. As an advantage of this approach, no truncation of the supports is necessary to meet the physical values and any achievement is an observable quantity. Figure 5 provides a representation of the joint distribution from the extreme height and period for a return period of 100
given wave heading. It can be obtained after recombination of sea-states from the knowledge of Hs-Tp scatter diagram that its
method is presented in [23]. For small periods, wave length are not compatible with the assumptions of Morison equations (De<0.2L). In this study, it leads to the operational constraint
for the period T: T>0.93s. A truncature of the support of period distribution is then realized for simulations. It leads to conservative results because of corresponding wave heights, thus forces are fair in this case.
Figure 5. Joint distribution of H-T.
Figure 6 illustrates the iso-probable contours of the scatter diagram and the achievements made by random that are good fit.
plot, each term of pij corresponds to
Hi, Tj). The Latin
Hypercube consists in cutting support distributions in equiprobable ranges. Here, the probability of occurrence of range is known and we achieved a draw for a number portional values to this range. The draw is so equally with a random range . As an advantage of this approach, no truncation of the supports is necessary to meet the physical ement is an observable quantity. Figure 5 provides a representation of the joint distribution from the extreme height and period for a return period of 100 years for a obtained after recombination of scatter diagram that its ]. For small periods, wave length L are not compatible with the assumptions of Morison equations ). In this study, it leads to the operational constraint runcature of the support of period distribution is then realized for simulations. It leads to conservative results because of corresponding wave heights,
probable contours of the scatter diagram and the achievements made by random that are good
Figure 6. Realizations of prints of couples (H, T).
NUMERICAL ANALYSIS: ENVIRONMENTAL CONDIT GROWTH
The objective is to show tha
surface modeling can address the issues of shallow water and high colonization in the Gulf of Guinea.
numbers, drag coefficients and
m depth by using a software developed in response surface [6] approximation of Morison forces assessment
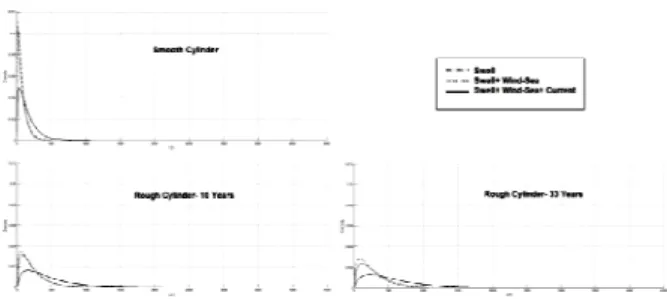
Sea-state modeling conditions where three cases are modeled: wave, combination of wave and wind
combination of wave,
wind-After Monte-Carlo simulations of the approach, the distribution of KC, C
surface for the explained levels, respectively are presented in Figure 7 to Figure 9.
Figure 7. Distribution of KC number at the surface.
Figure 8. Distribution of C
prints of couples (H, T).
NUMERICAL ANALYSIS: EFFECT OF THE ENVIRONMENTAL CONDITIONS AND MARINE
The objective is to show that the literature review and response surface modeling can address the issues of shallow water and high colonization in the Gulf of Guinea. We compute KC numbers, drag coefficients and drag forces at approximately 10 by using a software developed in the lab and based on ] approximation of kinematics field for assessment. This study will be conducted at state modeling conditions where three cases are modeled: wave, combination of wave and wind-sea and finally the
-sea and current.
Carlo simulations of the k independent of t , the distribution of KC, CD and the drag force at the surface for the explained levels, respectively are presented in
. Distribution of KC number at the surface.
Figure 9. Distribution of the drag force at the surface.
RESULTS
The results demonstrate that:
With increasing of roughness the values of C also FD will increase but this is not the case for the intermediate variable KC which will decrease with the time.
Current presence has an additive domin
on the drag force effect in comparison with wind sea that is second order influent. That leads to a change of the distribution typology and right distribution tails of KC and FD.
Wind-sea affects mainly the distributions of KC and CD near the modes but not on distribution tails. The drag force is increasing with the time and mainly in the first decade of the age of structures and mostly due to the evolution of the
is larger than the effect of the diameter increasing alone.
The distributions of FD and KC have one or two modes while the drag coefficient distributions are multimodal with a right side mode much higher in the presence of current: that is due to the non transfer of distributions. This effect is emphasized by the increasing of the roughness that leads to change of the maximal value of distribution fro the second mode of first in CD
behavior must be underlined to s modeling of CD in future works.
CONCLUSIONS
This study presents a complete modeling based on response surface methodology, to take account the effects of marine growth on structural loading, in a probabilistic field. This specific study case emphasizes that the efforts of the
and developments should be focused more on interaction of wave-current in comparison with modeling of wind
in extreme conditions for sites with the same typology of the selected one (Gulf of Guinea).
From reliability point of view, we suggest a complete sensitivity analysis and ‘reference distributions’ that allows to state one important result: the transfer of distribution is non linear when KC is low and the distribution shapes are highly affected by this transfer. By adding the effec
itself the results are very hard to predict, especially conservative or non-conservative assumptions as it is shown in the paper.
. Distribution of the drag force at the surface.
ng of roughness the values of CD and will increase but this is not the case for the intermediate variable KC which will decrease with Current presence has an additive dominant effect on the drag force effect in comparison with wind-sea that is second order influent. That leads to a change of the distribution typology and right
y the distributions of KC des but not on distribution tails. he drag force is increasing with the time and mainly in the first decade of the age of structures and mostly due to the evolution of the CD. Indeed it is larger than the effect of the diameter increasing and KC have one or two modes while the drag coefficient distributions are multimodal with a right side mode much higher in the presence of current: that is due to the non-linear is effect is emphasized by the increasing of the roughness that leads to change of the maximal value of distribution from distributions. This behavior must be underlined to suggest a suitable
This study presents a complete modeling based on response surface methodology, to take account the effects of marine growth on structural loading, in a probabilistic field. This
site-study case emphasizes that the efforts of the research and developments should be focused more on interaction of current in comparison with modeling of wind-sea loading in extreme conditions for sites with the same typology of the suggest a complete sensitivity analysis and ‘reference distributions’ that allows to state one important result: the transfer of distribution is non linear when KC is low and the distribution shapes are highly affected by this transfer. By adding the effect of roughness itself the results are very hard to predict, especially conservative assumptions as it is shown in
The increasing of the loading occurs mainly during the first decade of the structure age even if the increasin
growth is linear with time and this is due to the changes in drag coefficient values. Thus a good estimation of the roughness in the first years will be needed if a cleaning program is required for structural safety.
REFERENCES
[1] Wolfram, J., Jusoh, I., Sell, D., 1993, “Uncertainty in the estimation of the fluid loading due to the effects of marine growth”, Proc. of 12th int. conf. on Offshore Mechanics and Arctic Engineering , (O.M.A.E’93), Glasgow, vol. II, pp. 219-228.
[2] Compère, C., Segonzac, M., 2002, “Marine growths on offshore structures”, Internal report (in French), n°R.INT.DITI/GO/MM/99
[3] Schoefs, F., Boukinda, M., Quiniou, V., Birades, M., 2008, “Probabilistic Modeling of Environmental Loading on Jackets in Presence of Marine Growth: Specifities of the Gulf of Guinea”, Proc. of 27th International Offshore Mechanics and Arctic Engineering Conference, OMAE2008-57426.
[4] Kirkwood, D., 1981, “Marine fouling and corrosion”, Marine Fouling and of Offshore Struct
Underwater Technology, London.
[5] Rodenbusch, G., and Gutierrez, C.A., 1983, “Forces on cylinders in two-dimensional flow”, technical report. BRC 123-83, Bellaire Research Center, Houston, Texas USA.
[6] Boukinda, M., 2007, “Su
houle des structures jackets colonisées par des bio salissures”, Thèse de Doctorat, Université de Nantes. [7] Schoefs, F., Boukinda, M., Guillo, C., Rouhan, A., 2005,
“Fatigue of Jacket Platforms: Effect of Marine Growth Modeling”, Proc. of 24th International Offshore Mechanics and Arctic Engineering Conference, OMAE2005
[8] Rouhan, A., Schoefs, F., 2003, “Probabilistic modeling of inspections results for offshore structures”, Structural safety, vol 25, pp. 379-399.
[9] Shi, W., Park, H.C., Baek, J.H., Kim, Y.C., Shin, H.K., 2012, “Study on the Marine Growth Effect on the Dynamic Response of Offshore Wind Turbines”, INTERNATIONAL
JOURNAL OF PRECISION ENGINEERING AND
MANUFACTURING Vol. 13, No. 7, pp. 1167
[10] Morison, J.R., O'Brien, M.P., Johnson, J.W., Schaff, S.A., 1950, “The Force Exerted by Surfaces Waves on Piles”, Journal of Petroleum Technology, AIME, Vol. 189.
[11] Schoefs, F., 2008, “Sensitivity approach for modeling the environmental loading of marine s
response surface”, Reliability Engineering and System Safety, Available online 19 June 2007, Vol. 93, Issue 7, July 2008, pp. 1004-1017.
[12] Theophanatos, A., 1988, “Marine Growth and Hydrodynamic Loading of Offshore Structures” thesis, University of Strathclyde , UK.
“North Sea fouling organisms and their potential effects on The increasing of the loading occurs mainly during the first decade of the structure age even if the increasing of the marine growth is linear with time and this is due to the changes in drag coefficient values. Thus a good estimation of the roughness in the first years will be needed if a cleaning program is required
J., Jusoh, I., Sell, D., 1993, “Uncertainty in the estimation of the fluid loading due to the effects of marine growth”, Proc. of 12th int. conf. on Offshore Mechanics and Arctic Engineering , (O.M.A.E’93), Glasgow, vol. II, pp. Segonzac, M., 2002, “Marine growths on offshore structures”, Internal report (in French), n°R.INT.DITI/GO/MM/99-16 revised, pp. 67.
Schoefs, F., Boukinda, M., Quiniou, V., Birades, M., 2008, “Probabilistic Modeling of Environmental Loading on n Presence of Marine Growth: Specifities of the Gulf of Guinea”, Proc. of 27th International Offshore Mechanics and Arctic Engineering Conference, Kirkwood, D., 1981, “Marine fouling and corrosion”, Marine Fouling and of Offshore Structures, Society for Underwater Technology, London.
Rodenbusch, G., and Gutierrez, C.A., 1983, “Forces on dimensional flow”, technical report. Vol. 1, 83, Bellaire Research Center, Houston, Texas – Boukinda, M., 2007, “Surface de réponse des efforts de houle des structures jackets colonisées par des bio-salissures”, Thèse de Doctorat, Université de Nantes.
Schoefs, F., Boukinda, M., Guillo, C., Rouhan, A., 2005, “Fatigue of Jacket Platforms: Effect of Marine Growth eling”, Proc. of 24th International Offshore Mechanics and Arctic Engineering Conference, OMAE2005-67195.
Rouhan, A., Schoefs, F., 2003, “Probabilistic modeling of inspections results for offshore structures”, Structural safety, Shi, W., Park, H.C., Baek, J.H., Kim, Y.C., Shin, H.K., 2012, “Study on the Marine Growth Effect on the Dynamic Response of Offshore Wind Turbines”, INTERNATIONAL
JOURNAL OF PRECISION ENGINEERING AND
MANUFACTURING Vol. 13, No. 7, pp. 1167-1176. rison, J.R., O'Brien, M.P., Johnson, J.W., Schaff, S.A., 1950, “The Force Exerted by Surfaces Waves on Piles”, Journal of Petroleum Technology, AIME, Vol. 189.
Schoefs, F., 2008, “Sensitivity approach for modeling the environmental loading of marine structures through a matrix response surface”, Reliability Engineering and System Safety, Available online 19 June 2007, Vol. 93, Issue 7, July Theophanatos, A., 1988, “Marine Growth and Hydrodynamic Loading of Offshore Structures”, PhD thesis, University of Strathclyde , UK. [13] Pipe, A., 1981, “North Sea fouling organisms and their potential effects on
the corrosion of North Sea structures”, Symposium on Marine Corrosion on Offshore Structures, Aberdeen. [13] Picken, G.B., 1985, “Review of marine fouling organisms in the
North Sea on offshore structures”, Discussion Forum and Exhibition on Offshore Engineering with Elastomers, Plastics and Rubber Inst., London, vol. 5, pp. 5.1-5.10.
[14] Pipe, A., 1981, “North Sea fouling organisms and their potential effects on the corrosion of North Sea structures”, Symposium on Marine Corrosion on Offshore Structures, Aberdeen.
[15] Sankalpa, M., 1991, “Marine growth on offshore structures in Indian offshore waters and removal strategy”, 1st International Offshore and Polar Engineering Conference, I.S.O.P.E, P.o. Box 1107 Golder U.S.A., pp. 143-147. [16] Sharma, J.N., 1983, “Marine growth on the Hondo
platform in the Santa Barbara Channel”, 15th Annual Offshore Technology Conference, vol. 2, Dallas U.S.A., pp. 469 – 474.
[17] Faber, M.H., 2002, “Risk Based Inspection: The Framework”, Structural Engineering International (SEI), 12 (3), August 2002, pp. 186-194.
[18] Boukinda, M., Schoefs, F., Quiniou, V., Birades, M., 2007, “Marine Growth Colonization Process in Guinea Gulf: data analysis”, Journal of Offshore Mechanics and Arctic Engineering, Vol. 129, Issue 2, pp. 97-106 doi:10.1115/1.2355518.
[19] American Petroleum Institute, Recommended Practice for planning, Designing and Constructing Fixed Offshore Platforms Working Stress Design, RP2A-WSD, 21th Edition, 2004.
[20] Gudmestad, T.O., Moe, G., 1996, “Hydrodynamic coefficients for calculation of hydrodynamic loads on offshore truss structures”, Journal of Marine Structures 9, pp. 745-758.
[21] Schoefs, F., Boukinda, M., 2010, “Sensitiveness approach for modeling Stochastic Field of Keulegan Carpenter and Reynolds number through a matrix response surface”, Journal of Offshore Mechanics and Arctic Engineering, Vol. 132, Iss.1, February 2010, paper N°011602 pp. 1-7.
[22] Coche, E., Quiniou-Ramus, V., 2004, “Offshore Mandji project environmental design criteria”, Internal Report, Ref: DGEP/TDO/TEC/GEO/ECO04-203.
[23] Nerzic, R., Prevosto, M., Frelin, C., Quiniou, V., 2007, “Joint Distributions for Wind/waves/current in West Africa and derivation of Multi Variate Extreme I-FORM Contours”, Proc. of 17th International Offshore and Polar Engineering Conference, ISOPE, Liboa, Portugal, pp. 81-88.
[24] Sankalpa M., 1991, "Marine growth on offshore structures in Indian offshore waters and removal strategy", First International Offshore and Polar Engineering Conference, I.S.O.P.E, P.o. Box 1107 Golder U.S.A., pp. 143-147. [25] Compère C., Segonzac M., 2002, "Marine growths on
offshore structures", Internal report (in French), n°R.INT.DITI/GO/MM/99-16 revised, pp. 67.references here.
[26] Gudmestad T.O., Moe G., 1996. “Hydrodynamic coefficients for calculation of hydrodynamic loads on offshore truss structures”, Journal of Marine Structure 9, pp. 745-758.
[27] Schoefs, F., Boukinda, M., 2007. " Sensitivity approach for modelling stochastic Field of Keulegan Carpenter and Reynolds number through a matrix response surface", Proc. of 17th International Offshore and Polar Engineering Conference, ISOPE, Liboa, Portugal, pp. 81-88.
[28] Engineering Committee on Oceanic Resources, 1991. “Reliability analysis for offshore structures”, pp.81.
[29] Coche, E., Quiniou-Ramus V., 2004. "Offshore Mandji project environmental design criteria", Internal Report, Ref :DGEP/TDO/TEC/GEO/ECO04-203.
[30] Nerzic, R., Prevosto, M., Frelin, C., Quiniou, V., 2007. “Joint Distributions for Wind/waves/current in West Africa and derivation of Multi Variate Extreme I-FORM Contours”, Proc. of 17th International Offshore and Polar Engineering Conference, ISOPE, Liboa, Portugal, pp. 81-88.