Asteroseismology of red-clump stars with CoRoT
1and Kepler
A. Miglio
∗,†, J. Montalbán
∗, P. Eggenberger
∗∗, S. Hekker
‡,§and A. Noels
∗∗Institut d’Astrophysique et de Géophysique de l’Université de Liège, Allée du 6 Août, 17 B-4000 Liège, Belgium †Postdoctoral Researcher, Fonds de la Recherche Scientifique - FNRS, Belgium
∗∗Observatoire de Genève, Université de Genève, 51 chemin des Maillettes, 1290 Sauverny, Switzerland ‡School of Physics and Astronomy, University of Birmingham, Edgbaston, Birmingham B15 2TT United
Kingdom
§Instituut voor Sterrenkunde, K.U. Leuven, Celestijnenlaan 200D, 3001 Leuven, Belgium
Abstract. The availability of asteroseismic constraints for a large number of red giants with CoRoT and, in the near future with Kepler, paves the way for detailed studies of populations of galactic-disk red giants. We investigate which information on the observed population can be recovered by the distribution of the observed seismic constraints: the frequency of maximum power of solar-like oscillations (νmax) and the large frequency separation (∆ν). We use the distribution of νmaxand of ∆ν
observed by CoRoT in nearly 800 red giants in the first long observational run, as a tool to investigate the properties of galactic red-giant stars through the comparison with simulated distributions based on synthetic stellar populations. We can clearly identify the bulk of the red giants observed by CoRoT as red-clump stars, i.e. post-flash core-He-burning stars. The distribution of νmax and of ∆ν give us access to the distribution of the stellar radius and mass, and thus represent a most
promising probe of the age and star formation rate of the disk, and of the mass-loss rate during the red-giant branch. This approach will be of great utility also in the interpretation of forthcoming surveys of variability of red giants with CoRoT and Kepler. In particular, an asteroseismic mass estimate of clump stars in the old-open clusters observed by Kepler, would represent a most valuable observational test of the poorly known mass-loss rate on the giant branch, and of its dependence on metallicity.
Keywords: stars: fundamental parameters – stars: horizontal-branch – stars: late-type – stars: mass-loss – stars: oscillations – galaxy: disk – galaxy: stellar content
PACS: 97.10.Sj, 97.20.Li, 98.35.-a
INTRODUCTION
The clump of red giants in the color-magnitude diagram (CMD) of intermediate-age and old open clusters was recognized as being formed by stars in the stage of cen-tral helium burning since the works of Cannon [1] and Faulkner and Cannon [2]. The near constancy of the clump absolute magnitude in these clusters was correctly interpreted as the result of He ignition in an electron-degenerate core. Under these conditions, He burning can-not start until the stellar core mass attains a critical value of about 0.45 M . From this, it follows that low-mass
stars developing a degenerate He core after H exhaustion, have similar core masses at the beginning of He burning, and hence similar luminosities.
Beside old-open clusters, the red giant clump (RC) is also a remarkable and well populated feature in the CMD of composite stellar populations, like galaxies. A major advance in our understanding of RC stars was possible thanks to the determination of precise parallaxes with the
1 The CoRoT space mission was developed and is operated by the
French space agency CNES, with participation of ESA’s RSSD and Science Programmes, Austria, Belgium, Brazil, Germany, and Spain.
Hipparcosmission, which allowed us to identify clearly the clump in the CMD of nearby stars [3].
Thanks to its near-constant luminosity, the RC gained importance also as a distance indicator providing dis-tance estimates to the galactic centre [4] and nearby galaxies such as Fornax [5], M33 [6] and LMC [see e.g. 7, 8].
In the above-mentioned examples red clump stars were identified in simple or composite stellar populations of a given distance. With the asteroseismic constrains that are now becoming available, we are able to charac-terize the population in the galactic disk even without any information about distance. In the first section, we show how very simple seismic observables, such as the distri-bution of νmax, can be used to identify the population of
red giants observed by CoRoT as being dominated by the red clump of the galactic disk. This approach could also be applied to the numerous red giants that will be mon-itored with the Kepler satellite and, as we show in the second section, could be of major relevance in the study of stellar evolution of simpler populations, such as those of the old-open clusters, that Kepler will observe.
THE POPULATION OF
GALACTIC-DISK RED GIANTS SEEN
WITH COROT EYES
The CoRoT satellite [9] is providing high-precision, long and uninterrupted photometric monitoring of thousands of stars in the fields primarily dedicated to the search for exoplanetary systems (EXOField). These observa-tions reveal a wealth of information on the properties of solar-like oscillations in a large number of red giants [see 10], i.e. their oscillation frequency range, ampli-tudes, lifetimes and nature of the modes (radial as well as non-radial modes were detected). The goldmine of in-formation represented by this detection is currently being exploited.
As described in detail by Hekker et al. [11], about 800 solar–like pulsating red giants were identified in the field of the first CoRoT 150-days long run in the direction of the galactic centre (LRc01). Hekker et al. [11] searched for the signature of a power excess due to solar-like oscillations in all stars brighter than mV=15
in a frequency domain up to 120 µHz. They found that the frequency corresponding to the maximum oscillation power (νmax) and the large frequency separation of stellar
pressure modes (∆ν) are non-uniformly distributed. The distributions of νmaxand ∆ν show a single
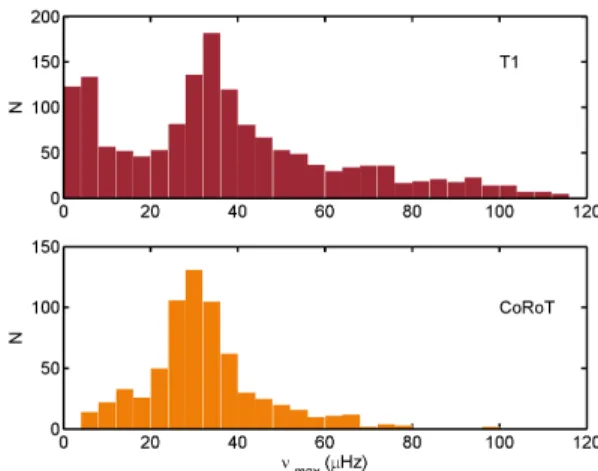
dom-inant peak located at ∼ 30 µHz and ∼ 4 µHz, respec-tively (the corresponding histograms are also shown in the lower panels of Fig. 2 and 3). We note, however, that the detection of solar-like pulsations in the low-frequency end (νmax. 20 µHz) is compromised due to
the long-period trends, the activity and granulation sig-nal. We should therefore regard the observed distribution at the lowest frequencies as strongly biased [see 11].
We focus on the simplest and most robust seismic con-straints provided by the observations: νmaxand ∆ν, and
on the information they supply on the stellar parameters. As suggested by Brown et al. [12], νmax is expected to
scale as the acoustic cutoff frequency of the star, which defines an upper limit to the frequency of acoustic oscil-lation modes. Following Kjeldsen and Bedding [13] and rescaling to solar values, νmaxcan be expressed as :
νmax=
M/M
(R/R )2pTeff/5777K
3050 µHz. (1) The large frequency separation of stellar p modes, on the other hand, is well known to be inversely proportional to the sound travel time in the stellar interior, and is therefore related to the mean density of the star by the following expression [see e.g. 13]:
∆ν = s
M/M
(R/R )3 134.9 µHz.
(2)
FIGURE 1. Theoretical Hess diagram of the population T1 simulated withTRILEGAL. The dashed rectangle delimits the location in the HR diagram of the population of G-K giants considered in this work. The bar on the right shows, in a color-coded logarithmic scale, the number of stars per log L/L −
log Teffbin.
As presented in [14] (Paper I), we investigated the properties of the underlying stellar population that de-termine the observed νmax and ∆ν distributions, and
whether the presence of a single peak in νmaxand ∆ν is
compatible with current models of red-giant populations in the galactic disk.
Stellar population synthesis
In order to simulate the composite stellar population observed in the LRc01 of CoRoT’s EXOField we used the stellar population synthesis codeTRILEGAL[15] de-signed to simulate photometric surveys.
In TRILEGALseveral model parameters (such as the star formation history and the morphology of different galactic components) were calibrated to fit Hipparcos data [3], as well as star counts from deeper photometric surveys.
In ourTRILEGALsimulation (T1) we adopted the stan-dard parameters for the four components of the Galaxy (halo, bulge, thin and thick disk). We simulated the stel-lar population in the sky area observed by CoRoT dur-ing LRc01 (3.9 deg2 centered at l = 37◦, b = −6.9◦) and considered stars in the observed magnitude range (11. mV. 15). This population turns out to be
domi-nated by thin-disk stars.
The default star formation rate in the thin disk is assumed to be constant over the last 9 Gyr, and the age-metallicity relation is taken from Rocha-Pinto et al. [16]. An exhaustive description of the evolutionary tracks used in the simulations is given by Girardi et al. [15] and
references therein.
An HR diagram showing the number density of stars (Hess diagram) of the synthetic population is presented in Fig. 1, where the main sequence and the red clump (RC) clearly appear as the most populated areas.
We shall henceforth restrict our interest to the popu-lation of G-K giants delimited by the dashed rectangle in Fig. 1. In the HR diagram (see Fig. 1) the distribution of giants is not uniform and predominantly peaked in the red clump, near iso-radii lines corresponding to R ' 10 R .
Observed vs. simulated ν
maxand ∆ν
distributions
We now simply evaluate, by means of Eq. 1 and 2, the theoretical νmaxand ∆ν distributions based on the
prop-erties (R, M, Teff) of the synthetic population presented in the previous section. Among all the stars in the pop-ulation we select G-K giants (0.5 < log L/L < 4 and
3.6 < log Teff< 3.76, see Fig. 1). As we previously
dis-cussed, we should restrict the comparison to νmax& 20
µ Hz.
The νmaxdistribution we obtain for T1 is reported in
the upper panel of Fig. 2. It is clear that the dominant maximum in the observed histogram (lower panel of Fig. 2) can be qualitatively well reproduced by the stellar population model.
The comparison with the observed νmax distribution
suggests that the bulk of CoRoT LRc01 pulsating giants are red clump stars. In Fig. 4, upper panel, we show the location in the HR diagram of stars belonging to T1 and having 20 µHz < νmax< 50 µHz: this lets us
identify the dominant peak in the distribution as due to red-clump stars, i.e. low-mass stars with actual masses 0.8. M/M . 1.8 (see the lower panel of Fig. 4), that
are in the core He-burning phase after having developed an electron-degenerate core during their ascent on the RGB and passed the He-flash.
This conclusion is also fully supported by the compar-ison between the observed and theoretical distribution of ∆ν , as shown in Fig. 3.
The observed dominant peaks in the νmaxand ∆ν
dis-tributions are qualitatively explained by the models. Nev-ertheless, a Kolmogorov-Smirnov test shows that the dis-crepancies between the simulated and observed distribu-tions are, from a statistical point of view, highly signifi-cant due to the fact that the samples contain a large num-ber of stars.
The predicted νmax distribution is affected by several
parameters in stellar populations models. We note how-ever that, since most of the stars belonging to the RC cover a limited range in radius, νmax represents a
valu-FIGURE 2. Histogram showing the comparison between the νmaxdistribution of the observed (lower panel) and simulated
populations of red giants (upper panel).
FIGURE 3. Histogram showing the comparison between the ∆ν distribution of the observed (lower panel) and simulated populations of red giants (upper panel).
able tracer of the mass distribution of the population (see Fig. 4). The mass distribution of RC stars is, in its turn, highly dependent on the age and, more generally, on the star formation rate of the composite population, as well as on the mass-loss rate adopted during the RGB (see Paper I for a more detailed discussion).
FUTURE OBSERVATIONS WITH
COROT AND KEPLER
Asteroseismic constraints for populations of red giants will soon be available for various fields in the Galaxy.
FIGURE 4. Upper panel:HR diagram showing the position of stars in the population T1 with 20 µHz < νmax< 50 µHz.
The radius distribution of these stars has a mean of 11.2 R
with a standard deviation of 1.5 R . Lower panel: The mass
distribution of the sub-population in the upper panel is rep-resented by full bars, whereas empty bars illustrate the mass distribution of their progenitors.
near the galactic equator, with longitudes near the galactic centre (l ' 35◦) and anticenter (l ' 215◦). The Kepler satellite [17] will monitor red giants in a larger field located at l ' 75◦ and 7◦ . l . 20◦ (see http://astro.phys.au.dk/KASC/).
In addition to the observations of red giants belonging mostly to the composite stellar population of the galactic disk, Kepler will also perform observations of solar-like oscillations in simple, well constrained populations: the two old-open clusters NGC6791 and NGC6819.
Red clumps in simple populations:
NGC6791 and NGC6819
NGC6791 and NGC6819 are well studied old-open clusters, both showing a red clump in their color-magnitude diagrams, as reported e.g. in Grocholski and Sarajedini [18] and Kalirai and Tosi [19].
To have a first estimate of the expected seismic prop-erties of the red giants in the two clusters, we com-puted a preliminary simulation by using the codeBASTI
[20], assuming single-age single-metallicity populations. In the case of NGC6791 we adopted as age 9 Gyr and [Fe/H]=0.4 [see 21, and references therein] and for NGC6819 an age of 2.5 Gyr and solar metallicity [19].
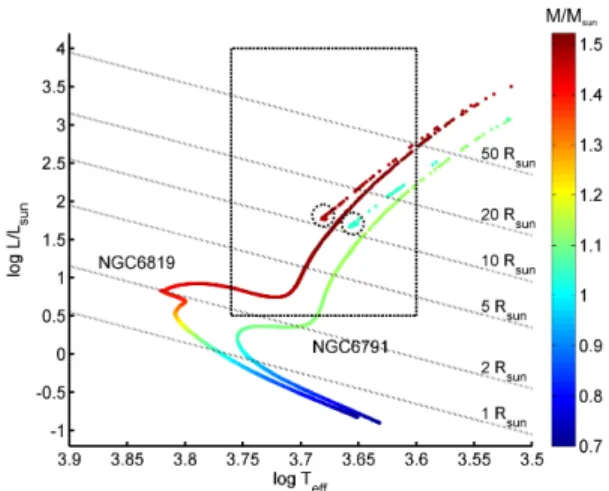
The position in an HR diagram of the stars of the syn-thetic populations of NGC6791 and NGC6819 is shown in Fig. 5. The mass of the stars is color-coded in the plot, and indicates a mass of turnoff stars of about 1.1 and 1.4
FIGURE 5. HR diagram of the one-age one-metallicity pop-ulations representing the clusters NGC6819 and NGC6791. The mass of the stars is color-coded (see color bar on the right). The dashed rectangle delimits the region of G-K giants we con-sidered, while the dashed circles indicate the location of the red clump in the two clusters.
M for NGC6791 and NGC6819, respectively. The
lo-cation of the red clump of the clusters is encircled by dashed lines.
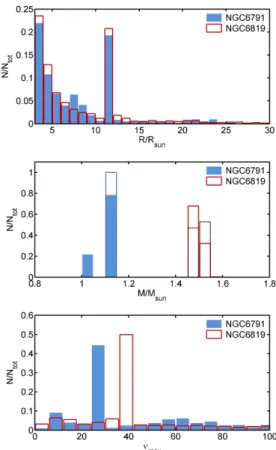
In Fig. 6 we present the radius, mass and νmax
distribu-tions of the red giants delimited by the dashed rectangle in Fig. 5. As shown in Fig. 6, upper panel, the radius dis-tribution of G-K giants is very similar in the two clusters, and is sharply peaked between 11 and 12 R , in
cor-respondence to red-clump stars. As a consequence (see Eq. 1), the distribution of νmaxis a reliable tracer of the
mass distribution of red-clump stars. The latter is deter-mined by the age of the population in the first place, but it is also affected by the mass-loss rate adopted during the red-giant-branch (see central panel of Fig. 6).
Since the age of the clusters can be determined by other means, e.g. by isochrone-fitting [see 21, for a dis-cussion], it is clear that the asteroseismic mass estimate of clump stars represents a most valuable observational test of the poorly known mass-loss rate on the giant branch, and of its dependence on metallicity [see e.g. 22, and references therein].
CONCLUDING REMARKS
The detection of solar-like oscillations in populations of red giants with CoRoT allows us to access the properties of (so far) poorly-constrained populations in the galactic disk.
We obtain a robust identification of the bulk of CoRoT LRc01 red giants as red clump stars. This conclusion is based only on seismic constraints, namely on the
com-FIGURE 6. Upper panel:Radius distribution of G-K giants in the synthetic population of NGC6791 and NGC6818. Cen-tral panel:full lines indicate the mass distribution of the stars, while dotted lines the mass distribution of their progenitors. Lower panel: νmax distribution for the red-giant populations
in the two clusters with νmax < 100 µHz. The significantly
different νmax corresponding to the isolated peaks traces the
mass difference of red-clump stars in NGC6791 and NGC6818 as predicted from the models.
parison between the νmaxand ∆ν distributions observed
and those based on a synthetic stellar population. The latter was computed with the population synthesis code
TRILEGAL, assuming standard parameters [see 15] to de-scribe the morphology and the star formation history of the Galaxy components.
This approach will be of great utility in the interpre-tation of other surveys of variability of red giants with CoRoT and Kepler. In particular in the case of red giants in old-open clusters, where the number of free param-eters affecting the theoretical distributions of νmax and
∆ν is significantly reduced. This should allow us to con-strain other important aspects of stellar evolution such as the mass-loss rate during the evolution in the red gi-ant branch, or transport processes during main-sequence evolution.
ACKNOWLEDGMENTS
This work has made use ofTRILEGALandBASTI web tools. A.M. is thankful to the Belgian FRS-FNRS for financial support.
REFERENCES
1. R. D. Cannon, MNRAS 150, 111–135 (1970). 2. D. J. Faulkner, and R. D. Cannon, ApJ 180, 435–446
(1973).
3. M. A. C. Perryman, L. Lindegren, J. Kovalevsky, E. Hoeg, U. Bastian, P. L. Bernacca, M. Crézé, F. Donati, M. Grenon, F. van Leeuwen, H. van der Marel, F. Mignard, C. A. Murray, R. S. Le Poole, H. Schrijver, C. Turon, F. Arenou, M. Froeschlé, and C. S. Petersen, A&A 323, L49–L52 (1997).
4. B. Paczynski, and K. Z. Stanek, ApJ 494, L219 (1998). 5. L. Rizzi, E. V. Held, I. Saviane, R. B. Tully, and
M. Gullieuszik, MNRAS 380, 1255–1260 (2007). 6. M. Kim, E. Kim, M. G. Lee, A. Sarajedini, and D. Geisler,
AJ123, 244–254 (2002).
7. L. Girardi, and M. Salaris, MNRAS 323, 109–129 (2001). 8. M. Salaris, S. Percival, and L. Girardi, MNRAS 345,
1030–1038 (2003).
9. A. Baglin, and M. Fridlund, “CoRoT: From Stars to Habitable Planets. Pre-Launch Studies,” in ESA Special Publication, edited by M. Fridlund, A. Baglin, J. Lochard, and L. Conroy, 2006, vol. 1306 of ESA Special Publication, pp. 11–12.
10. J. De Ridder, C. Barban, F. Baudin, F. Carrier, A. P. Hatzes, S. Hekker, T. Kallinger, W. W. Weiss, A. Baglin, M. Auvergne, R. Samadi, P. Barge, and M. Deleuil, Nature459, 398–400 (2009).
11. S. Hekker, T. Kallinger, F. Baudin, J. De Ridder, C. Barban, F. Carrier, A. Hatzes, W. Weiss, and A. Baglin, A&A in press (2009), arXiv: astro-ph/0906.5002.
12. T. M. Brown, R. L. Gilliland, R. W. Noyes, and L. W. Ramsey, ApJ 368, 599–609 (1991).
13. H. Kjeldsen, and T. R. Bedding, A&A 293, 87–106 (1995). 14. A. Miglio, J. Montalbán, F. Baudin, P. Eggenberger,
A. Noels, S. Hekker, J. De Ridder, W. Weiss, and A. Baglin, A&A in press (2009), arXiv: astro-ph/0908.0210.
15. L. Girardi, M. A. T. Groenewegen, E. Hatziminaoglou, and L. da Costa, A&A 436, 895–915 (2005).
16. H. J. Rocha-Pinto, J. Scalo, W. J. Maciel, and C. Flynn, A&A358, 869–885 (2000).
17. J. Christensen-Dalsgaard, T. Arentoft, T. M. Brown, R. L. Gilliland, H. Kjeldsen, W. J. Borucki, and D. Koch, Journal of Physics Conference Series118, 012039 (2008). 18. A. J. Grocholski, and A. Sarajedini, AJ 123, 1603–1612
(2002).
19. J. S. Kalirai, and M. Tosi, MNRAS 351, 649–662 (2004). 20. A. Pietrinferni, S. Cassisi, M. Salaris, and F. Castelli, ApJ
612, 168–190 (2004).
21. F. Grundahl, J. V. Clausen, S. Hardis, and S. Frandsen, A&A492, 171–184 (2008).
22. G. Carraro, L. Girardi, A. Bressan, and C. Chiosi, A&A 305, 849–857 (1996).