A TMS–EEG CONTRIBUTION TO THE
MULTIMODAL ASSESSMENT OF BRAIN
CONNECTIVITY AND CONSCIOUSNESS.
Olivier Bodart
THESE PRESENTEE EN VUE DE L’OBTENTION DU GRADE DE Docteur en Sciences médicales. Année académique 2017-2018
Prof Steven LAUREYS,
Prof. Steven Laureys, MD, PhD, Liège Université
Assessment committee
Prof. Pierre Maquet (president), MD, PhD, Liège Université Prof. Paul Boon, MD, PhD, Universiteit Gent
Dr. Athena Dermertzi, PhD, Liège Université Dr. Olivia Gosseries, PhD, Liège Université
Prof. Marcello Massimini, MD, PhD, Università degli Studi di Milano Dr. Mario Rosanova, MD, PhD, Università degli Studi di Milano Prof. Bernard Sadzot, MD, PhD, Liège Université
Prof. Rodolphe Sepulchre, PhD, Liège Université and University of Cambridge
© Olivier Bodart, 2017
The work presented in this thesis was funded by the Belgian National Funds for Scientific Research (FRS-FNRS), the University and University Hospital of Liege, the European Commission through the Human Brain Project (EU-H2020-FETFLAGSHIP-HBP-SGA1-GA720270), and personal travel grants from the FRS-FNRS and the European Academy of Neurology.
Content
List of publications ... iii
List of figures ... vii
List of tables ... vii
List of abbreviations ... ix
Abstract ... xi
Résumé ... xiii
Introduction ... 1
1. Disorders of consciousness ... 3
1.1. Disorders of consciousness are better defined ... 4
1.2. Behavioural tools have been refined ... 6
1.3. Ancillary techniques are plenty … ... 9
1.4. … but still have limitations ... 12
1.5. Why it matters ... 12
1.6. Several questions remain ... 14
2. TMS–EEG ... 16
3. Objectives ... 23
Shared TMS–EEG methodology ... 25
1. Acquisitions ... 27
2. Initial data processing ... 30
TMS–EEG and neuroimaging ... 31
1. TMS–EEG and FDG-PET ... 33
1.2. Methodology ... 34
1.3. FDG-PET and TMS–EEG are congruent ... 35
1.4. MCS* patients share metabolic and electrophysiological features .. 40
2. TMS–EEG and DTI ... 41
2.1. Combining TMS–EEG and DTI ... 41
2.2. Methodology ... 41
2.3. Structural integrity support TMS–EEG complexity ... 42
3. Discussion ... 47
4. Perspectives ... 56
Conclusion ... 61
Appendix A ... Erreur ! Signet non défini.
Paper I ... Erreur ! Signet non défini.Appendix B ... Erreur ! Signet non défini.
Paper II ... Erreur ! Signet non défini.Appendix C ... Erreur ! Signet non défini.
Paper III ... Erreur ! Signet non défini.Appendix D ... Erreur ! Signet non défini.
Paper IV ... Erreur ! Signet non défini.Appendix E ... 65
Paper V ... 65
References ... 99
List of publications
This thesis is based on the following publications:
Articles:
Bodart, O., Gosseries, O., Wannez, S., Thibaut, A., Annen, J., Boly, M.,
Rosanova, M., Casali, A.G., Casarotto, S., Tononi, G., Massimini, M., Laureys, S., 2017. Measures of metabolism and complexity in the brain of patients with disorders of consciousness. NeuroImage Clin. 14, 354–362. doi:10.1016/j.nicl.2017.02.002
Bodart, O., Amico E., Gomez F., Casali A.G., Wannez S., Heine L., Thibaut A.,
Annen J., Boly M., Casarotto S., Rosanova M., Massimini M., Laureys S., Gosseries O., Global structural and effective connectivity in patients with disorders of consciousness. Under review.
Napolitani, M.*, Bodart, O.*, Canali, P., Seregni, F., Rosanova, M., Laureys, S., Massimini, M., Gosseries, O., 2014. Transcranial magnetic stimulation combined with high density EEG in altered state of consciousness. Brain Inj. 28, 1180–1189. doi:10.3109/02699052.2014.920524 * Contributed equally
Bodart, O., Laureys, S., Gosseries, O., 2013. Coma and disorders of
consciousness: scientific advances and practical considerations for clinicians. Semin. Neurol. 33, 83–90. doi:10.1055/s-0033-1348965
Gantner, I.S., Bodart, O., Laureys, S., Demertzi, A., 2012. Our rapidly changing understanding of acute and chronic disorders of consciousness: challenges for neurologists. Future Neurol. 8, 43–54. doi:10.2217/fnl.12.77
Book chapters:
Bodart, O., Charland-Verville, V., Laureys, S., Gosseries, O., 2013.
Neuroimaging in Disorders of Consciousness, in: Filippi, M. (Ed.), Oxford Textbook of Clinical Neurology. Oxford University Press, London.
Bodart, O., Thibaut, A., Laureys, S., Gosseries, O., 2013. Disorders of
Consciousness, in: Citerio, G., Smith, M., Kofke, A. (Eds.), Oxford Textbook of Neurocritical Care. Oxford University Press, London.
Gosseries, O., Bodart, O., Massimini, M., 2015. Transcranial magnetic stimulation and electroencephalography, in: Rossetti, A., Laureys, S. (Eds.), Clinical Neurophysiology in Disorders of Consciousness: Brain Function Monitoring in the ICU and Beyond. Springer-Verlag Wien, doi:10.1007/978-3-7091-1634-0_10
Other publications as first or co-author, in alphabetical order:
Articles:
Amico, E., Bodart, O., Rosanova, M., Gosseries, O., Heine, L., Van Mierlo, P., Martial, C., Massimini, M., Marinazzo, D., Laureys, S., 2017. Tracking dynamic interactions between structural and functional connectivity: a TMS/EEG-dMRI study. Brain Connect. 7, brain.2016.0462. doi:10.1089/brain.2016.0462
Bodart, O., Laureys, S., 2014. Predicting outcome from subacute unresponsive
wakefulness syndrome or vegetative state. Crit. care 18, 132. doi:10.1186/cc13831
Bodart, O., Malaise, D., Horta, A., Sid, S., Tassin, F., 2016. An unusual cause
of diplopia. Acta Neurol. Belg. 1–3. doi:10.1007/s13760-016-0647-9 Casarotto, S., Comanducci, A., Rosanova, M., Sarasso, S., Fecchio, M.,
Napolitani, M., Pigorini, A., Casali, A.G., Trimarchi, P.D., Boly, M., Gosseries, O., Bodart, O., Curto, F., Landi, C., Mariotti, M., Devalle, G., Laureys, S., Tononi, G., Massimini, M., 2016. Stratification of unresponsive patients by an independantly validated index of brain complexity. Ann. Neurol. 80. doi:10.1002/ana.24779
Gosseries, O., Charland-Verville, V., Thonnard, M., Bodart, O., Laureys, S., Demertzi, A., 2014. Amantadine, Apomorphine and Zolpidem in the Treatment of Disorders of Consciousness. Curr. Pharm. Des. 20, 3893– 3910.
Laureys, S., Bodart, O., Gosseries, O., 2014. The Glasgow Coma Scale: time for critical reappraisal? Lancet Neurol. 13, 755–757. doi:http://dx.doi.org/10.1016/PII
Wannez, S., Gosseries, O., Azzolini, D., Martial, C., Cassol, H., Aubinet, C., Annen, J., Martens, G., Bodart, O., Heine, L., Charland-Verville, V., 2017a. Prevalence of Coma-Recovery Scale-Revised signs of
consciousness in patients in a minimally conscious state. Neuropsychol. Rehabil. in press. doi:10.1177/1352458506070750
Wannez, S., Hoyoux, T., Langohr, T., Bodart, O., Martial, C., Wertz, J., Chatelle, C., Verly, J.G., Laureys, S., 2017b. Objective assessment of visual pursuit in patients with disorders of consciousness: an exploratory study. J. Neurol. doi:10.1007/s00415-017-8469-0
Book chapters:
Bodart, O., Laureys, S. 2016. Imaging the central nervous system in the
critically ill, in: Webb, A., Angus, D., Finfer, S., Gattinoni, L., Singer, M. (Eds.), Oxford Textbook of Critical Care. Oxford University Press, London.
Di Perri, C., Cavaliere, C., Bodart, O., Thibaut, A., Bahri, MA., Soddu, A., Laureys, S. 2017. Sleep, Coma, Vegetative and Minimally Conscious States, in: Chokroverty, S. (Ed.) Sleep Disorders Medicine, Springer, Vienna.
Thibaut A., Bodart, O., Laureys, S., Canavero S., 2015. Chronic Disorders of Consciousness, in: Canavero, S. (Ed.), Textbook of Cortical Brain Stimulation. De Gruyter, London.
List of figures
Figure 1 - Number of publications on DOC and evolution of nosology ... 3
Figure 2 - Nosology of behavioural disorders of consciousness ... 5
Figure 4 – Our TMS–EEG setup ... 29
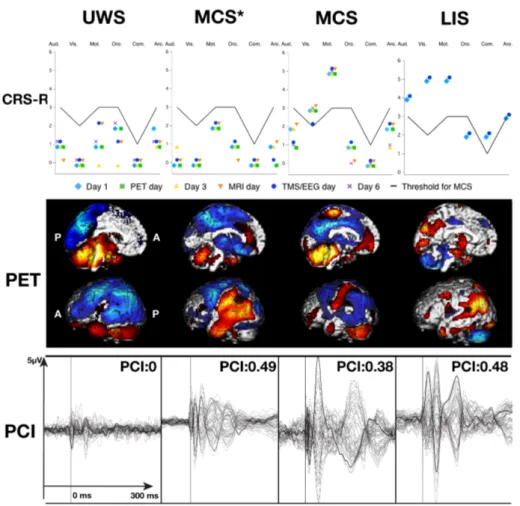
Figure 5 - Typical behavioural, metabolic, and PCI findings in UWS, MCS, MCS*, and LIS patients ... 38
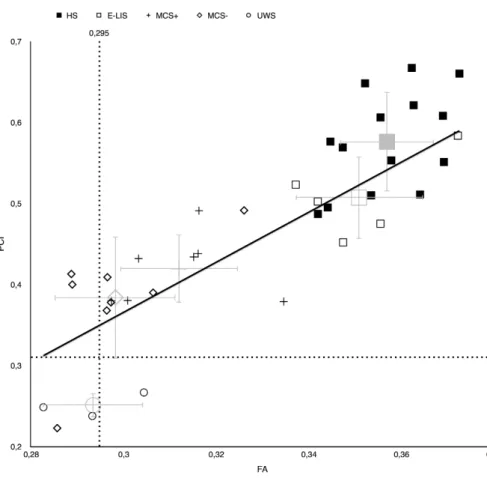
Figure 6 - PCI over global FA in subjects and subgroups ... 44
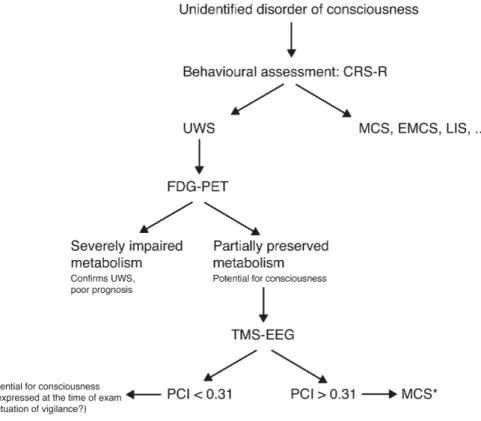
Figure 7 – Potential diagnostic algorithm ... 57
List of tables
Table 1 - Behavioural scales ... 8Table 2 - Advantages and disadvantages of TMS–EEG ... 22
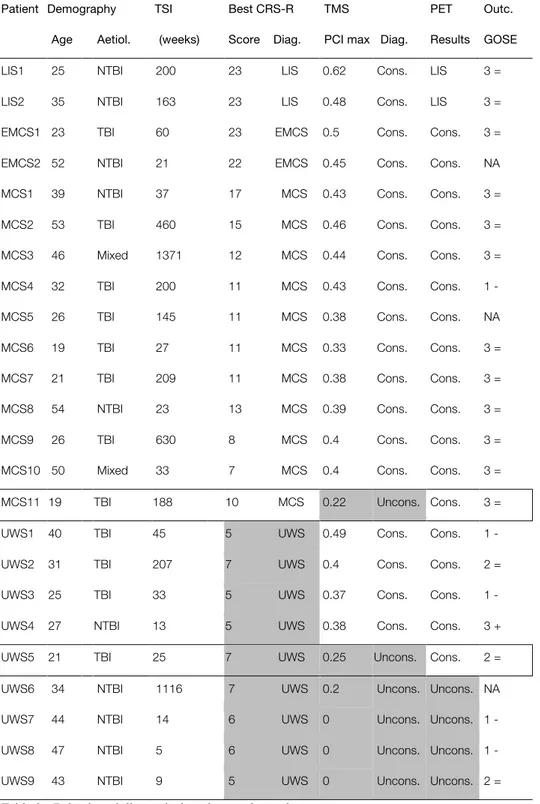
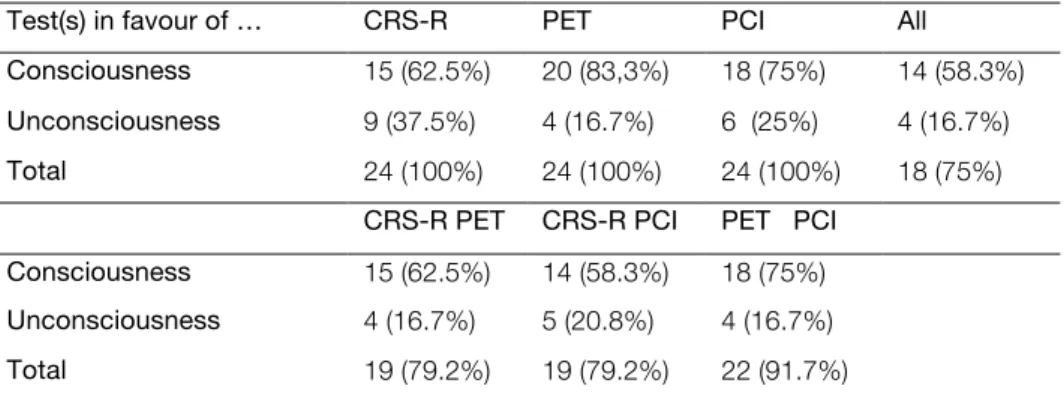
Table 3 - Behavioural diagnosis, imaging results, and outcome ... 36
Table 4 - Concordance of CRS-R, PET, and PCI results ... 39
List of abbreviations
CRS-R – Coma recovery scale – revised DMN – Default mode network
DOC – Disorder(s) of consciousness DTI – Diffusion tractography imaging DWI – Diffusion weighted imaging EEG – Electroencephalography
EMCS – Emergence from the minimally conscious state FA – Fractional anisotropy
FDG-PET – 18fluoro-deoxyglucose positron emission tomography fMRI – Functional magnetic resonance imaging
FOUR – Full outline of unresponsiveness GCS – Glasgow coma scale
LIS – Locked-in syndrome MCS – Minimally conscious state
MCS* – Non-behavioural minimally conscious state MRI – Magnetic resonance imaging
PCI – Perturbational complexity index TBI – Traumatic brain injury
TEP – TMS evoked potential
TMS – Transcranial magnetic stimulation UWS – Unresponsive wakefulness syndrome
Abstract
Patients with chronic disorders of consciousness make a challenging population. On the clinical side, establishing an accurate diagnosis is arduous, as the signs of consciousness can be subtle, or even undetectable behaviourally. Both the families and the caregivers need truthful information to make tough decisions about the patient’s management. Transcranial magnetic stimulation, coupled with high-density electroencephalography, is a promising technique to improve our diagnostic ability. The perturbational complexity index derived from this technique is able to distinguish between unconscious and conscious conditions. Its specificity remains to be determined. On the scientific side, the long-standing quest to discover the neural correlates of consciousness is still ongoing. Patients with disorders of consciousness have structural brain damage, and several areas may lose their ability to causally interact in complex patterns with long distance structure. The relation between this ability and structural integrity remains undetermined, despite a vast amount of neuroimaging studies on several networks and connectivities in this population.
Our objectives are i) to cross-validate the perturbational complexity index with other neuroimaging techniques, and to determine its specificity, and ii) to determine the relation between global structural integrity and the brain global ability to sustain complex long-range interactions.
To do so, we first combined transcranial magnetic stimulation with fluoro-deoxyglucose positron emission tomography, a validated technique studying the brain metabolism, in a population of patients behaviourally characterized by repeated assessments with the gold standard scale, the coma recovery scale – revised. To meet our second objective, we computed and compared the perturbational complexity index and the global fractional anisotropy, a magnetic
resonance imaging marker of structural integrity, in patients and in healthy subjects.
We found an excellent congruence between electrophysiological and metabolic results in our first study, even in behaviourally unconscious patients showing indirect signs of consciousness. In our second study, we demonstrated that structural integrity largely correlated with the perturbational complexity index, and did not depend on the time since onset or the aetiology.
This confirms the diagnostic value of transcranial magnetic stimulation and the perturbational complexity index. It is not only sensitive at the single subject level, but also highly specific. It can detect covert signs of consciousness, as confirmed by other neuroimaging techniques. As such, it could be integrated in diagnostic algorithms and improve their accuracy, leading to better management of these patients. Moreover, the brain’s ability to sustain complex long-range interactions is highly dependant on the global structural integrity. By looking further in detail at the local correlation between these two parameters, our understanding of the emergence of consciousness from fixed structure with variable connectivity would improve. This would be one step forward in the quest for the neural correlates of consciousness.
Résumé
Les patients souffrant d’une altération chronique de la conscience constituent une population difficile mais motivante. Du point de vue clinique, établir un diagnostic précis est compliqué, car les signes de conscience peuvent être subtils, voire indétectables comportementalement. Tant les familles que les soignants ont besoin d’informations fiables pour prendre des décisions difficiles au sujet de la prise en charge du patient. La stimulation magnétique transcrânienne couplée à l’électroencéphalographie à haute densité est une technique qui pourrait améliorer notre précision diagnostique. L’index de complexité perturbationelle dérivé de cette technique est capable de distinguer les sujets conscients et inconscients. Sa spécificité n’est pas encore démontrée. Du point de vue scientifique, la longue recherche des corrélats neurophysiologiques de la conscience est toujours en cours. Les patients avec une altération de la conscience ont des lésions cérébrales, et différentes aires peuvent perdre leur capacité d’interagir de façon complexe avec des structures distantes. La relation entre cette capacité et l’intégrité structurelle du cerveau n’est pas connue, malgré de très nombreuses études en neuroimagerie sur différents réseaux et leur connectivité.
Nos objectifs sont i) de valider l’index de complexité perturbationelle avec d’autres techniques de neuroimagerie, et d’en déterminer la spécificité, et ii) d’établir la relation entre l’intégrité structurelle globale et la capacité du cerveau à entretenir des interactions complexes et de longue distance.
Pour ce faire, nous avons d’abord associé la stimulation magnétique transcrânienne avec la tomographie à émission de positrons au glucose marqué, une technique validée d’étude du métabolisme cérébral, chez des patients bien caractérisés comportementalement par l’administration répétée d’une échelle
validée, l’échelle « coma recovery scale – revised ». Afin de rencontrer notre second objectif, nous avons calculé et comparé l’index de complexité perturbationelle et la fraction d’anisotropie globale, un marqueur d’intégrité structurelle dérivé de l’imagerie par résonnance magnétique, chez des patients et des sujets sains.
Nous avons trouvé une excellente concordance entre les données électrophysiologiques et métaboliques dans notre première étude, et ce même chez les patients comportementalement inconscients démontrant des signes indirects de conscience. Dans notre seconde étude, nous avons démontré que l’intégrité structurelle était largement corrélée avec l’index de complexité perturbationelle, et que cette interaction ne dépendait pas du temps écoulé depuis le coma, ou de son étiologie.
Ces résultats confirment la valeur de la stimulation magnétique transcrânienne comme outil diagnostic, ainsi que de l’index de complexité perturbationelle. Il est en effet non seulement sensible au niveau individuel, mais également hautement spécifique. Il est capable de détecter des signes indirects de conscience, comme confirmé par d’autres techniques de neuroimagerie. Dès lors, il pourrait être intégré dans les algorithmes diagnostiques et améliorer leur précision, menant à une meilleure prise en charge de ces patients. De plus, la capacité du cerveau de soutenir des interactions complexes et distantes est hautement dépendante de l’intégrité structurelle globale. En étudiant plus en détail la corrélation locale entre ces deux paramètres, notre compréhension de l’émergence de la conscience depuis une structure fixe mais avec une connectivité fonctionnelle variable en serait grandie. Ce serait un pas supplémentaire dans notre connaissance des corrélats neurophysiologiques de la conscience.
Chapter I
Introduction
Section based upon the following publications:
Bodart, O., Laureys, S., Gosseries, O., 2013. Coma and disorders of
consciousness: scientific advances and practical considerations for clinicians. Semin. Neurol. 33, 83–90. doi:10.1055/s-0033-1348965
Gantner, I.S., Bodart, O., Laureys, S., Demertzi, A., 2012. Our rapidly changing understanding of acute and chronic disorders of consciousness: challenges for neurologists. Future Neurol. 8, 43–54. doi:10.2217/fnl.12.77
Bodart, O., Charland-Verville, V., Laureys, S., Gosseries, O., 2013.
Neuroimaging in Disorders of Consciousness, in: Filippi, M. (Ed.), Oxford Textbook of Clinical Neurology. Oxford University Press, London.
Bodart, O., Thibaut, A., Laureys, S., Gosseries, O., 2013. Disorders of
Consciousness, in: Citerio, G., Smith, M., Kofke, A. (Eds.), Oxford Textbook of Neurocritical Care. Oxford University Press, London.
1. Disorders of consciousness
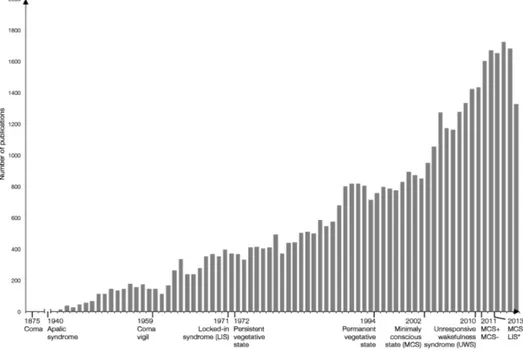
In the past fifteen years, thanks to increased interest and technological advances, scientific knowledge about disorders of consciousness (DOC) has risen tremendously (Figure 1). We will discuss that, as a result, the nosology has greatly expanded, the diagnostic criteria have been refined, and the neurophysiology underlying these disorders is better understood. Still, all the advances made in this field have not been translated to clinical practice yet, and several problems remain. Technology has limitations, the expanding nosology raises new interrogations, and the relationship between several findings often stays nebulous.
Figure 1 - Number of publications on DOC and evolution of nosology
This figure illustrates the huge increase in publications about disorders and consciousness, along with key definitions dates of the different states. Based on Pubmed research performed in September 2017 with the keywords “disorders of consciousness”, “coma”, “vegetative state”, “minimally conscious state”, “locked-in syndrome”. Updated from Gosseries, O., Zasler, N., Laureys, S., 2014. Recent advances in disorders of consciousness: focus on the diagnosis, Brain Inj., 28(9), 1141-50.
1.1. Disorders of consciousness are better defined
More than 40 years after the first definition of the vegetative syndrome (1), the nosology of DOC has vastly expanded (2). DOC encompass a range of diseases characterized by altered state of arousal, awareness, or both. Arousal – the vigilance, the awakening – and awareness – the content of consciousness, of the self and the environment – are the two components of consciousness in its operational definition (3,4). DOC arise after a period of coma, a transient state of total lack of both arousal and awareness, even after stimulations. Coma is caused by a severe brain injury, but aetiologies are plentiful (3,5,6). They are usually grouped into anoxic brain injuries, traumatic brain injuries (TBI), and other non-anoxic non-traumatic aetiologies. Coma is a transient state: it lasts from one hour to some weeks at most. Patients then either die, or can gradually recover consciousness. The recovery of arousal without awareness characterizes the vegetative state (7,8). To better reflect the condition of these patients, awake but unresponsive, and avoid a negative connotation of being “vegetable-like”, the new name “unresponsive wakefulness syndrome” (UWS) has been proposed in 2010 and used since then (9). These patients have fluctuating periods of arousal, although they do not actually sleep (10–13). When awake, they do not show any sign of consciousness, but may exhibit reflexive behaviours, spontaneously or in response to stimulations. However, subtle signs of consciousness can easily be missed (14–17). They are primordial to detect, as they tell apart the UWS from the minimally conscious state (MCS). MCS was defined as a new disorder of consciousness in 1997 (18), and the diagnostic criteria were outlined in 2002 (19). Patients in MCS show minor and fluctuant signs of consciousness, such as visual pursuit or fixation, object localization, localization of noxious stimulation, object manipulation, automatic motor reaction, and reproducible movement to command. MCS has been further categorized in MCS- and MCS+, as only the latter shows evidences of preserved language processing (20). Yet, by definition all these patients cannot communicate. The recovery of functionalcommunication, or of functional use of objects, are diagnostic criteria for the emergence of MCS (EMCS) (21). Sometimes, because they do not move nor speak, patients are mistakenly considered unconscious. They are in fact fully conscious, but unable to respond to stimuli consecutively to the complete interruption of the pyramidal tracts and most cranial nerves, leading to a complete paralysis of voluntary movements (22). When assessed carefully, these locked-in patients (LIS) are able to respond to command, and even communicate, through eyes movements and blinking. Some patients however have lost even the ability to move the eyes, and are behaviourally undistinguishable from UWS patients. The brain injury location should clue the caregivers in about the possibility of a total LIS, leading to further investigations (23).
Hence, instead of a few categories of altered states of consciousness – coma, vegetative state, and severe disability – , we now face a continuum of DOC – coma, UWS, MCS-, MCS+, EMCS (Figure 2). Moreover, these patients often fluctuate, and require dedicated and very sensitive tools to diagnose accurately.
Figure 2 - Nosology of behavioural disorders of consciousness
This figure illustrates the natural evolution of consciousness in post-comatose patients, along with key diagnostic criteria for each step. Note that due to the common fluctuations in consciousness and vigilance, the patient may temporarily evolve to a less conscious state. Adapted from Bodart,
O., Thibaut, A., Laureys, S., Gosseries, O., 2013. Disorders of Consciousness, in: Citerio, G.,
Smith, M., Kofke, A. (Eds.), Oxford Textbook of Neurocritical Care. Oxford University Press, London.
1.2. Behavioural tools have been refined
The definition of these new DOC, and the development of clear diagnostic criteria, has been translated in sensitive and dedicated behavioural scales. Prior to these, the main scale to assess consciousness was the Glasgow Coma Scale (GCS) (24). Its purpose was to help managing acute patients with TBI, and having prognostic factors, by assessing eye opening, and motor and verbal response to stimulation. Thanks to its simplicity of use, the GCS became the scale to assess DOC, even after the acute stage, and even after non TBI (25). However, it has several limitations: the verbal scale cannot be scored in ventilated patients, a situation often encountered in the intensive care units, and except for some motor and verbal features, does not look for signs of consciousness, especially minor ones. That’s why the Full Outline of UnResponsiveness scale (the FOUR) has been developed (26). Composed of four subscales, each scored from 0 to 4, this scale assesses motor responses as in the GCS, but also looks for visual pursuit, one of the first signs of consciousness recovery (21). Moreover, it can be applied to all patients in the intensive care units, by looking at the ventilation pattern instead of a verbal response. Finally, it can make the diagnostic of brain death as it evaluates brainstem reflexes. Outside of the intensive care units, the FOUR is not sensitive enough to minor signs of consciousness, and the gold standard behavioural scale is the Coma Recovery Scale – Revised (CRS-R) (Table 1) (27,28). Other scales have been developed, but none has the sensitivity and specificity of the CRS-R when it comes to detect MCS patients (29). The CRS-R is composed of six subscales, the auditory, the visual, the motor, the verbal, the oromotor, and the arousal scales, each assessing different items of increasing complexity. Some of these items are diagnostic criteria for MCS, and as the scale also assesses functional use of object and functional communication, it can also detect EMCS.
GCS FOUR
Eye response Eye response
4. Eyes open spontaneously 4. Eyelids open or opened, tracking or
blinking to command
3. Eye opening to verbal command 3. Eyelids open but not tracking
2. Eye opening to pain 2. Eyelids closed but open to loud voice
1. No eye opening 1. Eyelids closed but open to pain
0. Eyelids remain closed with pain
Motor response Motor response
6. Obeys commands 4. Thumbs up, fist, or peace sign to
command
5. Localizing pain 3. Localizing pain
4. Withdrawal from pain 2. Flexion response to pain
3. Stereotyped flexion to pain 1. Extension response to pain
2. Stereotyped extension to pain 0. No response to pain or generalized
1. No motor response myoclonus status epilepticus
Verbal response Brainstem reflexes
5. Oriented 4. Pupil and corneal reflexes present
4. Confused 3. One pupil wide and fixed
3. Inappropriate words 2. Pupil or corneal reflexes absent
2. Incomprehensible sounds 1. Pupil and corneal reflexes absent
1. No verbal response 0. Absent pupil, corneal, and cough reflex
Respiration
4. Not intubated, regular breathing pattern
3. Not intubated, Cheyne-Stokes breathing pattern
2. Not intubated, irregular breathing 1. Breathes above ventilator rate 0. Breathes at ventilator rate or apnea
CRS-R
Auditory function Oromotor/verbal function
4. Consistent Movement to Command* 3. Intelligible Verbalization*
3. Reproducible Movement to Command* 2. Vocalization/Oral Movement
2. Localization to Sound 1. Oral Reflexive Movement
1. Auditory Startle 0. None
0. None
Visual function Communication
5. Object Recognition* 2. Functional: Accurate+
4. Object Localization: Reaching* 1. Non-Functional: Intentional*
3. Visual Pursuit* 0. None
2. Fixation*
1. Visual Startle 0. None
Motor function Arousal
6. Functional Object Use+ 3. Attention
5. Automatic Motor Response* 2. Eye opening w/o Stimulation
4. Object Manipulation* 1. Eye opening with Stimulation
3. Localization to Noxious Stimulation* 0. Unarousable
2. Flexion Withdrawal 1. Abnormal Posturing 0. None/Flaccid
Table 1 - Behavioural scales
This table illustrates 3 validated scales for the evaluation of acute comatose patients (GCS and FOUR) and the CRS-R, a validated and sensitive scale to diagnose UWS, MCS and EMCS. The GCS is composed of 3 subscales (eye, verbal and motor responses) and can score from 3 to 15. The FOUR is composed of 4 subscales (eye, motor, brainstem and respiration) each composed of 4 items. The CRS-R is composed of 6 subscales (auditory, visual, motor, oromotor/verbal, communication and arousal). It can score from 0 to 23. In the CRS-R, * denotes MCS, and + denotes EMCS. Adapted from Bodart, O., Thibaut, A., Laureys, S., Gosseries, O., 2013. Disorders of Consciousness, in: Citerio, G., Smith, M., Kofke, A. (Eds.), Oxford Textbook of Neurocritical Care. Oxford University Press, London.
Despite the fact that the CRS-R was published with a detailed administration procedure, several improvements have been made since its publication. The systematic use of a mirror detects more often visual pursuit (31–33) and thus allows uncovering more patients in MCS. Visual pursuit however relies on the examiner appreciation, and objective measures are being developed (34). Similarly, using the patient’s own name facilitates the detection of sounds localisation (35). Moreover, performing only one behavioural evaluation is not enough to establish a correct diagnosis. As the patients fluctuate, an optimal number of five CRS-R should be carried out in a relatively short period of time (36). In conclusion, good standardized behavioural scale – the CRS-R – exists, and the administration procedure has been refined to maximize its diagnostic power. However, consciousness may still be underestimated using behavioural tools only: the patients may be unable to understand the command due to aphasia (37,38), deafness, or dialect issues, be limited in their motor output due to paralysis, spasticity, hypotonic status, be unwilling to collaborate, be too drowsy to participate due to pathological fluctuation of vigilance or from drugs, … To avoid these limitations and to try to provide objectives measures of consciousness, neuroimaging technologies have been developed.
1.3. Ancillary techniques are plenty …
Magnetic resonance imaging (MRI) is probably the most simple and efficient way to study the localization, severity, number, and nature of brain injuries. A relation between these parameters and the patient’s state of consciousness has been looked for by several research groups. No distinction between UWS and MCS patients can be made using structural MRI only, as these patients sometimes share the same injuries despite their different levels of consciousness (39). However, a poor prognosis has been found in patients with lesions in the basal ganglia, the thalamus (especially if bilateral), and the brainstem (40–44). The number of lesions itself is correlated with the outcome (45). To have an
even sharper view of the brain’s structural integrity, diffusion weighted imaging (DWI) and diffusion tractography imaging (DTI) can be used. Diffusion sequences measure the degree and direction of water molecules movements, movements that can be impeded by the presence of, for example, axons. DWI thus reflects the white matter structural integrity, and DTI reflects the structural connectivity within the brain (46). DWI features can differentiate between groups of UWS and groups of MCS, and correlate with the CRS-R total score (47). In UWS patients, white matter injuries not seen on conventional MRI can be detected with DTI, up to severed tracts in the brainstem of patients with TBI (48).
Functional MRI (fMRI) can look further than structure with the use of blood oxygenation level dependant sequences. By using the difference in signal between oxygenated and deoxygenated blood, blood oxygenation level dependant sequences can detect variations in local cerebral perfusion. Functional connectivity can be approached by looking at the statistical association between these variations in different areas. At rest, a network encompassing the anterior and posterior cingulate, the temporo-parieto-occipital junction and the thalamus is activated, and called the default mode network (DMN). The connectivity in this network correlates with the level of consciousness (49); it is null in brain dead patients (50) and nearly normal in patients with LIS (51). This network can be further divided between its internal and external parts, and these were respectively related to the awareness of the self and of the environment (52). The DMN is characterized by hyperconnectivity, which translates in a lack of anticorrelation between network components, in UWS and MCS but not in EMCS patients (53). Other resting state networks (executive control, salience, sensory-motor, auditory and visual) can be studied (54). The DMN and the auditory networks have very high accuracy in differentiating between healthy controls, UWS and MCS patients (55). Using active paradigms, in which subjects are asked to imagine performing tasks, fMRI can detect wilful
modulation of brain activity in healthy subjects (56) and patients with DOC (57– 62), sometimes even in patients who are behaviourally unresponsive. By detecting a response to command, although in an indirect way, these paradigms are a great addition in the patients’ diagnostic work-up.
Behind the brain structure and function, one can evaluate its metabolism. This is usually done with 18fluoro-deoxyglucose positron emission tomography (FDG-PET), which demonstrates a global decrease of metabolism in UWS patients (63–65). Yet, recovery of consciousness is not related to a recovery of global metabolism (66,67). Indeed, the metabolism is impaired in a frontoparietal network, encompassing the prefrontal and posterior parietal associative cortices, the mesiofrontal area, the precuneus and the thalamus (68,69). Recovery of consciousness correlates with the metabolic activity in this network (70). Using the pattern of preserved or impaired metabolism in this network, it is possible to distinguish between UWS and MCS patients with a good accuracy (71,72). Similarly to what has been done using MRI and FDG-PET, the injured brain has been studied by electroencephalography (EEG). At rest, entropy measures derived from EEG signal can distinguish between unconscious and minimally conscious patients (73). Alpha power in the occipital area is a positive prognostic factor in UWS patients (74). Event-related potentials (the EEG average of stimulus-induced time-locked activity) late components are thought to reflect the conscious processing of information (75). Passive paradigms can also reveal disruption of top-down connectivity (from higher order to primary cortices) in UWS patients but not in MCS patients (76). Aiming to reproduce fMRI results at the bedside, active EEG paradigms were developed. They can detect a response to command in a patient with total LIS (23), and in patients with DOC (77–80). Electromyography has also been used to detect subclinical motor response in DOC (81).
Numerous technologies (MRI, DWI, fMRI, FDG-PET, EEG, electromyography) have been developed and used to help establishing accurate diagnosis in DOC. On top of circumventing several limitations of behavioural evaluations, these techniques improved our understanding of the neural correlates of consciousness. Nonetheless, caution should be kept when interpreting the results for clinical purposes.
1.4. … but still have limitations
Indeed, using active paradigms is cognitively very demanding, and some patients are unable to wilfully modulate their brain activity, sometimes despite being able to respond to command behaviourally. If a positive result from this technique is considered very similar to a behavioural sign of consciousness, the absence of response cannot be considered as an absence of consciousness (82). The opposite problem occurs with passive and resting states paradigms. Surely, the measures these techniques provide are quite far removed from the behavioural signs of consciousness. Caution should then be taken while interpreting positive results, and especially when translating group findings to the clinical single subject. Moreover, as these technologies rely on complex methodologies and statistics, errors can occur and modify the results, in both ways. For many of these techniques, the outcome still depends on the patients’ performance, on their collaboration, on their understanding of the instructions. So if all these technologies have helped us progress in the understanding of these DOC, and in making accurate diagnosis, we have to keep in mind that they still have limitations.
1.5. Why it matters
All these behavioural and technological tools have not been developed in vain. They are necessary to establish an accurate diagnosis of the residual level of consciousness in these non-communicating patients. An accurate diagnosis is
mandatory to provide the family and the caregivers with prognostic information, for example. Indeed, UWS and MCS patients do not have the same outcome, and there is a major role of the brain injury’s aetiology. UWS patients have a worse outcome than MCS, and an anoxic aetiology as a poorer prognosis than TBI. Hence, UWS from anoxic brain injuries have very limited chance to recover signs of consciousness, and the situation is considered permanent after three months (7,8,83,84). On the other hand, MCS patients from TBI recover far more often, and can still do so 12 months after the original insult (83,84). Even though recovery after these traditional limits is observed, it usually coincides with very poor functional outcome (85,86). Ancillary techniques also provide valuable prognostic information. For example, the fractional anisotropy (FA), a feature of DWI reflecting the degree of anisotropy, hence, indirectly, of axonal integrity, is often used. This marker in specific tracts such as the corpus callosum and the internal capsule correlates with the functional outcome (87) and the diagnosis at the time of discharge (88). At the acute phase, a composite score based on the FA in different axonal tracts predict the outcome after traumatic (89,90) or anoxic (91) brain injuries. Using fMRI, the presence of connectivity within the DMN has positive prognostic value (92).
An accurate diagnosis is also crucial for appropriate therapeutic management, such as the treatment of pain. Dealing with pain in UWS and MCS patients is an issue, as by definition they are non-communicating. There is thus a risk of undertreatment, as the patient cannot report suffering, or overtreatment, with the risks of side effects it implies. The Nociception Coma Scale – Revised is an observational scale that has been developed to overcome these limitations, and can assess and monitor pain in these patients to guide the treatment (93–95). Moreover, we know that unresponsive patients do not “feel” pain, as noxious stimulations only activate the primary cortex, while MCS show a wide activation of the pain matrix for similar stimuli (96–98). However, some have underlined the risk that some behaviourally unresponsive patients could in fact feel pain
(99), while other demonstrated the major role of personal beliefs in managing pain in these patients (100). Treatments to improve level of consciousness also have different effects on UWS and on MCS patients. Amantadine, a dopaminergic agonist, can lower the mean disability rating scale score for several weeks in MCS but not in UWS patients in a placebo-controlled trial (101). Transcranial direct current stimulation, a non-invasive brain stimulation technique, can improve the CRS-R scores in MCS, but not in UWS patients (102).
Accurate diagnosis is also critical for ethical reasons. Indeed, given their different prognosis, end-of-life issues are treated differently for UWS and MCS by the caregivers, once again mainly depending on personal beliefs (103,104). The law is variable between states, sometimes allowing interruption of hydration and nutrition in UWS but not MCS patients, sometimes preventing any interruption of treatment (105–107).
Finally, accurate diagnosis is crucial to produce valid science. If different teams do not share the same diagnostic criteria, their results will not be comparable, and identifying the neural correlates of consciousness will not be possible. In conclusion, it is worth investing time and effort to achieve an accurate diagnosis, to be able to communicate correct prognosis, to tell the estimated effect of treatment, to adequately manage pain, to discuss end-of-life issues, and for science itself.
1.6. Several questions remain
Despite all these theoretical and technological advances, many issues remain unsolved. Currently, there is no technique able to differentiate UWS from MCS patients reliably, at the single patient level, and at the bedside. Indeed, fMRI active paradigms, while having specificity high enough to be accurate at the
single patient level, are not very sensitive. Many subjects who were able to behaviourally respond to command could not do so using this technique (108). FDG-PET has a good accuracy in discriminating between UWS and MCS patients (71), but is not a bedside technology, and exposes the patients to radioactive material. Moreover, it lacks sufficient accessibility. We will discuss later whether transcranial magnetic stimulation (TMS) coupled with high density EEG (TMS–EEG) is a good candidate to answer all these accuracy and accessibility issues, and is available at the bedside, or not.
All these neuroimaging techniques also revealed several cases where patients, behaviourally unambiguously unresponsive, had patterns of results more compatible with consciousness than with unconsciousness. This is the case with active fMRI, where some UWS patients are able to use the paradigm to respond to command (57,58,61,108). Active paradigms using EEG turned up some cases too (79,80). FDG-PET can also detect patterns of preserved metabolism in UWS patients, patterns usually only seen in patients at least minimally conscious. A majority of these patients recovered signs of consciousness at the 12 months follow-up (71). So far, little is known about this subpopulation of patients. Are they unable to behaviourally express their preserved consciousness, or are they subjected to the limits of neuroimaging in term of accuracy? Combining multiple techniques might help solve this question.
2. TMS–EEG
Among all the neuroimaging techniques, TMS–EEG is the one we will focus on in this thesis. The combination of a non-invasive brain stimulation technique with the high-density EEG temporal resolution offers novel ways to study the brain, even the injured one, and has many advantages over other technologies. TMS, by generating brief magnetic pulses, induces electric field at the cortical surface, which in turn creates ionic currents depolarizing the neuronal membranes. The induced currents are the most likely to occur at the axonal level, as they have the lowest threshold for depolarization (109,110). This is especially true around bending axons, as it is where the induced electric field changes the most. As the magnetic field rapidly decreases with the distance, only the superficial cortical structures or the white matter just underneath can be depolarized directly (111,112). This depolarization of a small cortical area can however propagates through intra- and inter-hemispheric tracts to other cortical areas, and through projecting fibres to deeper cerebral structures. The ability of this perturbation to actively induce activity at a distance, hence the causal interaction between distant brain areas, reflects the effective connectivity. It differs from the functional connectivity, which is the statistical temporal correlation of the activation of several areas without a causal link, and from the structural connectivity, which reflects the anatomical connections that exist between structures, with no inference about the functionality of these connections (113). Recording the perturbation induced by TMS is possible with EEG, given its extremely high temporal resolution. However, for a long time EEG amplifiers were not able to deal with the large artefact induced by the TMS, and were saturated for several seconds, preventing the recording of any TMS evoked potential (TEP). Thanks to the development of sample-and-hold circuits, amplifiers are now able to record the EEG a few milliseconds only after the TMS pulse (114–116).
The TEPs obtained are reproducible and sensitive to changes in parameters (117). Each cortical area generates TEPs in its own frequency, respectively in the fast β/γ, β, and α frequency bands for the frontal, parietal, and occipital lobes (118). The generator for the α frequency of the occipital TEPs and for the spontaneous posterior α rhythm are the same, and share the same influence from visual attention (119). These TEPs are constrained by structure, as assessed by DTI, and the correlation between structural and functional connectivity decreases after the TMS pulse (120,121).
Several indices, reflecting the cortical excitability, effective connectivity, or the ability of TMS to modify the phase of on-going neuronal activity, have been developed (122). These have had several applications. While studying the neural correlates of cognitive tasks, TMS–EEG can detect an increase in effective connectivity between the frontal eye field and posterior brain areas during visual attention (123). Similarly, during motor attention, cortical excitability is greater (124). While performing spatial memory task, excitability and effective connectivity from the superior parietal lobule are rising as compared to resting conditions (125). This verifies in the visual memory network after long-term training (126). TMS–EEG also demonstrates specific neurophysiological changes in pathological states. In epileptic patients, cortical excitability as measured with TMS–EEG is increased (127), especially in the epileptogenic network (128), or before epileptiform discharges in generalized genetic epilepsies (129). The use of antiepileptic drugs, such as Lamotrigine and Levetiracetam, can modify the TEPs (130), and TMS–EEG is sometimes used to study the neurophysiological effect of drugs in development such as GABA-A antagonists (131). It can monitor the effect of non-invasive brain stimulation techniques, such as transcranial direct current stimulation that induces a rise in cortical excitability (132). This technique also has several applications in
psychiatric disorders. In schizophrenia, cortical excitability and effective connectivity from the premotor cortex is reduced, and correlates with cognitive deficits (133). These patients share with bipolar disorder and major depression a reduction of the TEPs natural frequency on the frontal lobe (134). In bipolar disorder, this reduction seems to be a biomarker of the disease, as it is present whether the patient is symptomatic or not (135). History of alcohol abuse is related with persistent changes in brain’s connectivity, and with an increase in cortical excitability (136). Smartphone abuse with impaired attention is linked with decreased excitability of right dorsolateral prefrontal cortex (137). In patients with Alzheimer disease divergent results are found: there is a decreased excitability in the prefrontal cortex (138) but an increased excitability in the sensorimotor cortex (139).
Most importantly, TMS–EEG has incredible value in studying consciousness and its alterations, whether from physiological, pharmacological, or pathological origin. According to modern theories, consciousness arises from the brain’s ability to integrate information (140), meaning that it has access to a large repertoire of possible states yet cannot be decomposed in smaller modules. One could look at how different brain areas causally interact (integrate information) and record the complexity of this interaction (to ensure it is not the sum of simple activities). TMS–EEG can perturb part of the thalamocortical system, and record how this perturbation causally interacts with distant areas over time. This spatio-temporal complexity could thus reflect the brain’s ability to sustain consciousness (112). In wakeful healthy subjects, the TEPs recorded show that the initial depolarization affects multiple areas on both hemispheres, and the recorded response lasts for at least 300ms (141). While these subjects are in NREM sleep, and hence are physiologically unconscious, the TEPs are composed of a large slow wave that remains local, under the stimulated area (141,142). Using higher stimulation amplitude, the response can once again encompass both hemispheres; however, it remains a simple large slow wave,
hence without much complexity (141). Small variations in the TEPs are possible in this state: the impact of TMS on on-going activity is shorter, and the response larger, when people are not dreaming. This illustrates the effect of small changes in the thalamocortical system on consciousness (143). Other parameters can modify the recordings: cortical excitability increases with time spent awake, exemplifying the effect of an increased sleep pressure (144), yet it remains under the influence of circadian rhythm (145). In REM sleep, when subjects can report the content of their dreams, the TEPs are similar to those observed in wakefulness, involving both hemispheres in a complex pattern (142).
Unconsciousness can also be obtained using general anaesthesia. The responses acquired using Midazolam (146), Propofol, and Xenon (147) all share the same reduction in the spatio-temporal complexity, and all remain slow, local and of short duration. However, the cortical excitability (in this case, the amplitude of the first component of the response) differs between these molecules (large with Xenon, small with Propofol) (146,147). Using Ketamine, subjects seem as unconscious as with the other tested drugs, yet upon awaking they can report vivid conscious dream-like experiences. The TEPs obtained under Ketamine anaesthesia are much more complex and closely alike those observed in wakefulness and REM sleep (147).
Unconsciousness, or altered consciousness, can also arise from severe brain injuries, such as those observed in patients with DOC. When patients are completely unconscious, in UWS, the TEPs are slow, local, and short lasting, as in unconscious healthy subjects, during NREM sleep or general anaesthesia (148). They can also be inexistent despite high stimulation intensity, especially in patients with anoxic brain injuries, or if stimulation lands on cortical lesions in TBI (149). This reminds the major importance of neuronavigation while performing TMS–EEG in this population. In MCS patients, the responses are more complex than in UWS, spreading away from the stimulation site (148,150).
In LIS, the TEPs are similar to those observed in awake healthy subjects (148). When unconscious patients recover – minimal – signs of consciousness, the complexity of the response increases, sometimes before the behavioural changes (148). TMS–EEG thus generate either TEPs with fast oscillations, that spread bilaterally, away from the stimulation area, in wakeful healthy subjects, during REM sleep, Ketamine anaesthesia, or in LIS patients, or TEPs with slow oscillations, that remain local under the stimulation area, in NREM sleep, Midazolam, Xenon, and Propofol anaesthesia, or in UWS patients. MCS patients have TEPs between normal subjects and UWS. Figure 3 illustrates the morphologies of TMS responses in different states of consciousness.
Distinguishing between UWS and MCS by looking at the TEPs shapes only is not very reliable, though. An objective measure of the spatio-temporal complexity of TEPs was thus designed: the perturbational complexity index (PCI). This measure is normalized by the source entropy, and is above 0.31 when consciousness is present (normal wakefulness, REM sleep, Ketamine anaesthesia, LIS), and below 0.31 when consciousness is absent (NREM sleep, Propofol, Midazolam, and Xenon anaesthesia, UWS). Interestingly, PCI is also above 0.31 in MCS patients, and thus seems to be able to distinguish between UWS and MCS at the single subject level (151). Table 2 summarizes the advantages and inconveniences of TMS–EEG over other neuroimaging techniques (152).
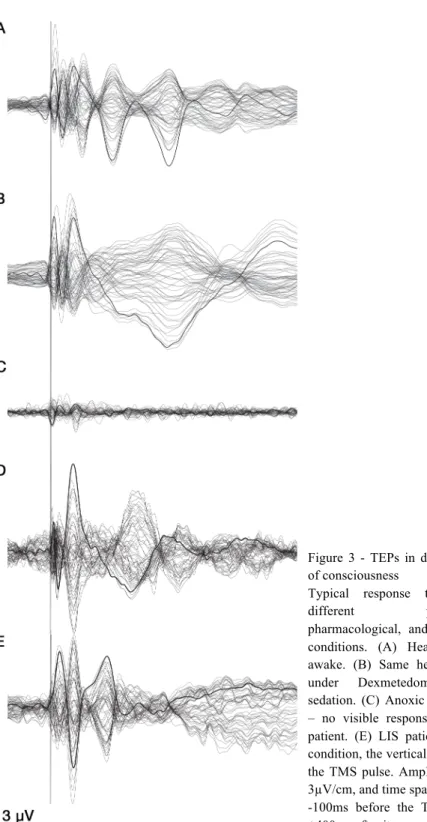
Figure 3 - TEPs in different states of consciousness
Typical response to TMS in
different physiological,
pharmacological, and pathological conditions. (A) Healthy subject, awake. (B) Same healthy subject
under Dexmetedomidine deep
sedation. (C) Anoxic UWS patient – no visible response. (D). MCS patient. (E) LIS patient. For each condition, the vertical line indicates the TMS pulse. Amplitude scale is 3µV/cm, and time span from -100ms before the TMS pulse to +400ms after it.
Advantages Disadvantages
Bypass afferent sensory pathways. Dependent of the subject cortical excitability,
lowered in case of brain atrophy and with several drugs (including antiepileptic). Does not require functioning efferent
pathways. Requires stable state of wakefulness.
Does not require subject active participation. Limited spatial resolution.
Does not require language processing. Acute patients assessment limited by the
presence of metallic implant, external CSF drain, or uncontrolled epilepsy.
Highly reproducible within subject. Requires heavy logistic and subject
preparation.
Can be use at the patient bedside. Source modeling possibly inaccurate in
cases of extensive brain lesions or scalp deformations.
Sensitive to changes in stimulation parameters.
Good temporal resolution. Probes effective connectivity.
Discrimination between conscious and unconscious conditions.
Supported by recent theories of consciousness.
Table 2 - Advantages and disadvantages of TMS–EEG
This table summarizes general advantages and disadvantages of TMS–EEG over other diagnostic tools (behavioural or neuroimaging). CSF: Cerebrospinal fluid. Adapted from Napolitani, M.*,
Bodart, O.*, Canali, P., Seregni, F., Rosanova, M., Laureys, S., Massimini, M., Gosseries, O.,
2014. Transcranial magnetic stimulation combined with high density EEG in altered state of consciousness. Brain Inj. 28, 1180–1189. doi:10.3109/02699052.2014.920524 (* contributed equally)
TMS–EEG consequently is an attractive technique, especially in patients with DOC. It bypasses several limitations that other neuroimaging techniques have. It can discriminate between conscious and unconscious conditions at the single subject level, which is mandatory for a potential clinical diagnostic tool. It is also the sole technology to assess the perturbational effective connectivity, which could be combined to other connectivities (structural and functional) and with underlying brain metabolism to increase our understanding of the neural correlates of consciousness.
3. Objectives
Global understanding of DOC has greatly improved, as we discussed above. The nosology expanded from a few grained to a continuum of alteration of consciousness. This leads to more difficulties in making accurate diagnosis, despite considerable technological advances. TMS–EEG, through PCI, seems to be a fantastic tool to discriminate between UWS and MCS. Our first objective is to validate this technique with other validated neuroimaging technologies. We have seen that some UWS patients have neuroimaging patterns compatible with consciousness, not congruent with their behaviour. Our second objective is to settle if these results are artefacts, or if they actually reflect covert cognition. Finally, TMS–EEG allows measuring the perturbational effective connectivity: our last objective is to establish how effective connectivity behaves compared to structural connectivity.
Chapter II
Shared TMS–EEG
methodology
Section based upon the following publications:
Napolitani, M.*, Bodart, O.*, Canali, P., Seregni, F., Rosanova, M., Laureys, S., Massimini, M., Gosseries, O., 2014. Transcranial magnetic stimulation combined with high density EEG in altered state of consciousness. Brain Inj. 28, 1180–1189. doi:10.3109/02699052.2014.920524 * Contributed equally
Gosseries, O., Bodart, O., Massimini, M., 2015. Transcranial magnetic stimulation and electroencephalography, in: Rossetti, A., Laureys, S. (Eds.), Clinical Neurophysiology in Disorders of Consciousness: Brain Function Monitoring in the ICU and Beyond. Springer-Verlag Wien, doi:10.1007/978-3-7091-1634-0_10
The studies conducted for this thesis were performed on the same equipment, using the same set up, and similar processing steps.
1. Acquisitions
EEG is recorded using a 60 channel EEG cap, whose size (small, medium, or large) is adapted to the participant’s head. Electrodes are organized according to the 10-20 international positioning system. Reference and ground are located on the forehead, one centimetre apart. Two more channels are used to record the electrooculogram, by positioning one electrode on the upper external side of the left eye and one on the lower external side of the right eye. The electrodes are made of carbon, shaped as open ring, with a low profile, to further decrease TMS induced artefacts. The subject’s skin is prepared by first removing the hair inside the electrode with a cotton tip, then scrubbing the scalp with a bit of abrasive gel (Nuprep®, Weaver and Company, Aurora, Colorado, USA), and finally filling the electrode with conductive gel (ECI Electro-Gel™, Electro-Cap International, Eaton, Ohio, USA). This allows the impedances to stay below 5 kΩ. The amplifier provides a colour coded impedance check, but whose relation with actual impedance value is not available (electrodes are shown in green when below 5 kΩ, and black when disconnected, but also in yellow and red when impedances values are greater than 5 kΩ). EEG is recorded using an Eximia sample-and-hold amplifier gating the TMS artefact 100µs prior and 2ms after the stimulus (Nexstim Plc., Helsinki, Finland). The signal is then sampled at 1450Hz and band pass filtered between 0.1 and 350Hz.
Stimulations are performed using an air-cooled figure-of-eight coil (inner diameter 50mm, outer diameter 70 mm, focal area of stimulation 0.68 cm2) driven by a mobile TMS unit (Nexstim Plc, Helsinki, Finland). The biphasic pulses last 280µs and reach an intensity of 1 to 2 T (maximum electric field 20 mm below the coil 199V/m), and are performed automatically with an
interstimulus interval jittering randomly between 2000ms and 2300ms. The coil charging is delayed outside of the recording interval (after 1000ms). The intensity of stimulation is set as a percentage of the maximum output, and adapted to reach an estimated evoked electric field of 120V/m at the cortical level. This estimation is provided by the neuronavigation system based on a spherical head model. This intensity can be adapted according to artefacts or signal-to-noise ratio, reaching up to 150V/m, hence an intensity well above threshold for an EEG response (50V/m).
To ensure reproducibility, the recordings are performed with neuronavigation (Eximia NBS, Nexstim Plc, Helsinki, Finland). This system uses an infrared camera tracking reflective sensors on goggles and the coil, and the subject’s 3D T1 MRI on which landmarks were selected (nasion and both tragi) and co-registrated in real life. Using a software-aiming device, this allows the stimulator to prevent any pulse going from the coil if the latter is not exactly in the same position as the repeated stimulus (location, distance to scalp, rotation and angle) with an error less than 2mm. Similarly, this allows to precisely locate the stimulation targets, on the participant’s own brain. We aim to stimulate the medial part of the left or right superior parietal lobule (BA7) and the medial part of the right or left superior frontal gyrus (BA6), while avoiding obvious structural lesions. The exact stimulation site can vary slightly if the original target cannot be stimulated without major artefacts. Each target is stimulated between 200 and 400 times. All the stimulation sites, the MRI landmarks and the electrodes locations are registered at the end of the experiment.
To avoid the recording of auditory evoked potentials, as the TMS pulses are quite loud, subjects are listening to a constant white noise through inserted earphones. Healthy subjects are asked to report if they can still hear the TMS pulse and the white noise volume is adapted accordingly. In non-communicating patients, the volume is set at a fixed value such that the experimenters can hear
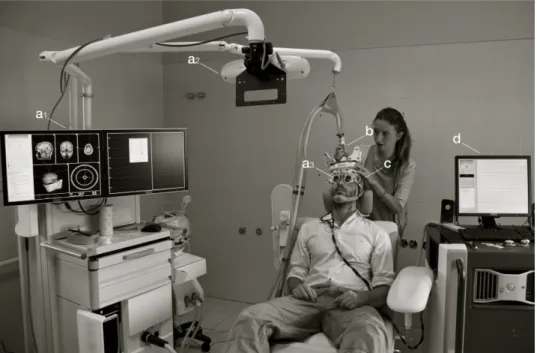
the noise. To prevent bone conduction of the TMS “click”, a light layer of foam is placed between the coil and the EEG cap. All the subjects are installed as comfortable as possible, either in their bed or on a chair, and keep their eyes open during the recordings. If necessary, an arousal protocol is performed on patients with DOC (27). Figure 4 illustrates our TMS–EEG setup, with a neuronavigation and targeting system.
Figure 4 – Our TMS–EEG setup
Example of our setup, combining a neuronavigation system (a) , the stimulation coil with tracking elements (b), a compatible high-density EEG net (c) and a compatible EEG amplifier (d). The neuronavigation system is composed of 3D brain reconstruction (a1), an infrared tracking camera (a2) and tracking googles (a3). Adapted from Napolitani, M.*, Bodart, O.*, Canali, P., Seregni, F., Rosanova, M., Laureys, S., Massimini, M., Gosseries, O., 2014. Transcranial magnetic stimulation combined with high density EEG in altered state of consciousness. Brain Inj. 28, 1180–1189. doi:10.3109/02699052.2014.920524 (* contributed equally).
2. Initial data processing
Data were initially processed in Matlab R2007b (Matworks, Natick, MA), using SSP 2.0e (scripts provided by Casali et al.). First, all the artefacted trials (electrode movement, eye movement, overwhelming muscle activity) were visually identified and discarded. At least 150 good trials per session were kept for further analysis. Isoelectric channels, or channels with constant or major artefacted activity were also visually selected and discarded. No more than 10 channels were removed. EEG was then band-pass filtered at 0.1-45Hz, down sampled at 362.5Hz, and split using a -800 +800ms window around the TMS pulse. The EEG activity was then averaged to get the TEP, and the signal baseline was corrected according to the EEG activity from -400 -100ms. Additional artefacted channels could be identified and discarded at this stage. ICA was sometimes used to remove further artefacts, such as 50Hz line noise, muscle activity, blinks, or TMS pulse. The EEG signal up to 400ms after the TMS pulse was then analysed using D30 (version October 2014), another script provided by Casali et al. The EEG sources were computed using weighted minimal norm constraint to solve the inverse solution, and a 3-spheres BERG model of head volume conductance. Significant source activation was assessed using non-parametric bootstrap statistic (486 bootstraps, distribution size 70000, significant level α = 0.01). Then a matrix of the spatial distribution of these significant sources against time was computed. This matrix was then compressed using Lempel-Ziv algorithm. The resulting value was normalized by the source entropy of the initial matrix to obtain the PCI. When the TMS could not elicit a sufficient EEG response (entropy <0.08 or signal to noise ratio <1.4), the PCI was set to 0, reflecting the fact that the stimulation could not significantly engage a neuronal activity.
Chapter III
TMS–EEG and neuroimaging
Section based upon the following publications:
Bodart, O., Gosseries, O., Wannez, S., Thibaut, A., Annen, J., Boly, M.,
Rosanova, M., Casali, A.G., Casarotto, S., Tononi, G., Massimini, M., Laureys, S., 2017. Measures of metabolism and complexity in the brain of patients with disorders of consciousness. NeuroImage Clin. 14, 354–362. doi:10.1016/j.nicl.2017.02.002
Bodart, O., Amico E., Gomez F., Casali A.G., Wannez S., Heine L., Thibaut A.,
Annen J., Boly M., Casarotto S., Rosanova M., Massimini M., Laureys S., Gosseries O., Global structural and effective connectivity in patients with disorders of consciousness. Under revision.
FDG-PET
33
1. TMS–EEG and FDG-PET
1.1. Combining TMS–EEG and FDG-PET
As we have seen, several questions remain open while dealing with DOC, to which TMS–EEG could contribute to answer. Given the need for an accurate diagnostic tool usable at the patient bedside, and given the apparent ability of the PCI to discriminate between UWS and MCS patients, further validation and cross-validation of TMS–EEG is required. FDG-PET is a validated neuroimaging method, contributing to establish correct diagnosis (71,72). TMS– EEG and FDG-PET are not redundant, as the first evaluates dynamically the brain’s ability to sustain complex interactions, while the second assesses the brain’s residual metabolism at rest, especially in the fronto-parietal network. In the present study, the first objective is thus to cross-validate TMS–EEG and FDG-PET, against the behavioural gold standard, the CRS-R.
Several neuroimaging techniques have unveiled UWS patients with abnormally good results, results usually observed in subjects with – at least minimal – consciousness. However, none of these patients were assessed using multiple imaging methods, to validate that the results were the sign not of a lack of specificity, but rather of covert consciousness in this subpopulation. Hence, identifying signs of covert consciousness using both TMS–EEG and FDG-PET is the second objective of this study.
1.2. Methodology
In order to meet our cross-validation objective, we performed FDG-PET then TMS–EEG five days apart in a population of 24 adult patients (13 male, 12 TBI, time since injury 52.5 weeks (5-1371), age 35 ±12 years). To limit the impact of spontaneous recovery, patients were included at least five weeks after the brain injury. However, we wanted to reflect the diversity of time since-onset observed in the clinical setting, and thus did not set an upper limit for the time since injury. FDG–PET was acquired and analysed as in (71,153,154). Briefly, after being kept awake in a quiet dark room for at least 10 minutes, patients received 150 to 300MBq of 18FDG. They were then kept awake in the same quiet dark room for fixation for 30 minutes, before being scanned for 12 minutes on a Philips Gemini TF PET-CT scanner. At this stage, some patients required light sedation to avoid movement that could have prevented the acquisitions. This could not have influenced the results, as it took place after the radiotracer had been fixed in the brain by glucose uptake at wakeful rest. Patterns of preserved or globally decreased metabolism were visually identified by experts of our team on statistical maps computed by SPM8 (www.fil.ion.ucl.ac.uk/spm), using a contrast consisting of 39 age-matched healthy controls (significance threshold of p< .05 uncorrected in all contrast for single subject analyses). More precisely, when the statistical tool did not detect a single voxel of preserved metabolism in the whole associative fronto-parietal network bilaterally, the pattern was set as compatible with unconsciousness; when at least some significantly preserved metabolic activity could be detected in the fronto-parietal network, the pattern was considered as compatible with consciousness. TMS–EEG acquisition protocol is described in detail in chapter II, and is similar to the one used in (148,151,155). One year after the study, the subjects’ outcome was assessed using the Glasgow outcome scale extended (156). The behavioural diagnosis was reported as obtained by the best CRS-R, while FDG-PET and TMS–EEG