HAL Id: hal-01407674
https://hal.archives-ouvertes.fr/hal-01407674
Submitted on 23 Feb 2018
HAL is a multi-disciplinary open access
archive for the deposit and dissemination of
sci-entific research documents, whether they are
pub-lished or not. The documents may come from
L’archive ouverte pluridisciplinaire HAL, est
destinée au dépôt et à la diffusion de documents
scientifiques de niveau recherche, publiés ou non,
émanant des établissements d’enseignement et de
Reduction of EMI using Anticontrol of Chaos
Marcelle Merhy, Cristina Morel, Eric Chauveau, Mohamed Machmoum
To cite this version:
Marcelle Merhy, Cristina Morel, Eric Chauveau, Mohamed Machmoum. Reduction of EMI using
Anticontrol of Chaos. 10th International Conference on Environment and Electrical Engineering,
EEEIC.EU 2011 , May 2011, Rome, Italy. �10.1109/EEEIC.2011.5874793�. �hal-01407674�
Reduction of EMI using anticontrol of chaos
Marcelle Merhy, Cristina Morel, Eric Chauveau
Département Automatismes et informatique inclus ESEO, Grande Ecole d’Ingénieurs Généralistes
4 rue Merlet de la Boulaye BP 30926, 49009 Angers Cedex 01-France
Mohamed Machmoum
Département Génie Electrique
IREENA, Institut de recherche en Electronique et Electrotechnique de Nantes Atlantique
37 Boulevard de l’université BP 406, 44602 Saint-Nazaire France
Abstract— DC-DC converters are employed in various electrical
devices, thus forming main sources of electromagnetic interference (EMI). By making the DC-DC converter operating in chaos, using a new nonlinear feedback controller, the simulation results illustrate that a reduction of spectral peak and consequent spreading of the spectrum can be shown. This simple strategy not only improves the electromagnetic compatibility of the converter, but also reduces the output voltage ripple. A Power System Blockset (PSB) model using Simulink/Matlab is designed and results are compared to those obtained with the classical anticontrol method.
Keywords-Buck converter; electromagnetic interference (EMI); electromagnetic compatibility (EMC); chaos; anticontrol; PSB Simulink/Matlab.
I. INTRODUCTION
Switched mode DC-DC converters are the most popular power supply in industrial products. However, it was found to have large electromagnetic interference (EMI) due to the rapid switching of high currents and voltages, generally consisting of the switching frequency and many harmonics. This EMI give rise to important electromagnetic compatibility (EMC) problems. Nowadays, switched mode power supplies have to be designed not only to provide the required electrical functions, but also to meet international EMC standards.
Traditionally, the principal method in power converter EMI suppressing has been passive noise filtering for conducted EMI and metal shielding for radiated EMI [1]. Another approach that modulates the switching frequency has been proposed to reduce the spectral emissions [2][3]. Besides increasing the size, weight, a more important problem is a large extra waste of money in manufacturing cost. Such a design is not portable across different EMC norms because each time application domain changes, filters have to be redesigned and manufactured for each application even if the converter specifications themselves are unchanged.
Recently, the study and its possible application of chaos, a nonlinear phenomenon which may occur naturally in switch-mode power supplies when some of the system parameter get changed, have been an active subject. Most power electronic engineers try to avoid this mode of operation by choosing such component values that will give periodic ripples in the voltage and current waveforms. The work of Hamill and Deane [4]
argued against such practice and proved that chaos might be used to improve EMC switch-mode power supplies without any additional circuitry. Thus, the periodicity of the converter voltages and currents is disrupted so that the energy of the interfering signal that was originally concentrated at the harmonic frequency is spread over a large bandwidth with a consequent reduction of the peak value in the power density spectrum of the interfering signals emitted by the system. However, [5] reported some inherent problems of chaotic operation like increased ripple and higher emissions floor.
The task of making a nonchaotic dynamical system known as "chaotication" (or sometimes, "anticontrol"), has attracted more and more attention from the engineering and physics communities in recent years due its great potential in nontraditional applications for physical, electrical, optical, mechanical, chemical, biological, and medical systems[6][7].
The anticontrol method designs a nonlinear feedback controller with an arbitrarily small amplitude [8][9][10], thus obtaining chaotic dynamics in the controlled system. The application of this method [8][10] to switch-mode power supplies reduces the output voltage spectral emissions, but aggravates the overall magnitude of the ripple [11]. The work of [11] introduces a nonlinear feedback controller that maintains a small ripple in the output and also achieves a low spectral emission. A new nonlinear feedback controller is introduced in [12], much simpler that in [11], and with better performance. The initial nonlinear system is chaotified using a simple sine function of the system state, as in [10], but with large amplitude.
Although the earlier measurements have been done at low frequency (2.5 kHz), the results should scale to higher frequency for practical power supplies. Also, only numeric analysis method is used to simulate the results.
In this paper, a Power System Blockset (PSB) model using Simulink/Matlab is designed for a DC-DC buck converter choosing a higher frequency value (50 kHz) and using the new method proposed in [12], which includes a comparison with the classical anticontrol method. Results illustrate that this method can improve the converter in time domain (ripple) and frequency domain (spectrum).
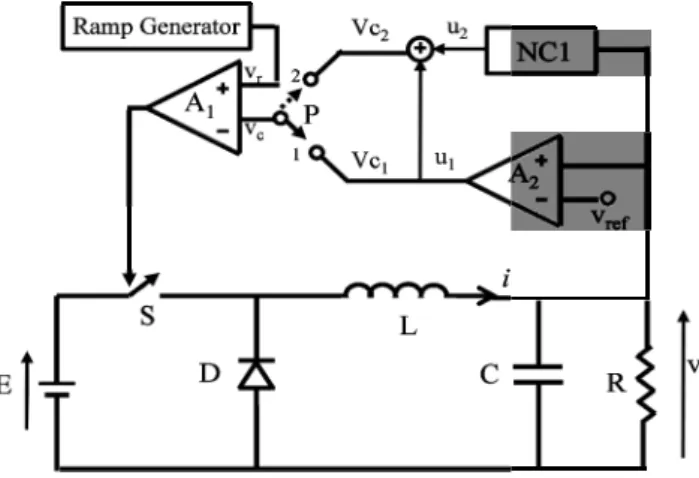
II. OPERATION OF THE VOLTAGE-BUCK CONVERTER
Figure 1. DC-DC Buck converter with feedbac The buck converter consists of a sw controlled by a pulse-width modulated sign required output. The block diagram of voltag converter is shown in fig. 1 and the conver operate in continuous conduction mode inductor current never falls to zero. The circ states, according to the position of the swi closed, the input voltage E provides energy well as to the inductor L. When S is open, th i, which flows through diode D, transfers s energy to the load R. The amplifier A2 h
simplest feedback converter is obtained whe the first position. The difference between t v(t) and the reference voltage Vref is amp
resultant control voltage vc(t) is
vc t =vc1 t =u1 t =a(v t -V
This voltage is applied to the inverti comparator A1 and then compared with the ra
by
vr t = VL+(VU-VL) tmodT
T
Where VL and VU are respectively the
voltages of the ramp and T is period. When vc(t) ≥ vr(t), the switch S is op
conducts ; Otherwise S is closed and D converter is governed by two sets of l equations that correspond to the on and controlled switch written as:
S Closed when vc(t) ≥ vr(t) : dv dt= 1 Ci t -1 RCv(t) di dt= -1 Lv t + E L -CONTROLLED ck anticontrol. witch S which is
nal to achieve the ge controlled Buck rter is assumed to (CCM), so the uit has two switch itch S. When S is y to the load R as he inductor current some of its stored has a gain a. The en the switch P in the output voltage plified so that the
Vref) (1)
ing input of the amp voltage given
(2)
e lower and upper
pen and diode D is blocked. The linear differential off states of the
(3) S Open when vc(t) vr(t) : dv dt= 1 Ci t di dt =-Where E is a constant in through the capacitor and i is th
III. GENER By using a state feedback c the converter works on int feedback control in [8] and [9] of the system state. This antico of an additional nonlinear fee switch P of fig. 1 in position 2 to switch-mode power suppl voltage v(t). Work [12] pres expressed as:
vc(t) = vc2(
Where
u2 t = c2 sin
In order to illustrate the eff model is designed in fig. 2 w mH, C= 22 µF, R= 22 Ω, a=8. =8.4 V, T=20 µs, E= 220V.
Figure. 2 Scheme of the PSB Model anticontrol.
When the coefficient c2 of t
converter can display complex
d g m 1 2 S >= E D t - 1 RCv(t) (4) 1 Lv t
nput voltage, v is the voltage he current in the inductor.
RATING CHAOS
control with a small magnitude, termittent chaos [8][10]. The ] is a simple sinusoidal function ontrol method considers the use edback controller NC1, ie, with
. The application of this method lies leads to a chaotic output
sents a new control law that
(t) = u1(t)+ u2(t) (5)
n[w2(v(t) -Vref)] (6)
fficiency of this method, a PSB with the following values: L= 4 .4, Vref =150 V, VL = 3.8 V, VU
l of the buck converter with feedback
the disturbing signal varies, the nonlinear phenomena. Vref v + -t R L w2 c2 a sin(u[1]) C
While the coefficient c2 is 0, thus the converter is governed
by the control law vc1(t) of (1), the converter works on usual
PWM mode.
Fig. 3 illustrates the output voltage of the converter on periodic state with a 27 mV ripple. The spectrum of the output voltage v(t) is shown in fig. 4, the energy concentrate on switching frequency and its harmonics, the peak values are relatively high and the EMC rulers are not easy to meet. So, let us try to reduce the peak value of the spectrum while maintaining a small ripple.
Figure. 3 Periodic output voltage v(t) of the buck converter with the law control vc1(t) of (1) (27 mV ripple).
Figure. 4 Power spectrum of the output voltage v(t) with the law control vc1(t)
of (1).
Fig. 5 and fig. 6 show the chaotic output voltage v(t) and the power spectrum respectively when the converter is governed by the control law vc2(t) of (5) obtained with c2=8
and w2=300 rad/V.
Compared the spectrum of periodic state with that chaotic state, the spectrum of chaotic state spreads to wider range, the peak at the switching frequency 1/T (or at its harmonics) is drastically reduced. Average reduction at the switching frequency and its harmonics is at least 35 dB. The small amplitude of the parameters c2 as in [8] leads to the conclusion
that, unfortunately, the time domain performance is worsened because the output voltage ripple has increased (380 mV
ripple), thus reducing the efficiency of the DC-DC converter.
Figure. 5 Output voltage v(t) obtained with the law control vc2(t) of (5), and
with the parameters c2= 8 and w2=300rad/V (380 mV ripple).
Figure. 6 Power spectrum of the output voltage v(t) with the law control vc2(t)
of (5) (c2= 8 and w2=300 rad/V).
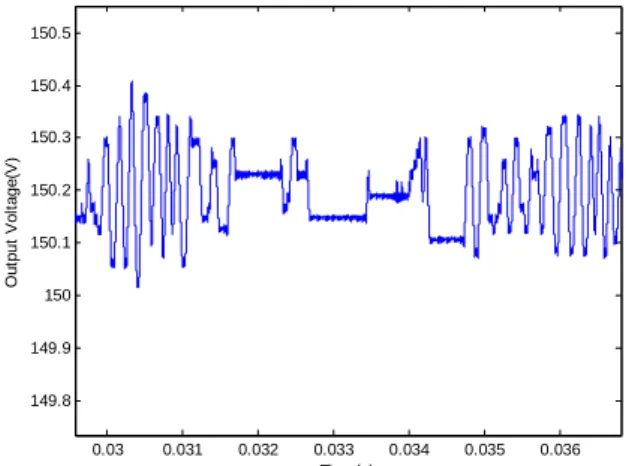
Now, we are interested in a large variation of the parameter c2 until fig. 7 showing a ripple is 11 mV ripples. In this case,
vc2(t) presents a better spectrum in fig.8, while ripple of
performance and time v(t) is maintained low.
Figure. 7 Output voltage v(t) obtained with the law control vc2(t) of (5), and
with the parameters c2= 160 and w2=50 rad/V (11 mV ripple).
0.0315 0.0316 0.0316 0.0317 0.0317 150.59 150.595 150.6 150.605 150.61 150.615 150.62 150.625 150.63 150.635 Time(s) O u tp u t V o lt age (V ) 0 0.5 1 1.5 2 2.5 3 3.5 4 4.5 5 x 10⁵ -160 -150 -140 -130 -120 -110 -100 -90 -80 -70 Frequency(Hz) P o w e r S p ec tr u m of t h e ou tp ut v o lt a ge(d B /H z ) 0.03 0.031 0.032 0.033 0.034 0.035 0.036 149.8 149.9 150 150.1 150.2 150.3 150.4 150.5 Time(s) O u tp u t V o lt ag e(V ) 0 0.5 1 1.5 2 2.5 3 3.5 4 4.5 5 x 10⁵ -140 -130 -120 -110 -100 -90 -80 -70 -60 -50 Frequency(Hz) P o w e r S pec tr um o f t he o u tp u t v o lt ag e(dB /H z ) 0.0314 0.0314 0.0315 0.0316 0.0316 0.0316 0.0317 0.0318 139.86 139.865 139.87 139.875 139.88 139.885 Time(s) O u tp u t V o lta g e (V )
Figure. 8 Power spectrum of the output voltage v(t) with the law control vc2(t)
of (5) (c2=160 and w2=50 rad/V).
Fig. 9 presents the output voltage ripple in function of the anticontrol parameters c2 and w2. This ripple falls to very small
values for a wide domain of low w2 angular frequencies and for
high c2 amplitudes. For a better visualization of the small ripple
domain, we project 3D space of coordinates (c2,w2) and ripple
on 2D as represented in fig. 10.The low ripple area (the black area on the right) can then be identified. Every point (c2, w2)
inside of this area is characterized by a small output voltage ripple dependent of the initial conditions (using vc2 (t) with
large amplitude of c2. Fig. 10 presents on gray area: every point
(c2, w2) inside of this area is characterized by an important
output voltage ripple.
Figure. 9 Output voltage ripple in function of c2 and w2.
IV. CONCLUSION
In this paper, we apply a new nonlinear feedback controller to a DC/DC buck converter in order to demonstrate that chaos improves power supplies EMC without using EMI filters. On the other hand, this controller maintains a small ripple in the output if we choose a suitable coefficient (large amplitude of c2).
Figure. 10 Plane projection 2D of the 3D space of coordinates (c2,w2) and
ripple.
Using Simulink, the simulation results demonstrate that a reduction of spectral peak and consequent spreading of the spectrum can be shown. The output ripple voltage is also decreased.
REFERENCES
[1] M. H. Chew, “Handling EMI in Switching Mode Power Supply Design, ”Application Note No: N1695D, On Semiconductor (http:/onsemi.com). [2] F. L. Lin and D. Y. Chen, “Reduction of Power Supply EMI Emission by switching Frequency Modulation, ” IEEE Transactions on Power Electronics, Trans. Power Electron, vol. 9, pp. 132-137, January 1994. [3] A. M. Stankovic, G. C. Verghese and D. J. Perreault, “Analysis and
Synthesis of Randomized Modulation Schemes for Power Converters, ”IEEE Trans. on Power Electron., vol. 10, pp. 680-693, July 1999. [4] J. H. B. Deane, P. Ashwin, D. C. Hamill and D. J. Jefferies, “Calculation
of the Periodic Spectral components in a chaotic DC-Dc Converter,” IEEE Trans. Circuits and sys. I, vol. 46, pp. 1313–1319, November 1999.
[5] S. Banerjee, A.L. Baranovski, J. L. R. Marrero, and O. Woywode, “Minimizing electromagnetic interference problems with chaos, ” IEICE trans. on fundamentals, E87-A(8):2100, August 2004.
[6] V.In, S. E. Mann, W. L. Spano, “Experimental Maintainance of Chaos, ” Physical Rewiew Letters, vol.74, pp. 1129-1142, 1995.
[7] H. Cao, X. Chi and G. Chen, “Suppressing or Inducing Chaos, ” Physical Review Letters, pp. 4420-4423, 2003.
[8] X. F. Wang and G. Chen, “Chaotifying a stable map via smooth small-amplitude high-frequency feedback control, ” Int. J. Circuit Theor. Appl., vol. 28, pp. 305–312, June 2000.
[9] X. F. Wang, G. Chen and K. F. Man, “Making a continuous-time minimum-phase system chaotic by using time-delay feedback, ” IEEE Trans. Circuits Syst. I: Fund.Theor. Appl., vol. 48, pp. 641–645, August 2002.
[10] G. Chen and D. Lai, “Making a dynamical system chaotic: Feedback control of Lyapunov exponents for discrete-time dynamical systems, ” IEEE Trans. Circuits Syst. I: Fund. Theor. Appl.,vol 44 , pp. 250–253, 1997.
[11] C. Morel, M. Bourcerie, F. Chapeau –Blondeau, “Improvement of power supply electromagnetic compatibility by extension of chaos anticontrol; ” Journal of Circuits, Systems, and Computers; vol.14, pp. 757-770, August 2005.
[12] C. Morel, R. Vlad, J. Y. Morel, “Anticontrol of Chaos Reduces Spectral Emissions, ” Journal of Computational and Nonlinear Dynamics, vol. 3, pp. 1555-142, october 2008. 0 0.5 1 1.5 2 2.5 3 3.5 4 4.5 5 x 10⁵ -170 -160 -150 -140 -130 -120 -110 -100 -90 Frequency(Hz) P o w er S pec tr um o f t he o ut pu t v o lt ag e(dB /H z ) 0 100 200 50 60 70 80 90 0 1 2 3
Angular frequency w2 (rad/V) Amplitude c2 (V) O ut pu t v ol tag e r ip pl e (V )