heterogeneous clay formation locally disturbed
by excavation
M. Huysmans1, A. Berckmans2 and A. Dassargues1,3
1Hydrogeology & Engineering Geology Group, Department of Geology-Geograpy, Katholieke Universiteit Leuven, Belgium; marijke.huysmans@geo.kuleuven.ac.be
2ONDRAF/NIRAS, Brussel, Belgium
3Hydrogeology, Department of Georesources, Geotechnologies and Building Materials, Université de Liège, Belgium
1 Introduction
The safe disposal of nuclear waste is an important environmental challenge. Several countries are investigating deep geological disposal as a long-term solution for high-level waste. The Belgian nuclear repository program, conducted by ONDRAF/NIRAS (Belgian agency for radioactive waste and enriched fissile materials), is in the process of characterizing the host rock capacities of the Boom Clay. This is a marine sediment of Tertiary age (Rupelian) (Wouters and Vandenberghe 1994). The research activities are concentrated at SCK●CEN (Belgian Nuclear Research Centre) located on the nuclear zone of Mol/Dessel (province of Antwerp) where an underground experimental facility (HADES-URF) was built in the Boom Clay at 225 m depth. In this area, the Boom Clay has a thickness of about 100 m and is overlain by approximately 180 m of water bearing sand formations.
The isolation of waste from the biosphere is obtained by means of a multi-barrier concept, composed of engineered and natural multi-barriers. In this study, the radionuclide migration through the most important natural barrier, the Boom Clay, is investigated. The average hydraulic conductivity value of this formation is very low (K=2.10-12 m/s), but the clay is not completely homogeneous. It contains alternating horizontal sublayers of silt and clay with an average thickness of 0.50 m and a large lateral continuity (Vandenberghe et al. 1997). Furthermore, the clay exhibits excavation-induced fractures around the excavated galleries (Dehandschutter et al. 2002). The sublayers have hydraulic conductivity values up to 10-10 m/s (Wemaere et al. 2002) and the fractures may have even higher hydraulic conductivity values. Therefore, the aim of this study is to model the transport of radionuclides through the clay, taking into account the geological
heterogeneity and the excavation induced fractures around the galleries in which the waste will be stored.
2 Method
2.1 Data analysis
In order to analyze and simulate the heterogeneous hydraulic conductivity, measurements of the hydraulic conductivity and several secondary variables were collected. All measurements were carried out in the Mol-1 borehole (Wemaere et al. 2002). The resulting data set comprises of 52 hydraulic conductivity values, 71 grain size measurements, an electrical resistivity log, a gamma ray log and a description of the lithology variation. Hydraulic conductivity and grain size were measured in the laboratory on cores of 3 to 10 cm and 10 to 20 cm respectively. Borehole resistivity and gamma ray logging was performed with a vertical spacing of 15 cm. The lithology description was derived from a Fullbore Formation MicroImager log with a vertical resolution of 5 cm. The scales of all different measurements are of the same order of magnitude.
All secondary measurements show a clear correlation with hydraulic conductivity (Table 1). Electrical resistivity and hydraulic conductivity have a correlation coefficient of 0.73. Gamma ray, on the other hand, shows a negative and smaller correlation with hydraulic conductivity (R=-0.65). This lower correlation is probably caused by the presence of organic matter and glauconite in the Boom Clay, which both affect the gamma ray measurements. Grain size is observed to be well correlated with hydraulic conductivity. The correlation coefficient between d40 (i.e., the grain size for which 40% of the total sample has a
smaller grain size) and hydraulic conductivity is 0.95. The lithostratigraphic column, determined on the basis of a Formation Micro Imager (FMI) log (Mertens and Wouters 2003), also shows a relationship with hydraulic conductivity: the mean log hydraulic conductivity of the clay layers (-11.7) is smaller than the mean log hydraulic conductivity of the silt layers (-11.3). All secondary parameters are thus well correlated with hydraulic conductivity and were therefore incorporated in the simulation of hydraulic conductivity.
Table 1. Correlation coefficients between hydraulic conductivity and secondary parameters
Secondary parameter Correlation coefficient with hydraulic conductivity
Electrical resistivity 0.73
Gamma ray -0.65
Grain size (d40) 0.95
In previous work (Vandenberghe et al. 1997), the Boom Clay formation was divided into three zones. This subdivision was confirmed by the statistical analysis. The deepest zone (Belsele-Waas Member: 278m – 292.4m) shows a
large variability of hydraulic conductivity and the secondary variables, the middle zone (Putte and Terhagen Member: 216m – 278m) shows a small variability and the upper zone (Boeretang Member: 190.4m – 216m) shows an intermediate variability. Variograms and cross-variograms of all primary and secondary variables were calculated and modeled for the three separate zones. Table 1 shows the fitted log K variograms of the three zones of the Boom Clay formation.
Table 2. Fitted log K variograms of the three zones of the Boom Clay formation
Model Nugget Range Sill
Boeretang Member Spherical 0.035 4.6 m 0.03 Putte and Terhagen Member Spherical 0.003 4.8 m 0.0056 Belsele-Waas Spherical 0.23 5.5 m 0.38
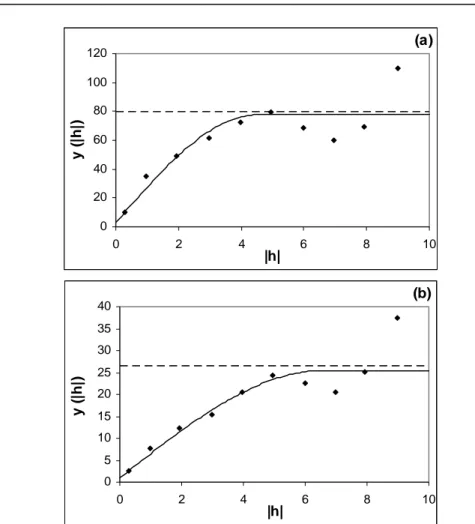
Figure 1 shows two examples of experimental and fitted variograms and cross-variograms: the variogram of gamma ray of the Belsele-Waas Member and the cross-variogram of gamma ray and resitivity of the Belsele-Waas Member.
2.2 Simulation of hydraulic conductivity
Detailed input fields reflecting the heterogeneity of hydraulic conductivity were simulated. These hydraulic conductivity fields serve as input for the hydrogeological model. Since the Boom Clay shows a large lateral continuity (Wouters and Vandenberghe 1994) and since the hydrogeological model is a local scale model, it could be assumed that the properties of the Boom Clay do not change considerably in the horizontal direction. Therefore, one-dimensional vertical simulations of the hydraulic conductivity were calculated.
These fields were generated using geostatistical sequential simulation which allows to take spatial variability and secondary data into account. The simulation algorithm is iterative and contains the following steps:
1. The location to be simulated is randomly chosen. The spacing between the locations to be simulated was 0.2 m, which is of the same order of magnitude as the measurement scale of the different variables.
2. The simple co-kriging estimate and variance are calculated using the original primary and secondary data and all previously simulated values using COKB3D (Deutsch and Journel 1998).
3. The shape of the local distribution is determined in such a way that the original histogram of hydraulic conductivity is reproduced by the simulation. This is achieved by the following approach. Before the start of the simulation, a look-up table is constructed by generating non-standard Gaussian distributions by choosing regularly spaced mean values (approximately from -3.5 to 3.5) and variance values (approximately from 0 to 2).
(a) 0 20 40 60 80 100 120 0 2 4 6 8 10 |h| y ( |h |) (b) 0 5 10 15 20 25 30 35 40 0 2 4 6 8 10 |h| y (| h |)
Fig. 1. Experimental and fitted a) variogram of gamma ray of the Belsele-Waas Member in
the vertical direction and b) cross-variogram of gamma ray and resistivity of the Belsele-Waas Member in the vertical direction
The distribution of uncertainty in the data space can then be determined from back transformations of these non-standard univariate Gaussian distributions by back transformation of L regularly spaced quantiles, pl, l=1,...,L:
( )
(
)
1 1 * , 1,..., K Kl =F−⎡
G G− pl σy+y⎤
l = L⎣
⎦
(1)where FK(K) is the cumulative distribution function from the original K variable,
G(y) is the standard normal cumulative distribution function, y* and σ
y are the
mean and standard deviation of the non-standard Gaussian distribution and the pl,
l=1,...,L are uniformly distributed values between 0 and 1. From this look-up table the closest K-conditional distribution is retrieved by searching for the one with the closest mean and variance to the co-kriging values (Oz et al. 2003).
4. A value is drawn from the K-conditional distribution by Monte-Carlo simulation and assigned to the location to be simulated.
This approach creates realizations that reproduce (1) the local point and block data in the original data units, (2) the mean, variance and variogram of the variable and (3) the histogram of the variable (Oz et al. 2003). Figure 2 shows one realization of the hydraulic conductivity of the Boom Clay.
-295 -275 -255 -235 -215 -195 -13 -12 -11 -10 -9 log K [m /s] de p th [m ]
Fig. 2. Simulation of the vertical hydraulic conductivity of the Boom Clay
2.3 Simulation of fractures
Around the galleries in the Boom Clay, excavation-induced fractures are observed. About 90% of the discontinuities are approximately parallel planes that are part of a twofold conjugated fault set (Fig. 3). The excavation-induced fractures around the future disposal galleries were modeled as discrete fractures. Their properties (i.e., extent, aperture, spacing, dip and strike) are simulated using Monte Carlo simulation. Since these fractures will probably have similar properties to the
fractures observed in previously excavated galleries in the Boom Clay, the input probability distributions of the fracture properties were derived from measurements carried out during recent tunnel excavation in the Boom Clay (Dehandschutter et al. 2002; Dehandschutter 2002; Mertens et al. 2004).
Examination of a mounting chamber excavated in the Boom Clay revealed that the rock mass seemed to be damaged up to approximately 2 m, with a lot of small scale disturbances. The fractures were open and pyrite oxidation was present on the surfaces up to a depth of 2 m (Mertens et al. 2004). To account for potential variations in clay properties, tunnel design or excavation techniques, some variation of the extent of the fractured zone was allowed and the extent of the fractures was simulated as a random number between 1 m and 3 m.
Fig. 3. Schematical representation of a vertical cross section through the Connecting
Gallery showing the typical symmetrical form of the encountered shear planes (1. Tunneling maching; 2. Supported tunnel; 3. Induced shear planes)
Fracture apertures were examined using microtomography and scanning electron microscopy (Dehandschutter et al. 2004). Values of tens of micrometers were measured. The aperture could be as large as 1 mm at the tunnel walls and decreased rapidly as the distance to the excavation increased (Dehandschutter B. personal communication). Therefore, fracture aperture was simulated as a random number between 0 µm and 50 µm.
Faulting is very intense over most part of the excavation zone. The distance between subsequent fractures is generally less then 1 m. The average spacing is about 70 cm (Mertens et al. 2004). The fracture spacing was drawn from a distribution reflecting these observations, i.e., a normal distribution with a mean of 0.70 m and a standard deviation of 0.12 m.
Fracture dip angle varies between 30 and 80 degrees. 82 fracture dip measurements of shear faults were carried out (Dehandschutter 2002). The average fracture dip was 53° and the standard deviation was 11°. The fracture dip was therefore drawn from a normal distribution with a mean of 53° and a standard deviation of 11°.
Examination of the strike of discontinuities surrounding boreholes and larger excavations in the Boom Clay revealed that the strike of most discontinuities was perpendicular to the borehole or gallery axis (Dehandschutter 2002). The orientation of the fractures was fairly constant and all fractures were therefore assumed to have a strike perpendicular to the gallery axis.
The fracture geometry and properties were simulated by independent sampling from the proposed marginal distributions of fracture extent, aperture, spacing, dip and strike.
2.4 Hydrogeological model
A local 3D hydrogeological model of the Boom Clay, including the simulations of matrix hydraulic conductivity values and fractures, was constructed (Fig. 4). The model width in the x-direction is 20 m, i.e., half the distance between the disposal galleries. The model length in the y-direction is 15 m. This length was a compromise between including as many fractures as possible and keeping the computation time manageable. The model dimension in the z-direction is 102 m, i.e., the thickness of the Boom Clay in the nuclear zone of Mol-Dessel. The grid spacing is 1 m in the x-direction, approximately 0.17 m in the y-direction and between 0.2 m and 1 m in the z-direction. This fine grid was necessary to include the high resolution simulations of hydraulic conductivity and the geometry of the fractures. The vertical boundary conditions for groundwater flow are zero flux boundary conditions since the hydraulic gradient is vertical. The horizontal boundary conditions for groundwater flow are Dirichlet conditions. The specified head at the upper boundary is 2 m higher than the specified head at the lower boundary since the downward vertical hydraulic gradient is approximately 0.02 in the 100 m thick Boom Clay (Wemaere and Marivoet 1995). This gradient could vary in magnitude or even change direction over the long time period associated with radioactive waste disposal. In this study the gradient was however assumed to be constant. The boundary conditions for transport of the upper and lower boundaries are zero concentration boundary conditions (Mallants et al. 1999) since the hydraulic conductivity contrast between the clay and the aquifer is so large that solutes reaching the boundaries are assumed to be flushed away by advection in the aquifer.
The model was calculated for the radionuclide Se-79 since previous calculations revealed that this was one of the most important in terms of dose rates from a potential high-level waste repository for vitrified waste (Mallants et al. 1999). This radionuclide has a half-life of 65000 years, a solubility limit of 5.5e-8 mole/l, a diffusion coefficient of 2e-10 m²/s and a diffusion accessible porosity of 0.13. The transport processes that were taken into account in the model are advection, dispersion, molecular diffusion and radioactive decay.
The nuclear waste disposal galleries are assumed to be situated in the middle of the Boom Clay. This radionuclide source is modeled as a constant concentration source with a prescribed concentration equal to the solubility limit. The radionuclides slowly dissolve into the groundwater until all available
radionuclides are dissolved. The source term is thus a constant concentration equal to the solubility limit until exhaustion of the source.
The radionuclide migration in the clay and the fluxes through the clay boundaries into the surrounding aquifers were calculated with FRAC3DVS, a simulator for three-dimensional groundwater flow and solute transport in porous, discretely-fractured porous or dual-porosity formations (Therrien et al. 1996, Therrien et al. 2003). The fractures were modeled as discrete planes with a saturated hydraulic conductivity of (Bear 1972):
( ) ( )
22 12
Kf =ρg b µ (2)
where ρ is the fluid density (kg/m³), g is the acceleration due to gravity (m/s²), 2b is the fracture aperture (m) and µ is the fluid viscosity (kg/(ms)). The model was run with ten different simulations of hydraulic conductivity and fractures as input. The computation time of one run of the model with a PC with a 1.8 GHz CPU and 512 MB RAM was approximately 6 to 8 hours.
Fig. 4. Boundary conditions for (a) flow and (b) transport of 3D local
hydrogeological model.
3 Results and discussion
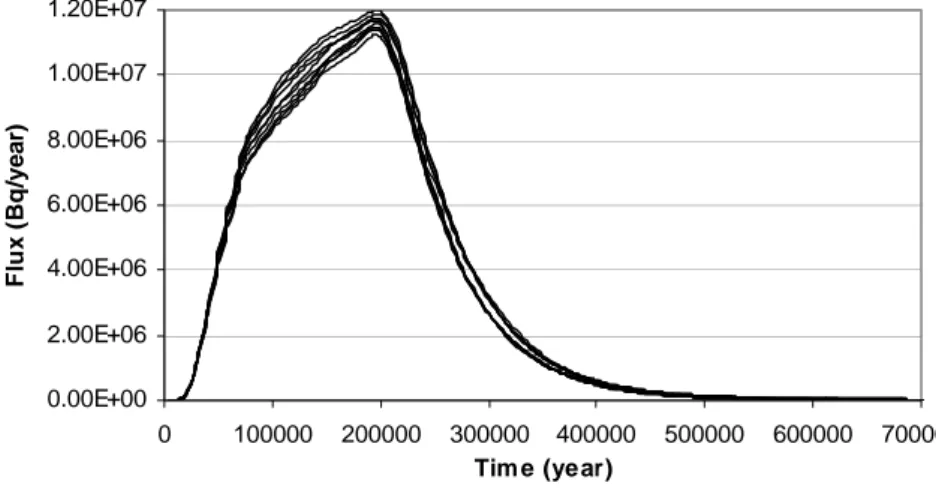
Fig. 5 and 6 show the total Se-79 fluxes through the lower and upper clay-aquifer interfaces for 10 different simulations. The fluxes through the clay-aquifer
interfaces gradually increase until they reach a maximum after approximately 200000 years and decrease slowly afterwards due to exhaustion of the source. The difference between the fluxes of the 10 different simulations is the largest in the time period from 100000 till 200000 years. The total amount of Se-79 leaving the clay was calculated as the flux integrated over time for each simulation. The total Se-79 masses leaving the clay vary between 2.200e+12 Bq and 2.438e+12 Bq through the lower clay-aquifer interface and between 2.045e+12 Bq and 2.252e+12 Bq through the upper clay-aquifer interface.
0.00E+00 2.00E+06 4.00E+06 6.00E+06 8.00E+06 1.00E+07 1.20E+07 0 100000 200000 300000 400000 500000 600000 700000 Tim e (year) Fl ux (B q/ y e a r)
Fig. 5. Total Se-79 flux (Bq/year) through the lower clay-aquifer interface
0.00E+00 2.00E+06 4.00E+06 6.00E+06 8.00E+06 1.00E+07 1.20E+07 0 100000 200000 300000 400000 500000 600000 700000 Tim e (year) Fl u x (B q/ y e a r)
Fig. 6. Total Se-79 flux (Bq/year) through the upper clay-aquifer interface
The range of total Se-79 masses leaving the clay is thus rather small. The difference between the largest and the smallest calculated mass is 10%. This result is important for the evaluation of the suitability of the Boom Clay Formation as a
host rock for vitrified nuclear waste storage. The total mass fluxes leaving the clay, taking excavation induced fractures and high-conductivity sublayers into account, are not very different from the mass fluxes calculated by a previous simple homogeneous model. This is probably caused by the relatively small importance of transport by advection compared to transport by diffusion in such media. Changes in the heterogeneity of hydraulic conductivity do not change the output fluxes significantly and do not affect its main safety function. This again shows that the Boom Clay is a very robust barrier.
4 Conclusions
In this study, the transport of radionuclides through a potential host formation for the disposal of vitrified nuclear waste was calculated, taking the geological heterogeneity and the excavation induced fractures into account. The calculated fluxes through the clay boundaries into the surrounding aquifers were very similar for all the different simulations. The difference between the largest and the smallest calculated mass leaving the clay was 10%. These results show that changes in the heterogeneity of hydraulic conductivity do not change the output fluxes significantly. The robust barrier function of the Boom Clay formation is thus confirmed by these results.
Acknowledgements
The authors wish to acknowledge the Fund for Scientific Research – Flanders for providing a Research Assistant scholarship to the first author. We also wish to thank ONDRAF/ NIRAS (Belgium agency for radioactive waste and enriched fissile materials) and SCK-CEN (Belgian Nuclear Research Centre) for providing the necessary data for this study. We also thank René Therrien and Rob McLaren for providing Frac3dvs and for their assistance.
References
Bear J., 1972, Dynamics of fluids in porous media, American Elsevier, New York, NY, 764 p.
Dehandschutter B., Sintubin M., Vandenberghe N., Vandycke S., Gaviglio P. and Wouters L., 2002, Fracture analysis in the Boom Clay (URF, Mol, Belgium), Aardk. Mededel., 12, 245-248
Dehandschutter B., 2002. Faulting and Fracturing during Connecting Gallery
tunnelling at the URL at Mol (SCK-CEN), ONDRAF/NIRAS unpublished internal report, 19 p.
Dehandschutter B., Vandycke S., Sintubin M., Vandenberghe N., Gaviglio P., Sizun J.-P. and Wouters L.,2004. Microfabric of fractured Boom Clay at depth: a case study of brittle-ductile transitional clay behaviour, Applied Clay Science, in press
Deutsch C.V. and Journel A.G., 1998, GSLIB geostatistical software library and user’s guide, Oxford University Press, New York
Mallants D., Sillen X. and Marivoet J., 1999, Geological disposal of conditioned high-level and long lived radioactive waste: Consequence analysis of the disposal of vitrified high-level waste in the case of the normal evolution scenario, Niras, Brussel R-3383, 82 p.
Mallants D., Marivoet J. and Sillen X., 2001, Performance assessment of vitrified high-level waste in a clay layer, Journal of Nuclear Materials, 298, 1-2, 125-135
Mertens, J. and Wouters, L., 2003, 3D Model of the Boom Clay around the HADES-URF, NIROND report 2003-02, 48 p.
Mertens J., Bastiaens W. and Dehandschutter B., 2004, Characterization of induced discontinuities in the Boom Clay around the underground excavations (URF, Mol, Belgium), Applied Clay Science, submitted
Oz, B., Deutsch, C. V., Tran, T. T. and Xie, Y., 2003, DSSIM-HR: A FORTRAN 90 program for direct sequential simulation with histogram reproduction: Computers & Geosciences, v. 29, no.1, p. 39-51.
Vandenberghe N., Van Echelpoel E., Laenen B. and Lagrou D., 1997, Cyclostratigraphy and climatic eustacy, example of the Rupelian stratotype, Earth & Planetary Sciences, Academie des Sciences, Paris, vol. 321, p 305-315
Wemaere I. and Marivoet J., 1995, Geological disposal of conditioned high-level and long lived radioactive waste: updated regional hydrogeological model for the Mol site (The north-eastern Belgium model) (R-3060), Niras, Brussel, 72 p.
Wemaere, I., Marivoet, J., Labat, S., Beaufays, R. and Maes, T., 2002, Mol-1 borehole (April-May 1997): Core manipulations and determination of hydraulic conductivities in the laboratory (R-3590), Niras, Brussel 56 p.
Wouters, L. and Vandenberghe, N., 1994, Geologie van de Kempen: een synthese: Niras, NIROND-94-11, Brussel, 208 p.
Therrien R. and Sudicky E.A., 1996, Three-dimensional analysis of variably-saturated flow and solute transport in discretely-fractured porous media, Journal of Contaminant Hydrology, 23, 1-2, p. 1-44.
Therrien R., Sudicky E.A. and McLaren R.G., 2003, FRAC3DVS: An efficient simulator for three-dimensional, saturated-unsaturated groundwater flow and density dependent, chain-decay solute transport in porous, discretely-fractured porous or dual-porosity formations, User’s guide, 146 p.