Original
article
Chronic exposure of
pigs
to
airborne dust
and
endotoxins
in
an
environmental chamber:
technical
note
B Urbain
JF Prouvost
D
Beerens
1O Michel
B Nicks
M
Ansay
P
Gustin
1
Laboratoire de
pharmacologie
etd’écotoxicologie
vétérinaires, faculté de médecine vétérinaire,université de
Liège,
bd de Colonster, 841;2Laboratoire
d’hygiène
et debioclimatologie,
faculté de médecine vétérinaire, université deLiège,
bd de Colonster, B43, B-4000
Liège;
3
Clinique d’allergologie
et des maladiesrespiratoires, hôpital
universitaire Saint-Pierre(ULB),
Brussels,
Belgium
(Received
20 November 1995;accepted
9May
1996)
Summary ―
A newexperimental
setup wasdeveloped
to exposepigs
to dust and airborne endotoxins in an environmental chamber, at levels liable to be encountered inpig
farmbuildings.
Thefollowing
parameters were evaluated in a chamber
containing
twopigs
of 10kg body-weight:
inhalable andrespirable
dustgravimetric
concentrations were measuredusing
areasamplers
andexpressed
asmg/m
3
.
Therespirable
dust concentration was also measuredusing
a ’TMdigital pP respirable
dust-measuring
instrument’, which has been shown togive
similar results to thegravimetric
method. The endo-toxin concentration was evaluatedusing
theLimulus-assay
andexpressed
asng/m
3
of aircontaining
the inhalable or
respirable
dust or asng/mg
of inhalable andrespirable
dust. Feed flour dust wasintroduced into the chamber to obtain different concentrations of inhalable and
respirable
dustranging
from 3.62 to 76.66
mg/m
3
and from 0.24 to 1.40mg/
M
3
,
respectively.
The endotoxin concentration was modulatedby mixing
the feed flour with Escherichia coli endotoxins beforeblowing
it into the chamber. The endotoxin concentrations in the aircontaining
inhalable orrespirable
dustranged
from 28.9 to270.0
ng/m
3
and from 2.22 to 36.38ng/m
3
,
respectively, depending
on the amount of endotoxins added to the dust. Data were also obtained in apiggery.
Theexperimental
setup detailed in this paper could be used tostudy
thesignificance
of air contaminants in thedevelopment
ofpig respiratory
dis-eases.airborne dust I endotoxin / environmental chamber / air
pollution
*
Résumé ―
Exposition chronique
de porcs à despoussières
et des endotoxinesaéroportées
dans une chambre d’inhalation : aspectstechniques.
Une chambre d’inhalation a étédéveloppée
afind’exposer
des porcs à uneatmosphère
contenant despoussières
et des endotoxines. Lesconcen-trations
gravimétriques
enpoussières
inhalables etrespirables
ont été mesurées à l’aide d’échan-tillonneurs depoussières,
etexprimées
enmglm
3
d’air. Les concentrations enpoussières respirables
ont aussi été mesurées en utilisant un
appareil
de mesureoptique
depoussière
fine,qui
s’est avéré donner des résultats similaires à ceux de la méthodegravimétrique.
Les concentrations enendo-toxines ont été évaluées par le test de la Limule et
exprimées
enng/m
3
d’air contenant lespoussières
inhalables et
respirables
ou parnglmg
depoussières
inhalables etrespirables.
Unepoussière
de farine alimentaire a été introduite dans l’enceinte afin d’atteindreplusieurs
niveaux depoussières
inhalables etrespirables
à des concentrations variant de 3,62 à 76,66mglrrr
3
et de 0,24 à 1,40mglm
3
respectivement.
Les concentrations en endotoxines ont été modulées enmélangeant
deslipopoly-saccharides d’ Escherichia coli avec la farine avant de la
pulvériser
dans l’enceinte. Les concentrations en endotoxines dans l’air contenant lespoussières
inhalables etrespirables
variaientrespectivement
de 28,9 à 270,0
ng/m
3
et de 2,22 à 36,38mg/m
3
,
en fonction du taux d’endotoxinesajoutées
à lafarine. Ce modèle
expérimental
permet dereproduire
des niveaux de concentration enpoussières
eten endotoxines
comparables
à ceux rencontrés dans lesporcheries.
Son utilisationpourrait
permettrel’étude de
l’importance
des contaminants de l’air dans ledéveloppement
despathologies
respira-toires chez le porc.
pollution
del’air Ipoussîère /endotoxine Ichambre
d’inhalationINTRODUCTION
There is
growing
interest in the influence ofpiggery
airpollution
in thepathogenesis
ofrespiratory
diseases inpigs
and farmers.Epidemiological
studies have shown that theprevalence
ofrespiratory
disorders inpig
farmers and animals correlates well with the concentrations of some indoorpollu-tants such as
dust, endotoxins,
and ammo-nia(Bongers
etal, 1987; Donham,
1991
).
These studiessuggest
that thepollutants
have apossible
role intriggering
oraggra-vating respiratory
diseases butthey
do notestablish the
precise
contribution of eachpollutant.
Complementary
experimental
studies arerequired
on exposure topollu-tants, in order to assess their
toxicity
for therespiratory system,
their mechanism ofaction,
and to establishdose-response
curves that would indicateacceptable
levels ofpollution
inpig farming.
Such studies necessitate the use of environmental cham-bers where the microclimate andcontami-nant concentrations can be controlled. In the
present work,
a newexperimen-tal
setup
wasdeveloped.
Its purpose wasto expose
pigs
to dust and airborne endo-toxins at levels liable to be encountered inpig
buildings.
Basal concentrations of dust and endotoxins were measured both in apiggery
and in a chamberhousing
twopiglets.
Afterwards,
dust was introduced into the chamber to obtain different levels of dust concentrations. A method forenriching
the introduced air with endotoxins is also described.MATERIALS AND METHODS
Air-pollutant
exposure chambersThe environmental chambers used to expose
pigs
to controlled aerial ammonia concentrations have beenpreviously
described in detail(Urbain
et al,
1993). Briefly,
closed stainless-steel andplastic
chambers(1.9 m
3
)
were constructed to housepigs weighing
up to 35kg.
Outside air waspassed through fiberglass
filters to remove dustand aerial bacteria. The air flow rate was 10 m3/h.
The mean concentration of bacterial
colony-form-ing
particles(BCFP),
measured in the presenceL-broth agar Petri dishes, was 28 385 ± 9 665 BCF p / M 3
; the percentage of
respirable
bacteria was 55%(BCFP
< 5pm).
Thepigs
were set on agrating
located 15 cm above the floor. There was no litter and the manure was removed twicedaily
by cleaning
the floor with water to maintain the ammonia concentration below 5 ppm.Instanta-neous and mean ammonia concentrations were measured
respectively
with Gastec tubes orby
titration of the
scavenged
gas with aspecific
elec-trode in an acidic solution.
Pigs
were fed withpel-lets ad libitum and water was
supplied by
anauto-matic valve. In the present
experiment,
twopigs
with abody weight
of 10kg
wereplaced
in thechamber in order to measure the
background
ofdust and endotoxin concentrations in the pres-ence of animals.
Air chamber enrichment with dust
A commercial
pig
feed flour(11111 Schyns,
Bat-tice,
Belgium)
was used as the dust source. Theflour was filtered on a sieve
through
a 450 pm mesh screen(VEL
3130006,Liege, Belgium),
to eliminate thelargest
particles.
The flour was thenhomogenized
in a commercial food mixer for 4 h(Kenwood
KM201)
and dried at 50 °C for 72 h.One
kilogram
of this flour was introduced into a0.03 m3 closed
plexiglass cylindrical
tank(fig 1)
(150
cmheight;
16 cm internal diameter(ID)).
A tube(ID:
1.8cm), extending
from the top of the tank to 20 cm above the floor inside the tank,was connected to a source of
compressed
air toproduce
turbulence and create a dust cloud. Inflow pressure measured at the air source andair flow were controlled,
respectively,
with amanometer
(B4593BD
Technofluid,Liege,
Bel-gium)
and a flow-meter(R101
Technofluid,Liege,
Belgium).
The inflow pressure in the tank was maintained constantthroughout
allexperiments
(1
bar).
Air withsuspended
particles
was intro-duced into the chamberby connecting
one of the nine exittubings,
located at differentheights
on the tank, to the chamber ventilation circuitMeasurements of dust concentration in the chamber
All air
samples
were taken within the normalbreathing
zone of thepigs.
‘Inhalable dust’ is defined as the fraction of airborne material which enters the nose and
mouth
during breathing
and is thus available fordeposition anywhere
in therespiratory
tract(Health
andSafety
Executive,1986).
Theweight
of the inhalable dust per cubic meter of air canbe estimated
using
an airsampler composed
of a ’seven-hole’sampling
head(SK-225-70,
DEHA,Belgium) holding
a 25 mmpolycarbonate
filter(Millipore ATTP02500)
and connected to a pump unit which maintains a constant air flow rate of2 Umin
through
this filter for 2 or 3 h(SK-224-43-EXKB, DEHA,
Belgium).
The air flow of the pump was controlled with aprecision
rotameter(Bioblock
A29443, llikirch,France).
Filters wereweighed
on a Mettler balanceimmediately
before and after thepumping period.
Several blanks were retained as reference filters. The results wereexpressed
inmg/m3.
’Respirable
dust’designates
the fraction ofmaterial which penetrates to the gas
exchange
regions
of thelung.
Since it could not bemea-sured
directly,
we used one of two methods tosimulate the
deposition
of dust in therespiratory
tract. One method involved the use of a
personal
sampling
head(SK-225-3,
DEHA,Belgium)
con-taining
the same filter as mentioned above,equipped
with an aluminiumcyclone preselector
(SK-225-01-01,
DEHA,Belgium)
connected to a pump unit(SK-224-43-EXKB,
DEHA,Belgium).
This
cyclone
head has a 50% cut-off effective-ness value of 5.3 Nm at a flow rate of 1.9 L/min. This method, however, lacksprecision
when thedust concentration is low, due to the
slight
changes
in theweight
of the filterduring
thesam-pling period.
For this reason, the filters were usedonly
formeasuring
endotoxin concentrationsexpressed
in nanograms of endotoxin inres-pirable
dust per cubic meter of air(see below).
A second method involved use of the ‘TM
dig-ital
uP respirable dust-measuring
instrument’(TM
N
P)
(Dragger ballings,
Brussels,Belgium),
which operates
using
theprinciple
of straylight
measurement. The
intensity
of straylight
isdirectly
proportional
to the concentration of dustparticles
ranging
in size from 0 to 8 pm. The apparatus is calibratedby
the manufacturer who determinesthe dust concentrations in
milligrams
per cubicmeter
(
M
g/
M
3
),
using
wheat flourparticles, by
comparing
the valuesdisplayed by
theTM
N
P
with thegravimetrically
measured values inmilligrams
per cubic meter
(mg/m
3
).
The apparatusdisplays
a dust concentration in
milligrams
per cubic meter(mg/m
3
)
with asensitivity
of 0.01M
g/
M
3
.
Mea-surements weregenerally performed
every 20 s andaveraged
over aperiod
of 2-3 h. However, toassess this method, the values were
compared
with those recorded with the
gravimetric
methodperformed
over alonger period
of 6 h.The
particles
size was measuredby optical
examination. Dust
samples
were takenusing
the method described to measure theweight
of the inhalable dust. The pump unitoperated
at 2 L/min for 2 min. Then the filter was examinedusing
anOlympus microscope
connected to a frame anal-yser(Vidas 21
The
size of 100particles ranging
in size from 10 to 100 pm was measured on each filter,taking
into account thehigher
dimension of eachparticle.
Enriching
dust in endotoxins andmeasuring
air endotoxin concentrationsThe method consisted of
mixing
freeze-driedEscherichia coli endotoxins
(55
or 100 mg ofserotype 0127:B8,
Sigma)
with 250 g of sifted flour in a Kenwood feed mixer for 1 h. Next, 250 gflour was added at
hourly
intervals in order to obtain 1kg
of mixed flour. The air endotoxin con-centrations were measured on the filters used forgravimetric
measurements of inhalable andres-pirable
dust. Aftersampling,
each filter wasplaced
in a sterile
polypropylene
tube(Corning
25330-50,VEL
Belgium)
and stored at-20 °C.Endotoxin-free
phosphate-buffered
saline was introduced into the tube and the Limulus assay was used tomeasure the endotoxin content of the dust
(Michel
et al,
1991
The
results areexpressed
innanograms of endotoxin in the inhalable or
res-pirable
dust per cubic meter of air, or innanograms per
milligram
of inhalable orrespirable
dust.Experimental protocol
Two
pigs
were introduced into thechamber.
Sam-pling
and measurements wereperformed
overmeasurements, dust with or without added
endo-toxins was introduced into the chamber. In order
to obtain different dust concentrations in the
chamber, the air flow inside the tank was
adjusted
(1.5
or 2m
3
/h)
whilemaintaining
a constant inflow pressure. A second method consisted ofcon-necting
one of several outflow tubes, located atdifferent
heights
on the tank(65,
95, 115, and 135 cm from the floor of thetank),
to the air ven-tilation circuit of the chamber,taking advantage
of the fact that thehigher
the tank exit, the lowerthe amount of dust
expelled
from the tank. Theweight
of flour in the tank was measured beforeand after each
experimental period.
Allmea-surements were also performed in the grower
facility
of apiggery
in order to compare the values obtained in the chamber with those measured incommercial units.
RESULTS
The amount of dust blown from the tank decreased
exponentially
withincreasing
exit tubeheight
(table I).
Theequations
linking
y, the amount of dust blown per hour(g/h),
and x, the
height
of the tube(cm),
wererespectively
y= 176 x10-00102!=
0.
912
)
andy
’=
9 793x1
O
-0v205x
(R
= 0.950)
for air flow rates of 1.5 and 2m
3
/h
inside the tank.The
highest
concentrations of blown dust were considered to be toohigh (98
and 535g/h )
for use in ourexperiments.
The recorded base-line values for the
inhalable and
respirable
dustconcentra-tions in the chamber were
respectively
0.70 t 0.43(n
=5)
and 0.05 ± 0.01(n
=5)
mg/m
3
(table
I).
These values were lower than the values recorded in apigpen:
3.80 ±0.27
(n
=4)
and 0.32 ± 0.05(n
=3)
mg/m
3
,
respectively.
Thepercentage
ofrespirable
dust was about the same in the chamber(7.14%)
as in thepigpen
(9.30%).
Theinhal-able dust concentrations inside the chamber were
closely
related to theheight
of the exit tubeconnecting
the tank to the ventilation circuit of the isolator(table
I).
However,
thepercentage
ofrespirable particles
measured whenhigh
amounts of dust weresuspended
in the air chamber was smaller(1.22%)
than the value obtained at a low level ofenrich-ment
(6.63%).
The data shown in table I also revealed thatincreasing
the dust con-centrationby adjusting
the air flow in the tank led to ahigher percentage
ofrespirable
particles
than that which was recorded at a similar dust concentration obtained with alower air flow in the
tank,
respectively,
7.39 versus 2.5%.The
optical
examination of the dustpre-sent on the filters has shown that the mean size of
particles ranging
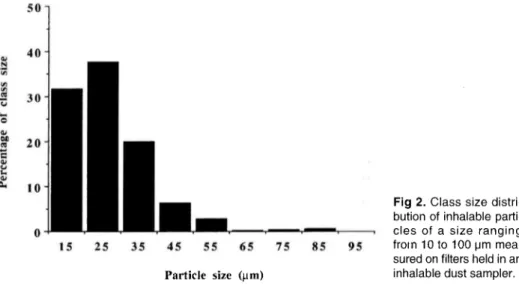
from 10 to 100 Nm was 26.3 Nm. The mean class size distri-bution from 22 examined filters is illustrated infigure
2.Figure
3 shows therespirable
dust con-centration values measured with theTM
N
P
compared
with those obtainedby
thegravi-metric method. The values obtained with both methods were similar as illustrated
by
thegood
linear correlation between these values and the absence ofsignificant
dif-ference
(P
<0.05)
of the calculatedslope
value from 1.
The base-line endotoxin concentrations in the chamber were 16.16 ± 12.49
ng/m
3
(n
=2) (air
containing
all inhalableparticles)
and < 1.17
ng/m
3
(n
=2)
(air containing only
the
respirable particles).
Thecorrespond-ing
values measured in apiggery
were 190.5 ± 77.5ng/m
3
(n
=4)
and 2.6 ±0.5
ng/m
3
(n
=3).
These concentrationsexpressed
in nanograms permilligram
of inhalable dust were 41.7 ± 36.5ng/mg
(n
=2)
in the chamber and 49.9 ± 19.4ng/mg
(n
=4)
in thepiggery.
Therespirable
endo-toxin concentration in the
piggery,
estimated on the basis of theweight
of the dust mea-sured with theTM
P
P
instrument,
was 7.30 ±0.46
ng/mg. By enriching
the air inside the chamber with dustcontaining
endotoxins we were able to increase the endotoxin con-centration in the aircontaining
inhalable dust9.3-fold,
from 28.9 to 270.0ng/m
3
.
In aircontaining respirable
dust,
the increasefac-tor was 16.4
(from
2.22 to 36.38ng/m
3
)
(table II).
Thesechanges
were due to an increase in the endotoxin concentration in thedust,
as shown in the table II. 1.DISCUSSION
In the
present
study,
pig
feed flour was usedto create a
dusty
cloud in an environmental chamber. The dustpresent
inpig buildings
comespartly
from feed. Other constituents are fecal material andpig
scales(Donham,
1986).
Fecal material isclassically
consid-ered a source of smallparticles
andGram-negative
bacteriacontaining
endotoxins. Feedparticles
arebigger
and constitute the bulk of the dust. Inhalable dustconcentra-tions in
pig buildings generally
range from 2 to 20mg/m
3
and therespirable fraction,
measuredby
thegravimetric
method,
varies from 0.2 to 1.0mg/m
3
(Donham
etal, 1986;
Donham,
1991
The
highest
values are recordedduring
the winterperiod
and infat-tening
houses. Inhalable dustconcentra-tions recorded
during feeding (up
to27.3
mg/m
3
)
orweighing (up
to 24.0mg/m
3
)
arehigher
thanduring
normal maintenanceperiods
(up
to 13.7mg/m
3
)
(Larsson
etal,
1992,
1994), suggesting
thatpig activity
causes considerableagitation
of settled dust. These values are inagreement
with our values recorded in thepiggery.
How-ever, values as
high
as 183 t 85 and4.4 ± 2.3
mg/m
3
(for
inhalable andrespirable
dustrespectively)
have been recordeddur-ing
the winterperiod
in grower facilities(Pickrell et al, 1993).
Inhalable dust levels in our
study
were measuredusing
a ’seven-hole’ head fortechnical reasons. If the IOM
(Institute
ofOccupational Medicine) open-phase
cas-settesystem
isregarded
as anevolving
standard for inhalable dustsampling,
it is inconvenient fordetermining
endotoxin con-centrations in dust.Indeed,
the endotoxin-contaminated dust is collected on both the filter and the internal walls of the IOM head. This makes it necessary to store the wholecassette
holding
the filter. The endotoxin concentrations can be determined later.Moreover,
these cassettes areexpensive.
Using
the seven-holehead,
only
the filter needs to be stored for further endotoxindetermination.
However,
in ourexperi-mental
conditions,
the dust concentrations measured with the IOM head were 43 t33%
higher
than with the seven-hole head.The dust concentrations measured with the latter are therefore
probably
underesti-mated.Base-line values recorded in the chamber were lower than those obtained under field conditions.
However,
the datapresented
intable I show that dust concentrations as
high
as those measured in the field can be obtainedusing
the method detailed in thepresent
study.
The best way toadjust
the dust concentrations inside the chamber wasto select the
highest
exit tubes and toadjust
the air flow rate. The ratio ofrespirable
toinhalable dust
(7-9%)
recorded under these conditions in the chamber wascomparable
to that recorded in our
piggery
and alsocom-parable
to the values recordedby
Donhamet al
(1986)
inpig
buildings.
Choosing
the lower exit tubes increased the dustcon-centration,
but thepercentage
ofrespirable
particles
was lower than under field condi-tions. Isolation chambers with dustenrich-ment have been
previously
used withpigs,
but withoutrefering
to anydeposition
in therespiratory
system.
Doig
andWilloughby
(1971)
exposed
animals to corn-starch dust and toground
corn dust at 200 and 10mg/m
3
respectively.
Curtis et al(1975)
exposed piglets
to dust collected from con-vection tubes in aswine-finishing
house,
atconcentrations of 10 and 300
mg/m
3
.
Res-pirable
dust concentrations were not mea-suredby
these authors.Moreover,
lower dust concentrations have notyet
been tested inpigs.
At low dust
concentrations,
the lack ofsensitivity
of thegravimetric
method(see
Materials andmethods)
did not allowpre-cise measurement of the
respirable
dust concentration. This iswhy
another method(a TM
N
P
respirable dust-measuring
instru-ment)
was used to determine this parame-ter. Thegravimetric
method is based on theprinciple
that smallparticles
arescavenged
on the filteraccording
to a statistical distri-bution(Health
andSafety
Executive,
1986).
Forexample,
thecyclone
head used in thisstudy
selects 50% of all 5.3 Nmparticles,
the selectedparticles being finally
scav-enged
on the filter. This distribution isthe-oretically
similar to that observed in the humanrespiratory system.
TheTM
N
P
appa-ratus measures the concentration of small
particles
and converts the measured val-ues tomilligrams
per cubic metertaking
intoaccount a correction factor calculated
by
the manufacturer. Agood
correlation(R
=0.915)
was obtained between the values measuredby
the twomethods,
and the absence ofsignificant
difference between the values obtained with both methods(fig 3)
shows theequivalence
of these twotech-niques.
Note that the manufactorgives
a correlation of 0.99 for values up to10
mg/m3.
Endotoxin concentrations in
pig
buildings
range from 4 to 445ng/m
3
in aircontaining
inhalable dust(Attwood
etal,
1987;
Don-ham etal,
1986;
Donham1991;
Heedericket
al, 1991;
Pickrell etal,
1993).
Values ashigh
as 716 and 1 300ng/m
3
have been recordedduring feeding
andweighing
respectively
(Larsson
etal,
1992, 1994).
Inrespirable
dust,
the mean endotoxin con-centration ranges from 8 to 300ng/m
3
(Don-ham
1991;
Larsson etal, 1992;
Pickrell etal,
1993).
Under ourexperimental
conditions,
endotoxin concentrations were in the range
of the values recorded in
pig buildings.
Expressed
in nanograms permilligram
of inhalabledust,
the concentrations range from 0.4 to 113ng/mg
(Donham
etal,
1986;
Attwood et
al, 1987;
Crook etal, 1991;
Pick-rell etal, 1993).
Pickrell et al(1993)
found thatrespirable
dust was four times richer in endotoxins than inhalable dust. Under ourexperimental
conditions,
therespirable/inhal-able ratio for this factor
ranged
from 0.43to 1.20. The ratio obtained in our
piggery
was 0.15.In
conclusion,
inhalable andrespirable
dust concentrations in our environmentalchamber can be measured and
reproduced
at levels similar to those encountered in
pig
buildings.
Furthermore,
it ispossible
to mod-ulate endotoxinconcentrations,
whilemain-taining
agiven
dust concentration. We havedeveloped
a new tool forexposing piglets
to common air
pollutants.
This model could be used to determine theimportance
ofthese contaminants in the
development
ofrespiratory
diseases.ACKNOWLEDGMENTS
The authors thank C
Remy
from thelaboratory
of A Dewaele(Liege, Belgium),
and S Bloden for their technical assistance. Financial support wasprovided by
IRSIA(Institut
pourl’encouragement
de la recherche
scientifique
dans l’industrie etI’agriculture).
REFERENCES
Attwood P, Brouwer R, Ruigiwaard P, Versloot P, De wit R, Heederik D, Boleij JSM (1987) A study of the
relationship between airborne contaminants and environmental factors in Dutch swine confinement
buildings. Am Ind Hyg Assoc J 48, 745-751
Bongers P, Houthuijs D, Remijn B, Brouwer R, Bier-steker K (1987) Lung function and respiratory symp-toms in pig farmers. Br J Ind Med 44, 819-823 Crook B, Robertson JF, Travers Glass SA, Botheroyd
EM, Lacey J, Topping MD (1991) Airborne dust, ammonia, microorganisms, and antigens in pig
con-finement houses and the respiratory health of exposed
farm workers. Am Ind Hyg Assoc J 52, 271-279 Curtis SE, Anderson CR, Simon J, Jensen AH, Day DL,
Kelley KW (1975) Effects of aerial ammonia,
hydro-gen sulfide and swine-house dust on rate of gain and respiratory tract structure in swine. J Anim Sci 41,
735-739
Doig DA, Willoughby RA (1971) Response of swine to atmospheric ammonia and organic dust. J Am Vet
Med Assoc 159, 1353-1361
Donham KJ (1986) Hazardous agents in agricultural
dusts and methods of evaluation. Am J Ind Med 10,
205-220
Donham KJ, Popendorf W, Palmgren U, Larsson L (1986) Characterisation of dust collected from swine confinement buildings. Am J Ind Med 10, 294-297 Donham JD (1991) Association of environmental air
contaminants with disease an productivity in swine. Am J Vet Res 52, 1723-1730
Health and Safety Executive (HSE): Occupational Medicine and Hygiene Laboratory (1986) General methods for the gravimetric determination for
res-pirable and total inhalable dust. Methods for the Deter-mination of Hazardous Substances (MDHS), HSE Guidance Note MDHS, HMSO, London, 14, 1-7 Heederik D, Brouwer R, Biersteker K, Boleij JSM (1991)
Relationship of airborne endotoxin and bacteria lev-els in pig farms with the lung function and respiratory
symptoms of farmers. Int Arch Occup Environ Health
62, 595-601
Larsson K, Eklund A, Malmberg P, Bein L (1992) Alter-ations in bronchoalveolar lavage fluid but not in lung
function and bronchial responsiveness in swine
con-finement workers. Chest 101, 767-774
Larsson K, Eklund AG, Hansson LO, lsaksson BM,
Malmberg PO (1994). Swine dust causes intensive airways inflammation in healthy subjects. Am J Respir
Crit Care Med 150, 973-977
Michel 0, Ginanni R, Duchateau J, Vertongen F, Le Bon
B, Sergysels R (1991) Domestic endotoxin
expo-sure and clinical severity of asthma. Clin Exp Allergy 21, 441-448
Pickrell JA, Heber AJ, Murphy JP et al (1993) Charac-terisation of particles, ammonia and endotoxin in swine confinement operations. Vet Hum Toxicol35,
421-428
Urbain B, Gustin P, Prouvost JF, Ansay M, Michel 0,
Nicks B (1993) Microclimat et composition de I’air dans une enceinte ferm6e destin6e a 1’6tude de la toxicité des polluants amosph6riques chez le