INTRODUCTION
Cognitive changes associated with normal aging are characterized by a large variability in decline rates and trajectories across cognitive domains [1–4]. Age-related cognitive decline is also highly variable across individuals [5], and inter-individual variability in cognitive changes increases with advancing age [6]. Several physiological and psychological environmental risk and protective factors were proposed to explain this variability [7], such as cognitive and brain reserve [8], affective disorders [9], allostatic load [10], and sleep quality [11].
As proposed by Stern et al. [8], brain reserve is commonly conceived as a neurobiological capital (numbers of neurons, synapses, etc.) while cognitive reserve refers to the adaptability of cognitive processes. These cognitive processes can be influenced by the interaction of innate characteristics (e.g. genetically determined) and cumulative lifetime experiences, that will be the focus of the present study. Contrary to brain reserve, cognitive reserve (CR) is therefore not fixed or immutable. Interestingly, the two kind of reserve help counteracting decline associated with brain aging, pathology or insult ([8]; see also [12] for a complete
www.aging-us.com
AGING 2019, Vol. 11, No. 17
Research Paper
Cognitive efficiency in late midlife is linked to lifestyle characteristics
and allostatic load
Justinas Narbutas
1,2,*, Maxime Van Egroo
1,*, Daphne Chylinski
1,*, Pamela Villar González
1,
Claudia Garcia Jimenez
1, Gabriel Besson
1, Pouya Ghaemmaghami
1, Grégory Hammad
1, Vincenzo
Muto
1, Christina Schmidt
1,2, André Luxen
1, Eric Salmon
1,2,3, Pierre Maquet
1,3, Christine Bastin
1,2,
Gilles Vandewalle
1, Fabienne Collette
1,21GIGA-Institute, Cyclotron Research Centre/In Vivo Imaging, University of Liège, Liège 4000, Belgium 2Psychology and Neuroscience of Cognition Research Unit, Faculty of Psychology and Educational Sciences, University of Liège, Liège 4000, Belgium
3Department of Neurology, CHU Liège, Liège 4000, Belgium *Equal contribution
Correspondence to: Fabienne Collette; email: f.collette@uliege.be Keywords: cognition, midlife, aging, cognitive reserve, allostatic load
Received: May 29, 2019 Accepted: August 22, 2019 Published: September 9, 2019
Copyright: Narbutas et al. This is an open-access article distributed under the terms of the Creative Commons Attribution License (CC BY 3.0), which permits unrestricted use, distribution, and reproduction in any medium, provided the original author and source are credited.
ABSTRACT
We investigated whether cognitive fitness in late midlife is associated with physiological and psychological factors linked to increased risk of age-related cognitive decline. Eighty-one healthy late middle-aged participants (mean age: 59.4 y; range: 50-69 y) were included. Cognitive fitness consisted of a composite score known to be sensitive to early subtle cognitive change. Lifestyle factors (referenced below as cognitive reserve factors; CRF) and affective state were determined through questionnaires, and sleep-wake quality was also assessed through actimetry. Allostatic load (AL) was determined through a large range of objective health measures. Generalized linear mixed models, controlling for sex and age, revealed that higher cognitive reserve and lower allostatic load are related to better cognitive efficiency. Crystallized intelligence, sympathetic nervous system functioning and lipid metabolism were the only sub-fields of CRF and AL to be significantly associated with cognition. These results show that previous lifestyle characteristics and current physiological status are simultaneously explaining variability in cognitive abilities in late midlife. Results further encourage early multimodal prevention programs acting on both of these modifiable factors to preserve cognition during the aging process.
discussion of the relationships between the concepts of cognitive and brain reserve).
In normal aging, the influence of cognitive reserve factors on cognition is grounded on the positive association between cognitive efficiency and (a) higher level of education and intelligence [13–16], (b) employment complexity and autonomy [17–22], (c) physical activity, engagement in cognitively demanding leisure activities and/or sustained social interactions [23]. These factors also delay pathological cognitive decline, with a later onset of Alzheimer’s disease in individuals with higher reserve [8]. Interestingly, cognitive and brain reserve may have protective and compensatory effects on cognition already in middle-aged people, i.e. around 40 or 50 years old [24]. Among affective disorders, depression and anxiety are the most prevalent in late life [25, 26] and both affect cognition in aging even at a sub-threshold level [27]. High levels of depression and anxiety are associated with decreased performance, particularly for episodic memory and executive functioning [28–32]. Moreover, mild anxiety symptoms in older participants may predict future decline in executive functions [33], while recurrent depression and anxiety in midlife are associated with an increased risk of dementia [34–36].
At the physiological level, several studies emphasized a link between cardiovascular functioning and cognition already in midlife [37–39]. Likewise, lipid and glucose metabolism, inflammation, cortisol level, and sympathetic nervous system functioning are associated with early cognitive decline [38, 40–44]. These physiological measurements were summarized in a comprehensive index of physiological load related to stress, the “allostatic load” [45] that was reported to be negatively associated with episodic memory performance and executive functioning in middle-aged and older adults [10].
Finally, evidence also exists for an influence of sleep quality on cognition in late life [11]. Sleep-wake regulation begins to deteriorate in midlife, and both subjective and objective measures of sleep quality and wakefulness are associated with poorer cognitive fitness, including worse performance in processing speed, memory, and executive function [46–49]. Increased fragmentation of the rest-activity cycle even predicts future cognitive decline and the risk of developing dementia [11, 50].
Some limitations exist in most of these studies, however. Environnemental influences on cognition were mostly considered as independent factors, while they likely compensate or worsen each other [51–53]. In addition, most studies assessed mainly older participants, even though late middle-age (50–70 y.o.) can be considered as
a target period as individuals are keeping up with professional engagements despite possible slight (and unnoticed) cognitive decline [54]. They also included a limited evaluation of cognitive efficiency [52, 55], and assessment of physiological factors was sometimes only based on self-report measures [3, 52, 55].
Here, we investigated whether cognition in a group of late middle-aged individuals is associated with cognitive reserve, affective state, allostatic load, and sleep quality. Cognitive status was determined by the Preclinical Alzheimer Cognitive Composite score (PACC5), a composite measure known to be sensitive to early subtle cognitive changes, possibly leading to dementia [56, 57]. Cognitive reserve was measured by assessing educational level, occupational demands, physical activities, and leisure activities across the lifespan. Affective state corresponded to the score on two questionnaires assessing respectively anxiety and depression. Allostatic load was assessed via a comprehensive range of measures: parasympathetic nervous system functioning, cardiovascular functioning, lipid metabolism, glucose metabolism, chronic inflammation, HPA axis functioning, sympathetic nervous system functioning. We evaluated these physiological factors using objective measures, in contrast to some previous studies [3, 52, 55]. Finally, sleep-wake quality was measured based on one
objective (actigraphy, measuring the fragmentation of the rest-activity cycle) and two subjective measures (questionnaires assessing sleep quality and daytime sleepiness).
Generalized linear mixed models (GLMM) were applied to compute all statistics. All models included PACC5 as the dependent variable, and controlled for sex and age. At first, GLMM evaluated the association of each global factor (cognitive reserve, affective state, allostatic load, and sleep quality) with PACC5 in separate models. We were also interested in identifying whether specific aspects of each factor were more strongly associated with cognitive status and whether the four aforementioned factors can jointly be related with cognition. Therefore, next statistical models included each component of the global factor (e.g. cognitive reserve was decomposed into its sub-factors), and the final models included the significant predictors of PACC5 that were identified for each factor.
RESULTS
Descriptive statistics
Demographics and cognitive outcome (PACC5) are presented in Table 1, while Table 2 gathers raw values of cognitive reserve, affective state, allostatic load, and sleep quality.
Table 1. Descriptive statistics of demographical data and cognitive outcome (PACC5) (n = 81).
Mean SD Min Max
Demographical data
Age, years 59.41 5.41 50.00 69.00
Sex, female, n (%) 54 (66.7 %)
Etnic status, Caucasian, n (%) 81 (100 %)
Educational level: Primary School 0 (0%) Secondary School 21 (25.9 %) Bachelor degree 30 (37.0 %) Master degree 24 (29.6 %) PhD or higher 6 (7.4 %) Socio-economic status* 3.44 0.74 1.00 4.00
PACC5 (raw scores)
FCSRT (0–96) 80.90 6.47 63.00 92.00
Logical Memory Test, items for delayed recall (0–25) 12.17 4.00 2.00 22.00
Digit Symbol Substitution Test (0–133) 71.94 12.56 39.00 99.00
Category Fluency, 1 min 19.79 3.58 10.00 29.00
Mattis Dementia Rating Scale (0–144) 142.38 2.09 134.00 144.00
SD: Standard Deviation; FCSRT: Free and Cued Selective Reminding Test (Free + Total recall).
* Socio-economic status is based on cognitive load of the last profession, where 1 means low cognitive load (e.g. office cleaner), and 4 high cognitive load (e.g. secondary schoold teacher).
Effect of cognitive reserve
Global measure of cognitive reserve was significantly positively associated with PACC5 performance (Table 3, grey area and Figure 1A). Assessment of the association between PACC5 and all separate measures of cognitive reserve (Table 3, white area) showed a significant positive association with the score of the French version National Adult Reading Test (fNART), a proxy of crystallized intelligence (Table 3; Figure 1B). Moreover, sex was also significantly associated with PACC5 in the two models, with a better performance for women (Figure 1C).
Effect of affective state
GLMM analysis showed that global score of affective state was not significantly associated with PACC5 performance (Table 4, grey area). We then evaluated the impact of the two separate affective measures, depression and anxiety, on PACC5 score (Table 4, white area). None of those measures were found to be significantly associated with PACC5 performance. As in the previous model, sex was significantly associated with PACC5, both in analyses with global factor and with specific sub-scores.
Effect of allostatic load
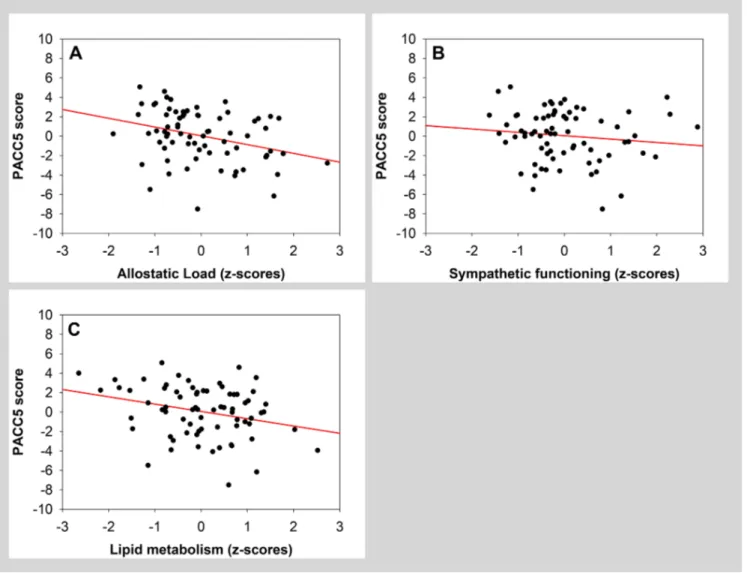
GLMM analysis revealed that global measure of allostatic load was significantly negatively associated
with PACC5 score (Table 5, grey area; Figure 2A). A separate analysis further indicated that, among all factors composing allostatic load, both sympathetic functioning and lipid metabolism were significantly and negatively associated with PACC5 (Table 5, white area; Figure 2B and 2C). Sex was significantly associated with PACC5 in the model with the global allostatic load measure.
Effect of sleep-wake quality
Global measure of sleep-wake quality was not significantly associated with PACC5 (Table 6, grey area). Considering sleep factors separately in a second model, they did not yield any significant associations with PACC5 (Table 6, white area). Sex was significantly associated with PACC5 in both models.
Simultaneous effect of cognitive reserve and allostatic load
In a final set of models, we included the global factors (cognitive reserve and allostatic load) or sub-factors (fNART, sympathetic functioning and lipid metabolism) that were significantly associated with PACC5 in the previous models. The analysis on global factors revealed that while cognitive reserve was positively associated with PACC5, allostatic load had no significant association (Table 7, grey area). When fNART, sympathetic functioning and lipid metabolism were included in a same model, fNART was significantly and
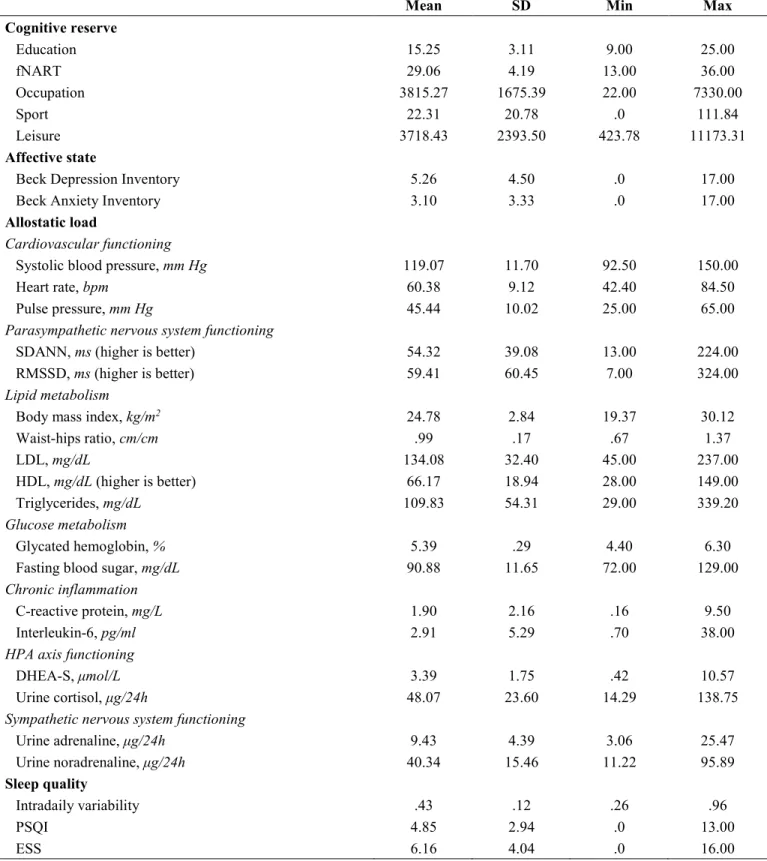
Table 2. Descriptive statistics of raw values of cognitive reserve, affective state, allostatic load, and sleep quality (n = 81).
Mean SD Min Max
Cognitive reserve Education 15.25 3.11 9.00 25.00 fNART 29.06 4.19 13.00 36.00 Occupation 3815.27 1675.39 22.00 7330.00 Sport 22.31 20.78 .0 111.84 Leisure 3718.43 2393.50 423.78 11173.31 Affective state
Beck Depression Inventory 5.26 4.50 .0 17.00
Beck Anxiety Inventory 3.10 3.33 .0 17.00
Allostatic load
Cardiovascular functioning
Systolic blood pressure, mm Hg 119.07 11.70 92.50 150.00
Heart rate, bpm 60.38 9.12 42.40 84.50
Pulse pressure, mm Hg 45.44 10.02 25.00 65.00
Parasympathetic nervous system functioning
SDANN, ms (higher is better) 54.32 39.08 13.00 224.00
RMSSD, ms (higher is better) 59.41 60.45 7.00 324.00
Lipid metabolism
Body mass index, kg/m2 24.78 2.84 19.37 30.12
Waist-hips ratio, cm/cm .99 .17 .67 1.37 LDL, mg/dL 134.08 32.40 45.00 237.00 HDL, mg/dL (higher is better) 66.17 18.94 28.00 149.00 Triglycerides, mg/dL 109.83 54.31 29.00 339.20 Glucose metabolism Glycated hemoglobin, % 5.39 .29 4.40 6.30
Fasting blood sugar, mg/dL 90.88 11.65 72.00 129.00
Chronic inflammation
C-reactive protein, mg/L 1.90 2.16 .16 9.50
Interleukin-6, pg/ml 2.91 5.29 .70 38.00
HPA axis functioning
DHEA-S, μmol/L 3.39 1.75 .42 10.57
Urine cortisol, μg/24h 48.07 23.60 14.29 138.75
Sympathetic nervous system functioning
Urine adrenaline, μg/24h 9.43 4.39 3.06 25.47 Urine noradrenaline, μg/24h 40.34 15.46 11.22 95.89 Sleep quality Intradaily variability .43 .12 .26 .96 PSQI 4.85 2.94 .0 13.00 ESS 6.16 4.04 .0 16.00
SD: standard deviation; fNART: National Adult Reading Test French version; SDANN: standard deviation of average heart beat-to-beat intervals; RMSSD: root mean square of successive differences between normal heartbeats; LDL: fasting blood low-density lipoprotein cholesterol; HDL: fasting blood high-low-density lipoprotein cholesterol; HPA: hypothalamic-pituitary-adrenal; DHEA-S: fasting blood dehydroepiandrosterone sulfate; PSQI: Pittsburgh Sleep Quality Index; ESS: Epworth Sleepiness Scale (see Methods section for the references of the tests and questionnaires).
Table 3. Statistical outcome of the GLMM seeking for associations between PACC5 (dependent variable) and global cognitive reserve, and its sub-scores (n = 75; 5 outliers removed, one missing data).
Estimate ±SE F value (df) P
Sex −2.24 ± .59 14.58 (1,71) .0003 (Rsp2=.17)
Age −.47 ± .28 2.93 (1,71) .09
Cognitive Reserve (global) .87 ± .29 8.64 (1,71) .004 (Rsp2=.11)
Sex −1.97 ± .65 9.05 (1,67) .004 (Rsp2=.12) Age −.45 ± .29 2.41 (1,67) .13 Education −.12 ± .34 .12 (1,67) .73 fNART 1.02 ± .34 8.89 (1,67) .004 (Rsp2=.12) Occupation −.05 ± .31 .03 (1,67) .86 Sport .14 ± .39 .14 (1,67) .71 Leisure .10 ± .34 .09 (1,67) .77
Grey and white parts represent distinct models. Rsp2: Semi-partial R2, SE: Standard Error; df: degrees of freedom; fNART: National Adult Reading Test (French version).
Figure 1. (A, B) Scatter plots visualizing the association between PACC5 and cognitive reserve measures (global measure and fNART).
Regressions were used for visual display only, and not as a substitute for the full GLMM statistics presented in Table 3. (C) Bar plot visualizing
Table 4. Statistical outcome of the GLMM seeking for associations between PACC5 (dependent variable) and global affective state, and its sub-scores (n = 80; one outlier removed).
Estimate ±SE F value (df) P
Sex −1.81 ± .66 7.57 (1,76) .007 (Rsp2=.09)
Age −.15 ± .30 .25 (1,76) .62
Affective State (global) .11 ± .33 .11 (1,76) .74
Sex −1.81 ± .66 7.44 (1,75) .008 (Rsp2=.09)
Age −.15 ± .31 .23 (1,75) .64
Depression .05 ± .36 .02 (1,75) .90
Anxiety .08 ± .39 .04 (1,75) .84
Grey and white parts represent distinct models. Rsp2: Semi-partial R2; SE: Standard Error; df: degrees of freedom.
Table 5. Statistical outcome of the GLMM seeking for associations between PACC5 (dependent variable) and global allostatic load, and its sub-scores (n = 72; 8 outliers removed; one missing data).
Estimate ±SE F value (df) P
Sex −1.50 ± .62 5.84 (1,68) .03 (Rsp2=.08)
Age −.16 ± .30 .29 (1,68) .59
Allostatic Load (global) −.71 ± .32 5.02 (1,68) .03 (Rsp2=.07)
Sex −1.18 ± .64 3.38 (1,62) .07 Age −.57 ± .32 3.15 (1,62) .08 Cardiovascular functioning .60 ± .34 3.17 (1,62) .08 Parasympathetic functioning −.77 ± .40 3.67 (1,62) .06 Lipid metabolism −.87 ± .36 5.86 (1,62) .02 (Rsp2=.09) Glucose metabolism −.06 ± .40 0.03 (1,62) .87 Chronic inflammation −.23 ± .57 0.16 (1,62) .69
HPA axis functioning −.23 ± .31 0.55 (1,62) .46
Sympathetic functioning −.93 ± .35 7.03 (1,62) .01 (Rsp2=.10)
Grey and white parts represent distinct models. Rsp2: Semi-partial R2; SE: Standard Error; df: degrees of freedom; HPA: hypothalamic-pituitary-adrenal.
positively associated with PACC5, and both sympathetic functioning and lipid metabolism were significantly negatively associated with the cognitive score (Table 7, white area).
DISCUSSION
This study investigated how cognitive performance in late middle-aged individuals is associated with cognitive reserve, affective state, allostatic load, and sleep quality taken separately and simultaneously. Our main finding is that, in late middle-age, higher cognitive reserve and lower allostatic load are related to better cognitive efficiency when assessed through the PACC5 composite score. This is observed when the two global measures are considered apart. Our results further show that the only sub-factors to be significantly associated with cognition were crystallized intelligence in CR factors, and both sympathetic nervous system functioning and lipid metabolism in AL. Moreover, when these three specific
measures were considered together, they all remained significantly associated with PACC5-derived cognitive efficiency. Compared to the other measures we considered, these three measures stand therefore as the most associated with cognitive efficiency in late middle age.
A positive influence of specific aspects of cognitive reserve on cognition was previously reported in older individuals [17, 18, 20, 51, 52]. We have demonstrated here that this effect can be observed already in late midlife. Moreover, the most significant contribution to cognitive reserve in our middle-aged population was that of the fNART score, pointing to a predominant protective role of crystallized intelligence in accordance with previous studies [15, 58, 59]. Crystallized intelligence, which refers to specific, acquired knowledge (e.g. vocabulary, general information), has been shown to be even a better predictor of cognitive efficiency in aging than education [15, 59].
Interestingly, Richards and Sacker suggested that crystallized intelligence in middle-age is independently determined at first by childhood cognition, subsequently by educational level, and finally by occupational attainment [60]. Therefore, it seems that innate characteristics, i.e. genetic, are a main determinant of cognitive reserve [61, 62]. Based on these data, we can suggest that, in our sample, other lifestyle characteristics contribute much less to maintaining cognitive abilities as they are mainly driven by crystallized intelligence (fNART performance) determining educational level that itself increases cognitive reserve by fostering the development of new cognitive strategies [59]. Moreover, 69.5% of our participants were still professionally active, implying that the respective contribution of occupational demands and leisure (intellectual and physical) activities on cognitive reserve varied substantially in our sample [17]. Our sample may therefore still be too small to
efficiently grasp such a “noisy” profile and track other expected links with cognitive efficiency. Beyond the scope of this study, some recent data suggest that epigenetic traits, which can boost or interefere with the transcription of specific genes, could also influence the relationships between life environment and cognitive efficiency. Indeed, epigenetic traits are heritable [63], and are affected by chemical exposure, medication, and lifestyle (e.g. diet) [64]. Therefore, it would be interesting to include genetic and epigenetic measures (e.g. methylation) and to assess parental lifestyle in future studies focusing on the link between environmental factors and late-life cognition.
Aside from cognitive reserve, our data confirmed that a global score of allostatic load is significantly associated with global cognition in late midlife [10, 45]. Our sub-factor analyses revealed that sympathetic functioning
Figure 2. Scatter plots visualizing association between PACC5 and measures of allostatic load (global measure, sympathetic functioning and lipid metabolism). Regressions were used for visual display only, and not as a substitute of the full GLMM statistics presented in Table 5.
Table 6. Statistical outcome of the GLMM seeking for associations between PACC5 (dependent variable) and global sleep quality, and its sub-scores (n = 80; one outlier removed).
Estimate ±SE F value (df) P
Sex −1.69 ± .63 7.24 (1,76) .009 (Rsp2=.09)
Age −.18 ± .30 .36 (1,76) .55
Sleep Quality (global) −.002 ± .31 .0 (1,76) .99
Sex −1.67 ± .64 6.75 (1,74) .01 (Rsp2=.08)
Age −.16 ± .34 .23 (1,74) .63
IV −.03 ± .39 .01 (1,74) .93
PSQI −.03 ± .30 .01 (1,74) .92
ESS −.05 ± .30 .02 (1,74) .88
Grey and white parts represent distinct models. Rsp2: Semi-partial R2; SE: Standard Error; df: degrees of freedom; IV: Intradaily variability; PSQI: Pittsburgh Sleep Quality Index; ESS: Epworth Sleepiness Scale.
Table 7. Statistical outcome of the GLMM seeking for associations between PACC5 (dependent variable), cognitive reserve, allostatic load, and their sub-scores that were significant in previous models (n = 67; 12 outliers removed; 2 missing data).
Estimate ±SE F value (df) P
Sex −2.09 ± .65 10.36 (1,62) .002 (Rsp2=.14)
Age −.29 ± .30 .93 (1,62) .34
Cognitive Reserve (global) .74 ± .33 5.01 (1,62) .03 (Rsp2=.07)
Allostatic Load (global) −.44 ± .32 1.85 (1,62) .18
Sex −1.58 ± .60 6.99 (1,61) .01 (Rsp2=.10)
Age −.46 ± .28 2.68 (1,61) .11
fNART 1.09 ± .31 12.01 (1,61) .001 (Rsp2=.16)
Sympathetic functioning −.65 ± .31 4.40 (1,61) .04 (Rsp2=.07)
Lipid metabolism −.73 ± .31 5.42 (1,61) .02 (Rsp2=.08)
Grey and white parts represent distinct models. Rsp2: Semi-partial R2, SE: Standard Error; df: degrees of freedom, fNART: National Adult Reading Test (French version).
and lipid metabolism seem to be important factors for global cognition in midlife. The measurement of sympathetic functioning was based on 24-h urinary adrenaline and noradrenaline excretion, the latter being the main sympathetic neurotransmitter in circulatory regulation [65]. Elevated levels of stress increase sympathetic arousal, which, in turn, impairs working memory and cognitive flexibility [66]. Similar processes may drive the association detected here. With regard to lipd metabolism, it was showed previously that high levels of total cholesterol and low-density lipoprotein (LDL) cholesterol, were associated with cognitive decline in older population [44], and that low-level of high-density lipoprotein (HDL) cholesterol is a risk factor for deficit and decline in memory in midlife [67, 68]. HDL cholesterol is critical for the maturation of synapses and maintenance of synaptic plasticity while LDL cholesterol is a proven risk factor for cardiovascular disease. Interestingly, our data showed that a global measure of lipid metabolism (including
body mass index and waist-to-hip circumference ratio) may already emphasize the negative effect of a high lipidic load on cognition in late middle-age. Finally, several studies showed that cardiovascular functioning is among the best physiological predictors of cognitive efficiency [10, 37, 38]. However, this is not what we have observed in our sub-factor analysis (with a tendency for higher level of cardiovascular issues related to better cognition), probably because cardiovascular measures (i.e. systolic blood pressure, heart rate) rarely exceeded normative cut-points in our sample [10], thus limiting inter-individual variability.
Importantly, the specific measures of crystallized intelligence, sympathetic nervous functioning and lipid metabolism jointly explained cognitive efficiency (with the larger explanatory power for the former) while the association between global allostatic load factor and PACC5 was no longer present when the global effect of cognitive reserve was taken into account. This suggest
that both global factors collectively contribute to cognitive efficiency, but with a lower explanatory power for allostatic load. Based on these results, we suggest that the global measure of allostatic load is partly determined by the level of cognitive reserve. Indeed, some lifestyle characteristics leading to high cognitive reserve (e.g. sociocultural level, educational level, employement, etc.) could establish living standards that promote low allostatic load (e.g. easy access to medical care, healthy food, low air pollution, etc.) [69, 70]. Another explanation could be that the variability of allostatic load in our sample is restricted in comparison to variability in cognitive reserve as we included participants with relatively good health status (i.e. no smokers, no sleep disorders, no excessive alcohol consumption, no diabetes, etc.), and exclusion criteria were unlikely to have repercussions on the measurement of cognitive reserve. Consequently, allostatic load could have a lower explanatory power due to an indirect selection bias.
We observed no associations between affective state or sleep-wake quality and cognitive efficiency, in contrast to several previous studies [28, 32, 46–49]. This suggests that, in our sample, affective and sleep-wake dimensions are less associated with PACC5 cognitive efficiency relative to CR and AL. We excluded volunteers with ongoing pharmacological treatment for depression or anxiety or with moderate to high levels of depression or anxiety according to established questionnaires. Moreover, we evaluated current affective state, while it may be the cumulative effect of chronic depression and anxiety that have more important negative impact on cognition [35, 71]. Consequently, future research should include lifetime affective dimensions. Furthermore, the type of sleep-wake measures we included, i.e. subjective perception of sleep and wakefulness quality, and actigraphy to quantify rest-activity cycle fragmentation [72], may explain the absence of association with cognitive efficiency in our sample. We did not include electroencephalography and/or polysomnography in the analyses which may provide a more refined phenotype. In addition, participants with sleep apnea were excluded, and our sample was relatively young and healthy. The high level of cognitive reserve of our sample may also prevent subtle differences in cognition to be associated with coarse measures of sleep and wakefulness quality. Previous associations between rest-activity fragmentation and cognition were detected in larger and older sample size that were not screened for sleep disorders (e.g. N = 144, age = 69.5 ± 8.5 in [46]; N = 737, age = 81.6 ± 7.2 in [50]. In addition, even though our analyses suggest that no direct interaction between parameters could explain our findings (see Methods section), complex or indirect interactions between sleep-wake quality or affective dimensions and either CR or AL may still exist (e.g.
anxiety may affect sleep quality which in turn may affect AL).
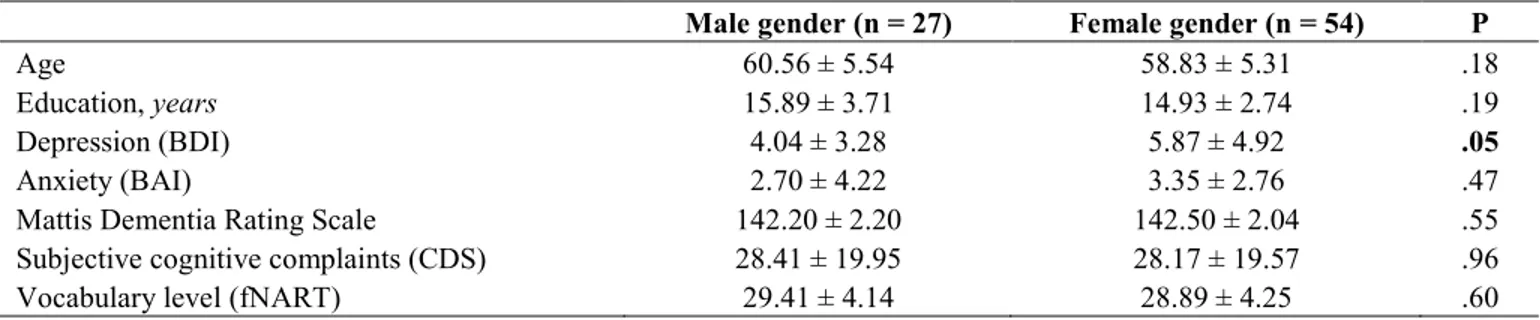
We also observed an unexpected sex effect, with women performing better than men in most of our statistical models, and these results cannot be explained by differences in factors such as age, education, tendencies for depression or anxiety, or subjective cognitive complaints (see Table 8). Presence of sex differences on multi-compound scores was sometimes reported in the literature [73], but not systematically [56]. Proposed mechanisms to explain sex effect might involve hormonal differences [74], genetic factors, differences in brain networks, socioeconomic roles, and health choices [75].
The main aim of this study was to assess whether factors known to influence cognitive fitness in aging would be associated with cognitive performance in late middle-aged individuals. We demonstrated that global measures of cognitive reserve and allostatic load significantly explain cognitive efficiency in our participants. In our late middle-aged healthy and cognitively normal sample devoid of sleep apnea, these associations were stronger than potential undetected links between PACC5 scores and affective status and sleep-wake quality measured through questionnaires and actigraphy. These results can be discussed in the context of the revised model of
Scaffolding Theory of Aging and Cognition (STAC-r,
proposed by Reuter-Lorenz & Park [76]) that combines a life-span and a life-course approach to understand and predict cognitive status and rate of cognitive change over time. Indeed, the model proposes that low global allostatic load decreases the negative influence of physiological stress on brain structures and functions, potentially leading to increased possibility of preservation of neural resources (brain maintenance, see [76]). Furthermore, a high level of cognitive reserve might have a positive influence both on the build-up of cognitive compensatory strategies, and also on the implementation of brain compensatory networks [76]. The STAC-r model also states that the two factors can act independently on cognition, as shown by the absence of interactive effects in our statistical models. Finally, we have observed a larger impact of cognitive reserve than allostatic load (see Rsp2 in Table 7). As previously
discussed, the influence of cognitive reserve is here mainly driven by crystallized intelligence that would lead to better socio-economic level (see [60]), and consequently, to a lifestyle with lower allostatic load [77]. Our protocol did not assess how brain neurotransmitters could affect the effect of cognitive reserve on cognition so we can only speculate about potential mechanisms. For example, cholinergic neurotransmission may be involved as it was associated with brain plasticity and showed to affect episodic memory
Table 8. T-test comparisons of socio-demographic characteristics, depression, anxiety, dementia scale, subjective cognitive complaints, and vocabulary level according to sex in study sample (n = 81): mean ± standard deviation.
Male gender (n = 27) Female gender (n = 54) P
Age 60.56 ± 5.54 58.83 ± 5.31 .18
Education, years 15.89 ± 3.71 14.93 ± 2.74 .19
Depression (BDI) 4.04 ± 3.28 5.87 ± 4.92 .05
Anxiety (BAI) 2.70 ± 4.22 3.35 ± 2.76 .47
Mattis Dementia Rating Scale 142.20 ± 2.20 142.50 ± 2.04 .55
Subjective cognitive complaints (CDS) 28.41 ± 19.95 28.17 ± 19.57 .96
Vocabulary level (fNART) 29.41 ± 4.14 28.89 ± 4.25 .60
BDI: Beck Depression Inventory [80]; BAI: Beck Anxiety Inventory [81]; CDS: Cognitive Difficulties Scale [100]; fNART: National Adult Reading Test (French version).
performance in healthy older individuals [78], and correlated with proxies of cognitive reserve (education and occupation) in prodromal and early stages of Alzheimer’s disease [79].
This study provided information on psychological and physiological mechanisms influencing cognition in aging people free of major comorbidities or health issues. These results should be replicated by including participants with unhealthy lifestyles (high alcohol consumption, smoking, or drug habits), or with common age-related health issues (obesity, diabetes, untreated hypertension or sleep apnea, etc.). This should allow to generalize the significance of this study and hopefully resolve some contradictory findings observed in previous papers [29, 32, 37, 38, 46–48].
In conclusion, our results indicate that allostatic load and cognitive reserve most strongly predict cognitive efficiency in healthy late middle-age. Interestingly, these factors are modifiable [7], thus we can act on both across the whole lifespan by following a healthy way of life (e.g. health monitoring, stress management, Mediterranean diet, etc.) and promoting a cognitively stimulating environment (e.g., acquiring new knowledge or abilities, social and intellectual leisure activities, etc.) [76]. Future research should therefore implement multimodal prevention program in middle-age population at risk for dementia, in order to confirm that improvement of these factors allow the preservation of cognitive efficiency, and maybe prevent or delay dementia in later life.
MATERIALS AND METHODS
Participants were healthy late middle-aged (50 to 69
y.o.) French speaking men and women (Table 1; N=81; 54 women [66.7%]). No participants reported any recent history of neurological or psychiatric disease, or were taking medication likely to affect the central nervous system. All had normal or corrected-to-normal vision
and hearing. Other exclusion criteria were sleep apnea/ hypopnea index ≥ 15/h, assessed during an in-lab night of sleep under polysomnography, body mass index < 18 and > 29 kg/m², smoking, illicit drug consumption, excessive consumption of caffeine (> 4 cups/day) or alcohol (> 14 units/week), diabetes, and shift-work. Participants with high levels of depression and anxiety as assessed by the Beck Depression Inventory [80] and by the 21-items self-rated Beck Anxiety Inventory [81], respectively, were excluded (i.e. score > 17), as well as participants with clinical level of depression or anxiety with ongoing pharmacological treatment. Moreover, participants with treated (> 6 months) hypertension and hypothyroidism were included. All participants showed normal performance on the Mattis Dementia Rating Scale [82] [i.e. score > 130], eliminating individuals with neuropsychological evidence of cognitive impairment. The experimental procedures were approved by the Local Ethics Committee of the Faculty of Medicine (University of Liege). All participants gave their signed informed consent prior to the experiment and received a financial compensation.
Neuropsychological examination consisted of a
battery of cognitive tasks assessing short-term and episodic memory, attentional and executive functions. Original Preclinical Alzheimer’s Cognitive Composite 5 (PACC5) score [56, 57] was computed as the sum of z-scores of the following cognitive measures: Free and
Total Recall in the Free and Cued Selective Reminding Test (FCSRT) [83], Delayed Recall in the Logical Memory Test [84], Total score in the Digit Symbol Substitution Test [85], scores in the Verbal Fluency Test
for the categories of Animals, Fruits and Vegetables (1 min each), and Mini Mental State Examination [86]. Here we introduced three changes to the initial PACC5: Mini Mental State Examination was replaced by the score from the Mattis Dementia Rating Scale, the Verbal Fluency Test score was calculated for the animal category only, and a more recent version of the Digit
Symbol Substitution Test having a larger range of scores was used [87].
Neuropsychological evaluation was performed during 2 sessions taking approximately 75 min each. As our study was designed for several research objectives, additional neuropsychological tasks were included in the assessment, which are not mentioned here.
Cognitive reserve was determined based on a
computerized version of lifestyle questionnaire [88] assessing educational level, occupational demands, physical activities, and leisure activities across the lifespan.
Educational level was calculated as the number of
completed years of formal education.
Crystallized intelligence was assessed as the total score
at the National Adult Reading Test French version (fNART) [89].
Occupational demands’ score was calculated as the
level and the duration of cognitive load associated with work experience during lifespan, and is expressed by the following formula: Occupation=
∑
in=1(c h yi× ×i i), where: ci represents cognitive load classified according to the International Standard Classification of Occupations from the International Labour Organization [90, 91]; hi represents the number of hours per week for the occupation; yi – the number of years at a job; n – number of occupations across the lifespan.Physical activity’s score was calculated as Metabolic
Equivalent of Task (MET) per week over the lifespan [92]. Self-report of any regular physical activities since age 12 were collected together with their estimated intensity (low or high), number of years of practice, number of months per year, and number of hours per week. MET was computed as follows:
5
1( )
X i i i
P =
∑
= MET t× , where: PX – life period (4 different periods); METi – MET of one physical activity; ti –hours per week. Thus, the global physicalactivity’s score is the average MET per week during
4 life periods (12–18 y.o., 19–34 y.o., 35–49 y.o., and after 50 y.o.).
Leisure activities’ score was based on being engaged or
not in 9 leisure activities since age 6: reading books, reading journals, domestic activities, mental solitary activity, cultural activity, artistic activity, volunteering, social activity, and social games. For each activity, participants had to indicate life periods of practice,
frequency, and time interval (e.g. from 6 to 12 y.o., once per week). Separate leisure activities’ scores were calculated as follows: Li =
∑
in=1(f t pi× ×i i), where: Li – one type of leisure activity; n – number of life periods; fi – frequency of leisure activity (e.g. playing social game one time); ti – time interval of leisure activity (e.g. playing social game fi times a week);pi – life period (number of years). Activities not practiced at all were scored 0. Thus, the global leisure
activities’ score is the average of the scores for the 9
leisure activities.
Global score of cognitive reserve was computed as a z-score of the average of all z-z-scored measures. Higher values in all cognitive reserve measures mean better cognitive reserve.
Affective state was measured as the averaged z-scores
of two questionnaires collected after one of the neuropsychological evaluation sessions, the Beck Depression Inventory (BDI) [80], and the Beck Anxiety Inventory (BAI) [81]. Higher values mean worse affective state.
Allostatic load was assessed via a comprehensive range
of measures [10]. The global score of allostatic load was calculated as the z-score of the average of its 7 sub-scores presented below. Each of seven sub-sub-scores was also calculated as the z-score of the average of the constituting measures. Each participant underwent an electrocardiography (ECG) recording via 2 sub-clavicular bipolar electrodes using Embla N7000 amplifier (Natus, Pleasanton, USA) during 5 min at rest in semirecumbent position in the evening (app. 1h prior to habitual sleep time). Fasting blood sample was also collected from each participant upon awakening in the morning. Moreover, 24-hour urine collection was also carried out in the lab.
Parasympathetic nervous system functioning was
calculated based on 2 ECG measures computed by Embla RemLogic software (Natus, Pleasanton, USA): standard deviation of the average heart beat-to-beat intervals (SDANN), and root mean square of successive differences between normal heartbeats (RMSSD).
Cardiovascular functioning was calculated based on
measures of systolic blood pressure, heart rate during ECG recordings, and pulse pressure (difference between the systolic and diastolic pressure at rest).
Lipid metabolism was calculated based on measures of
body mass index (BMI), waist-hip ratio and blood measures of low-density lipoprotein cholesterol (LDL),
high-density lipoprotein cholesterol (HDL), and triglycerides.
Glucose metabolism was calculated based on blood
measures of glycated hemoglobin (HbA1C) level and glucose level.
Chronic inflammation was calculated based on blood
measures of C-reactive protein level and interleukin-6 level.
HPA axis functioning was calculated based on measures
of blood dehydroepiandrosterone sulfate (DHEA-S), and urinary 24-hour excretion of cortisol. Cortisol excretion was corrected for serum creatinine level to adjust for lean body mass [10].
Sympathetic nervous system functioning was calculated
based on the following urinary measures: 24-hour excretion of adrenaline, and 24-hour excretion of noradrenaline. Both adrenaline and noradrenaline excretion were also corrected for serum creatinine level to adjust for lean body mass [10].
Higher raw values in physiological measures mean higher allostatic load, to the exception of HDL, DHEA-S, SDANN, and RMSSD values. Consequently, the signs of HDL, DHEA-S, SDANN and RMSSD were reversed when calculating respectively lipid metabolism, HPA axis functioning, and parasympathetic nervous system functioning. Therefore, higher values in the global score of allostatic load and its sub-scores mean higher allostatic load.
Sleep-wake quality was measured based one objective
(actigraphy) and two subjective measures (questionnaires).
Intradaily variability (IV), which measures the
fragmentation of the rest-activity cycle, and is a proxy of sleep-wake fragmentation [93], was obtained from actigraphy data (Actiwatch AW4, CamNtech Ltd., Cambridge, UK) collected during 14 days, without any instruction with respect to sleep and wake. We used in-house software for automatic actigraphy scoring (pyActigraphy v0.1; DOI: http://doi.org/10.5281/
zenodo.2537921). Periods of inactivity exceeding 120
min were excluded from the analysis. Actigraphy data was hourly clustered, epoch length defined as 1 min, and activity threshold set at 4 per min for subsequent data binarization. Finally, intradaily variability [94] was calculated using the following formula: IV = c1h/d1h, with:
2 1h n( i ) i x x d n − =
∑
, and with: 1 1( 1 ) 2 1 n h i i i x x c n − + − = −∑
,where xi is the number of active minutes during the ith period, x is the mean of all data, and n is the
number of periods covered by the actigraphy data. Higher IV reflects more fragmented rest-activity cycle.
Subjective sleep quality was evaluated using the
Pittsburgh Sleep Quality Index (PSQI [95]) Higher values on PSQI show higher degree of sleep disturbances.
Excessive daytime sleepiness was assessed using
Epworth Sleepiness Scale (ESS [96]), with higher values indicating higher daytime sleepiness.
Overall sleep-wake quality was computed as the z-score of averaged z-scores of the three aforementioned factors, with higher value reflecting worse sleep-wake quality.
Statistical analyses
All statistical analyses were performed with SAS 9.4 for Windows (SAS Institute, Cary, USA). Generalized linear mixed models (GLMM; PROC GLIMMIX) were applied to compute all statistics following the determination of the distribution of dependent variables using ‘allfitdist’ function on MATLAB R2013a (MathWorks Inc., Natick, USA). In all GLMM, collinearity diagnosis was performed on all predictors using Tolerance (TOL) and Variance Inflation Factors (VIF) as criteria. Degrees of freedom (DF) were estimated using Kenward-Roger’s correction. Subject (intercept) effect was included as a random factor. We defined p-value < 0.05 as significant. Data points situated ± 3 SD from their mean were defined as outliers and removed. As a result, sample size ranged from 67 to 80 across models; each of the 81 participants contributed to at least 6 models in Tables 3 to 7.
All models included PACC5 as the dependent variable, and controlled for sex and age. At first, GLMM evaluated the association of each global factor (cognitive reserve, affective state, allostatic load, and sleep quality) with PACC5 in separate models. Then, models included each component of the global factor (e.g. cognitive reserve was decomposed into its sub-factors). The final models included the significant predictors of PACC5 that were identified for each factor. Comparison of Bayesian Information Criterion (BIC) values for models with and without interactive term showed better explanatory power when interaction effects were not modelled. Consequently, only models without interaction term were analysed. Semi-partial R2 (Rsp2) was reported for each
significant effect as described previously [97], provided that DF are estimated using Kenward-Roger’s methods. Due to outlier values (± 3 SD), DF and sample size vary from one model to another (from N = 67 to N = 80). We estimated the sensitivity of our analyses using G*Power 3.1.9.4 software taking into account our
sample size (n = 81), a power of .8, type I error probability = .05 [98, 99] in a one t-tailed linear multiple regression model including sex and age as predictor. This analyses indicated that the minimal effect size we could detect was r = .28 (R2 = .08).
ACKNOWLEDGMENTS
We thank M. Blanpain, L. Pietquin, X. Pépin, M. Cerasuolo, G. Boraita-Amador, E. Tezel, D. Marzoli, L. Veithen, P. Cardone, C. Hagelstein, E. Lambot, S. Laloux, A. Claes, B. Herbillon, B. Lauricella, P. Hawotte, C. Le Goff, E. Cavalier for their help in different steps of the research project.
CONFLICTS OF INTEREST
All the authors declare no actual or potential conflict of interests.
FUNDING
This work was supported by the National Fund for Scientific Research (FRS-FNRS, FRSM 3.4516.11, Belgium), the Wallonia-Brussels Federation (grant for Concerted Research Actions – SLEEPDEM), University of Liège, Fundation Simone and Pierre Clerdent, European Regional Development Fund (ERDF, Radiomed Project). J.N. was supported by University of
Liège. M.V.E., P.G., C.S., C.B., G.V., F.C. were supported by the FNRS-Belgium. None of funding sources had an involvement in study design; in the collection, analysis, interpretation of data; in the writing of the report; in the decision to submit the article for publication.
REFERENCES
1. Eckert MA, Keren NI, Roberts DR, Calhoun VD, Harris KC. Age-related changes in processing speed: unique contributions of cerebellar and prefrontal cortex. Front Hum Neurosci. 2010; 4:10.
https://doi.org/10.3389/neuro.09.010.2010
PMID:20300463
2. Fjell AM, Sneve MH, Grydeland H, Storsve AB, Walhovd KB. The Disconnected Brain and Executive Function Decline in Aging. Cereb Cortex. 2017; 27:2303–17.
https://doi.org/10.1093/cercor/bhw082
PMID:27073220
3. Olaya B, Bobak M, Haro JM, Demakakos P. Trajectories of Verbal Episodic Memory in Middle-Aged and Older Adults: Evidence from the English Longitudinal Study of Ageing. J Am Geriatr Soc. 2017; 65:1274–81.
https://doi.org/10.1111/jgs.14789 PMID:28263362
4. Rönnlund M, Nyberg L, Bäckman L, Nilsson LG. Stability, growth, and decline in adult life span development of declarative memory: cross-sectional and longitudinal data from a population-based study. Psychol Aging. 2005; 20:3–18.
https://doi.org/10.1037/0882-7974.20.1.3
PMID:15769210
5. Nyberg L, Lövdén M, Riklund K, Lindenberger U, Bäckman L. Memory aging and brain maintenance. Trends Cogn Sci. 2012; 16:292–305.
https://doi.org/10.1016/j.tics.2012.04.005
PMID:22542563
6. de Frias CM, Lövdén M, Lindenberger U, Nilsson LG. Revisiting the dedifferentiation hypothesis with longitudinal multi-cohort data. Intelligence. 2007; 35:381–92.
https://doi.org/10.1016/j.intell.2006.07.011
7. Norton S, Matthews FE, Barnes DE, Yaffe K, Brayne C. Potential for primary prevention of Alzheimer’s disease: an analysis of population-based data. Lancet Neurol. 2014; 13:788–94.
https://doi.org/10.1016/S1474-4422(14)70136-X
PMID:25030513
8. Stern Y, Arenaza-Urquijo EM, Bartrés-Faz D, Belleville S, Cantilon M, Chetelat G, Ewers M, Franzmeier N, Kempermann G, Kremen WS, Okonkwo O, Scarmeas N, Soldan A, et al. Whitepaper: Defining and investigating cognitive reserve, brain reserve, and brain maintenance. Alzheimers Dement. 2018; [Epub ahead of print].
https://doi.org/10.1016/j.jalz.2018.07.219
PMID:30222945
9. da Silva J, Gonçalves-Pereira M, Xavier M, Mukaetova-Ladinska EB. Affective disorders and risk of developing dementia: systematic review. Br J Psychiatry. 2013; 202:177–86.
https://doi.org/10.1192/bjp.bp.111.101931
PMID:23457181
10. Karlamangla AS, Miller-Martinez D, Lachman ME, Tun PA, Koretz BK, Seeman TE. Biological correlates of adult cognition: Midlife in the United States (MIDUS). Neurobiol Aging. 2014; 35:387–94.
https://doi.org/10.1016/j.neurobiolaging.2013.07.028
PMID:24011541
11. Benedict C, Byberg L, Cedernaes J, Hogenkamp PS, Giedratis V, Kilander L, Lind L, Lannfelt L, Schiöth HB. Self-reported sleep disturbance is associated with Alzheimer’s disease risk in men. Alzheimers Dement. 2015; 11:1090–97.
https://doi.org/10.1016/j.jalz.2014.08.104
PMID:25438949
Grady CL, Lindenberger U, Nyberg L, Park DC, Reuter-Lorenz PA, Rugg MD, Steffener J, Rajah MN. Maintenance, reserve and compensation: the cognitive neuroscience of healthy ageing. Nat Rev Neurosci. 2018; 19:701–10.
https://doi.org/10.1038/s41583-018-0068-2
PMID:30305711
13. Fratiglioni L, Wang HX. Brain reserve hypothesis in dementia. J Alzheimers Dis. 2007; 12:11–22.
https://doi.org/10.3233/JAD-2007-12103
PMID:17851191
14. Meng X, D’Arcy C. Education and dementia in the context of the cognitive reserve hypothesis: a systematic review with meta-analyses and qualitative analyses. PLoS One. 2012; 7:e38268.
https://doi.org/10.1371/journal.pone.0038268
PMID:22675535
15. Osone A, Arai R, Hakamada R, Shimoda K. Impact of cognitive reserve on the progression of mild cognitive impairment to Alzheimer’s disease in Japan. Geriatr Gerontol Int. 2015; 15:428–34.
https://doi.org/10.1111/ggi.12292 PMID:24730644
16. Bright P, Hale E, Gooch VJ, Myhill T, van der Linde I. The National Adult Reading Test: restandardisation against the Wechsler Adult Intelligence Scale-Fourth edition. Neuropsychol Rehabil. 2018; 28:1019–27.
https://doi.org/10.1080/09602011.2016.1231121
PMID:27624393
17. Andel R, Silverstein M, Kåreholt I. The role of midlife occupational complexity and leisure activity in late-life cognition. J Gerontol B Psychol Sci Soc Sci. 2015; 70:314–21.
https://doi.org/10.1093/geronb/gbu110
PMID:25190210
18. Ansiau D, Marquié JC, Soubelet A, Ramos S. Relationships between cognitive characteristics of the job, age, and cognitive efficiency. Int Congr Ser. 2005; 1280:43–48.
https://doi.org/10.1016/j.ics.2005.01.020
19. Baldivia B, Andrade VM, Bueno OF. Contribution of education, occupation and cognitively stimulating activities to the formation of cognitive reserve. Dement Neuropsychol. 2008; 2:173–82.
https://doi.org/10.1590/S1980-57642009DN20300003 PMID:29213567
20. Bosma H, van Boxtel MP, Ponds RW, Houx PJ, Burdorf A, Jolles J. Mental work demands protect against cognitive impairment: MAAS prospective cohort study. Exp Aging Res. 2003; 29:33–45.
https://doi.org/10.1080/03610730303710
PMID:12735080
21. Then FS, Luck T, Luppa M, Thinschmidt M, Deckert S, Nieuwenhuijsen K, Seidler A, Riedel-Heller SG. Systematic review of the effect of the psychosocial working environment on cognition and dementia. Occup Environ Med. 2014; 71:358–65.
https://doi.org/10.1136/oemed-2013-101760
PMID:24259677
22. Schooler C, Mulatu MS, Oates G. The continuing effects of substantively complex work on the intellectual functioning of older workers. Psychol Aging. 1999; 14:483–506.
https://doi.org/10.1037/0882-7974.14.3.483
PMID:10509702
23. Wang HX, Xu W, Pei JJ. Leisure activities, cognition and dementia. Biochim Biophys Acta. 2012; 1822:482–91.
https://doi.org/10.1016/j.bbadis.2011.09.002
PMID:21930203
24. Ferreira D, Machado A, Molina Y, Nieto A, Correia R, Westman E, Barroso J. Cognitive variability during middle-age: possible association with neurodegeneration and cognitive reserve. Front Aging Neurosci. 2017; 9:188.
https://doi.org/10.3389/fnagi.2017.00188
PMID:28649200
25. Reynolds K, Pietrzak RH, El-Gabalawy R, Mackenzie CS, Sareen J. Prevalence of psychiatric disorders in U.S. older adults: findings from a nationally representative survey. World Psychiatry. 2015; 14:74–81.
https://doi.org/10.1002/wps.20193 PMID:25655161 26. Rodda J, Walker Z, Carter J. Depression in older
adults. BMJ. 2011; 343:d5219.
https://doi.org/10.1136/bmj.d5219 PMID:21957206
27. Dotson VM, Szymkowicz SM, Kirton JW, McLaren ME, Green ML, Rohani JY. Unique and interactive effect of anxiety and depressive symptoms on cognitive and brain function in young and older adults. J Depress Anxiety. 2014 (Suppl 1); S1:1–23.
https://doi.org/10.4172/2167-1044.S1-003
PMID:25383262
28. Beaudreau SA, O’Hara R. The association of anxiety and depressive symptoms with cognitive performance in community-dwelling older adults. Psychol Aging. 2009; 24:507–12.
https://doi.org/10.1037/a0016035 PMID:19485667
29. Yochim BP, Mueller AE, Segal DL. Late life anxiety is associated with decreased memory and executive functioning in community dwelling older adults. J Anxiety Disord. 2013; 27:567–75.
https://doi.org/10.1016/j.janxdis.2012.10.010
PMID:23298889
Haroutunian V, Gorman JM. Neuropsychological differences between late-onset and recurrent geriatric major depression. Am J Psychiatry. 2005; 162:691–98.
https://doi.org/10.1176/appi.ajp.162.4.691
PMID:15800140
31. Elderkin-Thompson V, Mintz J, Haroon E, Lavretsky H, Kumar A. Executive dysfunction and memory in older patients with major and minor depression. Arch Clin Neuropsychol. 2007; 22:261–70.
https://doi.org/10.1016/j.acn.2007.01.021
PMID:17443924
32. Von Hippel W, Vasey MW, Gonda T, Stern T. Executive function deficits, rumination and late-onset depressive symptoms in older adults. Cognit Ther Res. 2008; 32:474–87.
https://doi.org/10.1007/s10608-006-9034-9
33. Kassem AM, Ganguli M, Yaffe K, Hanlon JT, Lopez OL, Wilson JW, Cauley JA, and Osteoporotic Fractures in Men (MrOS) Study Research Group. Anxiety symptoms and risk of cognitive decline in older community-dwelling men. Int Psychogeriatr. 2017; 29:1137–45.
https://doi.org/10.1017/S104161021700045X
PMID:28390447
34. Dotson VM, Beydoun MA, Zonderman AB. Recurrent depressive symptoms and the incidence of dementia and mild cognitive impairment. Neurology. 2010; 75:27–34.
https://doi.org/10.1212/WNL.0b013e3181e62124
PMID:20603482
35. Singh-Manoux A, Dugravot A, Fournier A, Abell J, Ebmeier K, Kivimäki M, Sabia S. Trajectories of depressive symptoms before diagnosis of dementia: A 28-year follow-up study. JAMA Psychiatry. 2017; 74:712–18.
https://doi.org/10.1001/jamapsychiatry.2017.0660
PMID:28514478
36. Gimson A, Schlosser M, Huntley JD, Marchant NL. Support for midlife anxiety diagnosis as an independent risk factor for dementia: a systematic review. BMJ Open. 2018; 8:e019399.
https://doi.org/10.1136/bmjopen-2017-019399
PMID:29712690
37. Gupta A, Preis SR, Beiser A, Devine S, Hankee L, Seshadri S, Wolf PA, Au R. Mid-life Cardiovascular Risk Impacts Memory Function: The Framingham Offspring Study. Alzheimer Dis Assoc Disord. 2015; 29:117–23.
https://doi.org/10.1097/wad.0000000000000059
PMID:25187219
38. Dahle CL, Jacobs BS, Raz N. Aging, vascular risk, and cognition: blood glucose, pulse pressure, and cognitive performance in healthy adults. Psychol Aging. 2009; 24:154–62.
https://doi.org/10.1037/a0014283 PMID:19290746
39. Zeki Al Hazzouri A, Elfassy T, Carnethon MR, Lloyd-Jones DM, Yaffe K. Heart Rate Variability and Cognitive Function In Middle-Age Adults: The Coronary Artery Risk Development in Young Adults. Am J Hypertens. 2017; 31:27–34.
https://doi.org/10.1093/ajh/hpx125 PMID:28985245 40. Sartori AC, Vance DE, Slater LZ, Crowe M. The impact
of inflammation on cognitive function in older adults: implications for healthcare practice and research. J Neurosci Nurs. 2012; 44:206–17.
https://doi.org/10.1097/JNN.0b013e3182527690
PMID:22743812
41. Ownby RL. Neuroinflammation and cognitive aging. Curr Psychiatry Rep. 2010; 12:39–45.
https://doi.org/10.1007/s11920-009-0082-1
PMID:20425309
42. Wright CB, Sacco RL, Rundek T, Delman J, Rabbani L, Elkind M. Interleukin-6 is associated with cognitive function: the Northern Manhattan Study. J Stroke Cerebrovasc Dis. 2006; 15:34–38.
https://doi.org/10.1016/j.jstrokecerebrovasdis.2005. 08.009 PMID:16501663
43. Karlamangla AS, Singer BH, Greendale GA, Seeman TE. Increase in epinephrine excretion is associated with cognitive decline in elderly men: MacArthur studies of successful aging. Psychoneuroendocrinology. 2005; 30:453–60.
https://doi.org/10.1016/j.psyneuen.2004.11.004
PMID:15721057
44. Ma C, Yin Z, Zhu P, Luo J, Shi X, Gao X. Blood cholesterol in late-life and cognitive decline: A longitudinal study of the Chinese elderly. Mol Neurodegener. Mol Neurodegener. 2017; 12:1–9.
https://doi.org/10.1186/s13024-017-0167-y
PMID:28270179
45. Seeman TE, McEwen BS, Rowe JW, Singer BH, Seeman TE. Allostatic load as a marker of cumulative biological risk: MacArthur studies of successful aging. Proc Natl Acad Sci USA. 2001; 98:4770–75.
https://doi.org/10.1073/pnas.081072698
PMID:11287659
46. Oosterman JM, van Someren EJ, Vogels RL, Van Harten B, Scherder EJ. Fragmentation of the rest-activity rhythm correlates with age-related cognitive deficits. J Sleep Res. 2009; 18:129–35.
https://doi.org/10.1111/j.1365-2869.2008.00704.x
PMID:19250179
47. Ohayon MM, Vecchierini MF. Daytime sleepiness and cognitive impairment in the elderly population. Arch Intern Med. 2002; 162:201–08.
https://doi.org/10.1001/archinte.162.2.201
PMID:11802754
48. Waller KL, Mortensen EL, Avlund K, Osler M, Fagerlund B, Lauritzen M, Jennum P. Subjective sleep quality and daytime sleepiness in late midlife and their association with age-related changes in cognition. Sleep Med. 2016; 17:165–73.
https://doi.org/10.1016/j.sleep.2015.01.004
PMID:26188599
49. Gadie A, Shafto M, Leng Y, Cam-CAN, Kievit RA. How are age-related differences in sleep quality associated with health outcomes? An epidemiological investigation in a UK cohort of 2406 adults. BMJ Open. 2017; 7:e014920.
https://doi.org/10.1136/bmjopen-2016-014920
PMID:28760786
50. Lim AS, Kowgier M, Yu L, Buchman AS, Bennett DA. Sleep Fragmentation and the Risk of Incident Alzheimer’s Disease and Cognitive Decline in Older Persons. Sleep. 2013; 36:1027–32.
https://doi.org/10.5665/sleep.2802 PMID:23814339 51. Falck RS, Best JR, Davis JC, Liu-Ambrose T. The
Independent Associations of Physical Activity and Sleep with Cognitive Function in Older Adults. J Alzheimers Dis. 2018; 63:1469–84.
https://doi.org/10.3233/JAD-170936 PMID:29782311
52. Ihle A, Oris M, Fagot D, Chicherio C, van der Linden BWA, Sauter J, Kliegel M. Associations of educational attainment and cognitive level of job with old age verbal ability and processing speed: The mediating role of chronic diseases. Appl Neuropsychol. 2018; 25:356–62.
https://doi.org/10.1080/23279095.2017.1306525
PMID:28368656
53. Zeki Al Hazzouri A, Haan MN, Neuhaus JM, Pletcher M, Peralta CA, López L, Pérez Stable EJ. Cardiovascular risk score, cognitive decline, and dementia in older Mexican Americans: the role of sex and education. J Am Heart Assoc. 2013; 2:e004978.
https://doi.org/10.1161/jaha.113.004978
PMID:23608609
54. Singh-Manoux A, Kivimaki M, Glymour MM, Elbaz A, Berr C, Ebmeier KP, Ferrie JE, Dugravot A. Timing of onset of cognitive decline: results from Whitehall II prospective cohort study. BMJ. 2012; 344:d7622.
https://doi.org/10.1136/bmj.d7622 PMID:22223828
55. Zelinski EM, Gilewski MJ. Effects of demographic and health variables on Rasch scaled cognitive scores. J Aging Health. 2003; 15:435–64.
https://doi.org/10.1177/0898264303253499
PMID:12914012
56. Donohue MC, Sperling RA, Salmon DP, Rentz DM,
Raman R, Thomas RG, Weiner M, Aisen PS, and Australian Imaging, Biomarkers, and Lifestyle Flagship Study of Ageing, and Alzheimer’s Disease Neuroimaging Initiative, and Alzheimer’s Disease Cooperative Study. The preclinical Alzheimer cognitive composite: measuring amyloid-related decline. JAMA Neurol. 2014; 71:961–70.
https://doi.org/10.1001/jamaneurol.2014.803
PMID:24886908
57. Papp KV, Rentz DM, Orlovsky I, Sperling RA, Mormino EC. Optimizing the preclinical Alzheimer’s cognitive composite with semantic processing: The PACC5. Alzheimers Dement (N Y). 2017; 3:668–77.
https://doi.org/10.1016/j.trci.2017.10.004
PMID:29264389
58. Starr JM, Lonie J. Estimated pre-morbid IQ effects on cognitive and functional outcomes in Alzheimer disease: a longitudinal study in a treated cohort. BMC Psychiatry. 2008; 8:27.
https://doi.org/10.1186/1471-244X-8-27
PMID:18426581
59. Manly JJ, Touradji P, Tang MX, Stern Y. Literacy and memory decline among ethnically diverse elders. J Clin Exp Neuropsychol. 2003; 25:680–90.
https://doi.org/10.1076/jcen.25.5.680.14579
PMID:12815505
60. Richards M, Sacker A. Lifetime antecedents of cognitive reserve. J Clin Exp Neuropsychol. 2003; 25:614–24.
https://doi.org/10.1076/jcen.25.5.614.14581
PMID:12815499
61. Plomin R. Genetics and general cognitive ability. Nature. 1999 (6761 Suppl); 402:C25–29.
https://doi.org/10.1038/35011520 PMID:10591222 62. Haworth CM, Wright MJ, Luciano M, Martin NG, de
Geus EJ, van Beijsterveldt CE, Bartels M, Posthuma D, Boomsma DI, Davis OS, Kovas Y, Corley RP, Defries JC, et al. The heritability of general cognitive ability increases linearly from childhood to young adulthood. Mol Psychiatry. 2010; 15:1112–20.
https://doi.org/10.1038/mp.2009.55 PMID:19488046
63. Berger SL, Kouzarides T, Shiekhattar R, Shilatifard A. An operational definition of epigenetics. Genes Dev. 2009; 23:781–83.
https://doi.org/10.1101/gad.1787609
PMID:19339683
64. Alegría-Torres JA, Baccarelli A, Bollati V. Epigenetics and lifestyle. Epigenomics. 2011; 3:267–77.
https://doi.org/10.2217/epi.11.22PMID:22122337
65. Carter JR, Goldstein DS. Sympathoneural and adrenomedullary responses to mental stress. Compr Physiol. 2015; 5:119–46.
https://doi.org/10.1002/cphy.c140030
PMID:25589266
66. Marko M, Riečanský I. Sympathetic arousal, but not disturbed executive functioning, mediates the impairment of cognitive flexibility under stress. Cognition. 2018; 174:94–102.
https://doi.org/10.1016/j.cognition.2018.02.004
PMID:29448083
67. Singh-Manoux A, Gimeno D, Kivimaki M, Brunner E, Marmot MG. Low HDL Cholesterol Is a Risk Factor for Deficit and Decline in Memory in Midlife The Whitehall II Study. Arterioscler Thromb Vasc Biol. 2008; 28:1556–62.
https://doi.org/10.1161/ATVBAHA.108.163998
PMID:18591462
68. Svensson T, Sawada N, Mimura M, Nozaki S, Shikimoto R, Tsugane S. The association between midlife serum high-density lipoprotein and mild cognitive impairment and dementia after 19 years of follow-up. Transl Psychiatry. 2019; 9:26.
https://doi.org/10.1038/s41398-018-0336-y
PMID:30659169
69. Cutler DM, Lleras-Muney A. Understanding differences in health behaviors by education. J Health Econ. 2010; 29:1–28.
https://doi.org/10.1016/j.jhealeco.2009.10.003
PMID:19963292
70. Prus SG. Comparing social determinants of self-rated health across the United States and Canada. Soc Sci Med. 2011; 73:50–59.
https://doi.org/10.1016/j.socscimed.2011.04.010
PMID:21664020
71. Petkus AJ, Reynolds CA, Wetherell JL, Kremen WS, Pedersen NL, Gatz M. Anxiety is associated with increased risk of dementia in older Swedish twins. Alzheimers Dement. 2016; 12:399–406.
https://doi.org/10.1016/j.jalz.2015.09.008
PMID:26549599
72. Mander BA, Marks SM, Vogel JW, Rao V, Lu B, Saletin JM, Ancoli-Israel S, Jagust WJ, Walker MP. β-amyloid disrupts human NREM slow waves and related hippocampus-dependent memory consolidation. Nat Neurosci. 2015; 18:1051–57.
https://doi.org/10.1038/nn.4035 PMID:26030850
73. Buckley RF, Mormino EC, Amariglio RE, Properzi MJ, Rabin JS, Lim YY, Papp KV, Jacobs HI, Burnham S, Hanseeuw BJ, Doré V, Dobson A, Masters CL, et al, and Alzheimer’s Disease Neuroimaging Initiative, and Australian Imaging, Biomarker and Lifestyle study of ageing, and Harvard Aging Brain Study. Sex, amyloid, and APOE ε4 and risk of cognitive decline in preclinical
Alzheimer’s disease: findings from three well-characterized cohorts. Alzheimers Dement. 2018; 14:1193–203.
https://doi.org/10.1016/j.jalz.2018.04.010
PMID:29803541
74. Koyama AK, Tworoger SS, Eliassen AH, Okereke OI, Weisskopf MG, Rosner B, Yaffe K, Grodstein F. Endogenous sex hormones and cognitive function in older women. Alzheimers Dement. 2016; 12:758–65.
https://doi.org/10.1016/j.jalz.2015.12.010
PMID:26806389
75. Deckers K, Nooyens A, van Boxtel M, Verhey F, Verschuren M, Köhler S. Gender and Educational Differences in the Association between Lifestyle and Cognitive Decline over 10 Years: The Doetinchem Cohort Study. J Alzheimers Dis. 2019; 70:S31–S41.
https://doi.org/10.3233/JAD-180492 PMID:30507570
76. Reuter-Lorenz PA, Park DC. How does it STAC up? Revisiting the scaffolding theory of aging and cognition. Neuropsychol Rev. 2014; 24:355–70.
https://doi.org/10.1007/s11065-014-9270-9
PMID:25143069
77. Zamroziewicz MK, Paul EJ, Zwilling CE, Johnson EJ, Kuchan MJ, Cohen NJ, Barbey AK. Parahippocampal Cortex Mediates the Relationship between Lutein and Crystallized Intelligence in Healthy, Older Adults. Front Aging Neurosci. 2016; 8:297.
https://doi.org/10.3389/fnagi.2016.00297
PMID:27999541
78. Richter N, Allendorf I, Onur OA, Kracht L, Dietlein M, Tittgemeyer M, Neumaier B, Fink GR, Kukolja J. The integrity of the cholinergic system determines memory performance in healthy elderly. Neuroimage. 2014; 100:481–88.
https://doi.org/10.1016/j.neuroimage.2014.06.031
PMID:24952230
79. Garibotto V, Tettamanti M, Marcone A, Florea I, Panzacchi A, Moresco R, Virta JR, Rinne J, Cappa SF, Perani D. Cholinergic activity correlates with reserve proxies in Alzheimer’s disease. Neurobiol Aging. 2013; 34:2694.e13–18.
https://doi.org/10.1016/j.neurobiolaging.2013.05.020
PMID:23820589
80. Beck AT, Ward CH, Mendelson M, Mock J, Erbaugh J. An inventory for measuring depression. Arch Gen Psychiatry. 1961; 4:561–71.
https://doi.org/10.1001/archpsyc.1961.01710120031 004 PMID:13688369
81. Beck AT, Epstein N, Brown G, Steer RA. An inventory for measuring clinical anxiety: psychometric properties. J Consult Clin Psychol. 1988; 56:893–97.